O
pen
A
rchive
T
OULOUSE
A
rchive
O
uverte (
OATAO
)
OATAO is an open access repository that collects the work of Toulouse researchers and
makes it freely available over the web where possible.
This is an author-deposited version published in :
http://oatao.univ-toulouse.fr/
Eprints ID : 15177
The contribution was presented at KES 2014 :
http://kes2014.kesinternational.org/
To cite this version :
Samulevicius, Saulius and Pitarch, Yoann and Pedersen,
Torben Bach Lattice-Based Spatio-temporal Prediction. (2014) In: 18th
International Conference on Knowledge-Based and Intelligent Information &
Engineering Systems (KES 2014), 15 September 2014 - 17 September 2014
(Gdynia, Poland).
Any correspondence concerning this service should be sent to the repository
administrator:
[email protected]
Lattice-based spatio-temporal ensemble prediction
Saulius Samuleviˇcius
a,∗, Yoann Pitarch
b, Torben Bach Pedersen
a aDepartment of Computer Science, Aalborg University, Selma Lagerl¨ofs Vej 300, 9220, DenmarkbUniversit´e of Toulouse, CNRS, IRIT UMR5505, F-31071, France
Abstract
With the rapidly increasing deployment of sensor networks, large amounts of time series data are generated. One of the main challenges when dealing with such data is performing accurate predictions in order to address a broad class of application problems, ranging from mobile broadband network (MBN) optimization to preventive maintenance. To this end, time series prediction has been widely addressed by the statistics community. Nevertheless, such approaches fail in performing well when the data are more context-dependent than history-dependent. In this paper, we investigate how latent attributes can be built upon the time series in order to define a spatio-temporal context for predictions. Moreover, such attributes are often hierarchical, leading to multiple potential contexts at different levels of granularity for performing a given prediction. In support of this scenario, we propose the Lattice-Based Spatio-Temporal Ensemble Prediction (LBSTEP) approach, which allows modeling the problem as a multidimensional spatio-temporal prediction. Given an ensemble prediction model, we propose a solution for determining the most appropriate spatio-temporal context that maximizes the global prediction metrics of a set of the time series. LBSTEP is evaluated with a real-world MBN dataset, which exemplifies the intended general application domain of time series data with a strong spatio-temporal component. The experimental results shows that the proposed contextual and multi-granular view of the prediction problem is effective, in terms of both several optimization metrics and the model calculation.
Keywords: Time series; prediction; spatio-temporal; ensemble; context; lattice; hierarchy; latent attributes
1. Introduction
Time series are one of the most prominent types of data nowadays. The massive increase of sensor network deployments, e.g., in smart cities, means that a tremendous number of time series are generated. To fully benefit from this potentially highly valuable data, one of the main challenges when dealing with the time series is performing an accurate estimation of the future values. Indeed, predicting time series allows addressing a broad class of application problems ranging from mobile broadband network (MBN) optimization to preventive maintenance.
The statistics community has addressed the time series prediction problem, a.k.a. forecasting, for decades. Multiple prediction strategies have been developed, ranging from well-known state of the art techniques, e.g., AutoRegressive
Corresponding author. Tel.: +0045-9940-3574 ; fax: +0045-9940-9798. E-mail address:[email protected]
Integrated Moving Average (ARIMA), which can deal with a broad range of prediction problems, to specific models,
e.g.,EGRV1, designed for accurate energy demand forecasts. Nevertheless, such approaches fail in performing well
when data are more dependent on context than history, especially when the context is spatio-temporal. For instance, let us consider hourly aggregated traffic in an MBN. In this scenario, the context is the most important for performing accurate predictiona. For instance, considering the type of the day, e.g., weekday or week-end, the hour of the day, as well as the node location might significantly impact the traffic load prediction, i.e., traffic will very likely be low in a shopping area during the night. The role of latent attributes, i.e., attributes that are built upon a given dataset, is most often decisive in the success of data mining or machine learning techniques2. From now we will call a context of a time series value a set of latent attributes values that spatially, temporally, etc., characterize this value.
In a previous work3, we have proposed STEP (Spatio-Temporal Ensemble Prediction), that starts considering this contextual aspect for unidimensional time series predictions. Roughly speaking, given a set of time series, each was considered separately and models were built for each hour and network node set. The proposed models were based on an ensemble strategy and are further extended in this paper. Nevertheless, attributes in a multidimensional context are often hierarchical. For instance, timestamps can be aggregated to hours that can further aggregated to either morning, afternoon, or night. Thus, considering that all attributes belonging to the context can be hierarchical, the main challenge is to determine which combination of levels is the best for achieving the most accurate prediction. Typically, STEP does not address this issue and forces the user to determine a priori this combination of levels of granularity.
In this paper, we go one step further by proposing LBSTEP (Lattice-Based Spatio-Temporal Ensemble Prediction), a multidimensional and multi-granular model for contextual attributes and investigate how to select the most appropri-ate models to perform the prediction. LBSTEP extends the STEP approach by (1) shifting from a single pre-defined context defined for unidimensional time series to varying contexts defined for uni/multidimensional time series, (2) proposing new ensemble strategies for combining the separate predictions, (3) providing heuristics for selecting the optimal model, and (4) providing new quality measures to accordingly select the most appropriate contexts. LBSTEP is targeted at time series with a strong spatio-temporal component. It has been validated on a real MBN dataset and the results show the effectiveness of LBSTEP, both quantitatively and qualitatively.
Section 2 presents a running example that is used throughout the rest of the paper. Section 3 introduces the defi-nitions while Section 4 presents the models for the multidimensional contexts. Our LBSTEP approach is developed in Section 5 and validated in Section 6. Finally, related work is discussed in Section 7 and some conclusions and perspectives are drawn in Section 8.
2. Running example
A Mobile Broadband Network (MBN) is composed of nodes (cells), each providing coverage for a limited area. Constant MBN development requires additional node deployment which creates overlapping areas and allows network optimization4. MBN traffic varies a lot, reaching the maximum network load levels only for a limited time. MBN
operators monitor many network parameters, e.g., the number of active users, traffic served by the node, etc. Collected MBN data can be used for network optimization, i.e., some network nodes can potentially be turned off during low load periods. Due to operational costs, it is infeasible to optimize MBNs based on only the current traffic level. Instead, MBN load prediction must be considered to achieve good network optimization3. Figure 1a provides hourly traffic measurements in MBs for a single node for 6 consecutive days. During the hours when the node carries less than 30 MB, the node can potentially be turned off. In Figure 1b, 24 consecutive Saturday traffic measurements of the selected node are provided. The dashed line shows traffic load changes. The straight line at 30MB splits traffic into two node load levels, i.e., unfilled triangles present when the traffic load is high and the node should remain turned on, and filled green triangles indicate low traffic periods when the node potentially could be turned off. We notice that MBN energy potentially could be saved between 2AM and 9AM on Saturday. Considering this observation, some questions naturally arise: (1) “Is this behavior observable for this network node only?”, (2) “Is the behavior observable every
Saturday, on weekdays, or week-end days?”, and more generally (3) “Can a spatio-temporal context be extracted such
that records belonging to this context will share the same behavior and benefit from a single prediction model?”. This paper provides a way to efficiently answer such questions.
922 .. ... ... ... .. . ... ... ... ... .. . .. . .. . .. . ... .. . .. . .. . .. . .. . .. . .. . 384 19 98 25 8 7 170 281 128 42 162 270 1 2 22 23 24 74 64 18 54 233 82 44 146 25 15 3 Tue Sun
Sat Mon Wed Thu
269 343 881 888 111 231 172 476 100 73 1601 1874 38 .
(a) MBN traffic (b) Optimization of node
Fig. 1. MBN details for a given node
3. Data definitions
A time series collection T is defined as a set of time series T = {T S1, . . . ,T Sn}such that each T Siis an ordered M-sequence T Si = %Ei1, . . . ,EMi &where EiM is the most recent event. An event Eijis a pair Eij =(Tij,valij) meaning that the time series T Sihad a value of val
j
i at time T j
i. For simplicity of exposition, we assume that the time series are regularly sampled (as is typical for time series) and have no missing values or noise. These assumptions typically hold for critical systems, like MBNs, being continuously monitored. In case they do not hold, cleansing techniques have to be applied; however, such cleansing techniques are orthogonal to the approach presented in this paper, and thus beyond the scope of the paper. On top of this time series definition, latent attributes, A1, . . . ,Ak, can be derived from time series to depict a more sophisticated view of the raw data. To do so, we define a uniform structure for the input as
Data =[T, A1,A2, ...,Ak,V] which extends the pair definition of the time series event. A tuple d = [t, a1,a2, ...,ak,v] in the Data has three main parts, i.e., the temporal dimension T , attributes A1,A2, . . . ,Ak, and the monitored value
V in the system. Each attribute Aiis assumed to be equipped with a hierarchy, denoted by Hi = H1i, . . . ,ALLi. The number of levels in the hierarchy Hiis given by S izeH(Hi) and the number of different attributes in hierarchy Hiat level j is given by S izeA(Hij). To identify which attribute values are aggregated when forming different hierarchy levels, we use the function Desc. The results of the Desc(Hdestination levelj ,asource levelj ) are attribute values at hierarchy level Hdestination levelj that form attribute asource levelj value. T represents the absolute discrete times of the start of the monitored periods. The temporal attribute T allows ordering tuples, e.g., d′ has occurred before d′′ if t′ < t′′.
Additional operations such as filtering continuous records or time series construction can be performed based on T . Attributes A1, . . . ,Ak represent the set of k latent and contextual attributes that will be used during the prediction. We assume that at least one attribute represents spatial details. A combination of the time attribute t and domain specific attributes a1, . . . ,akuniquely identifies the value v. As described previously, T is the absolute discrete time. The temporal dimension T can be viewed as linear or cyclic. Cyclic time represents reoccurring time cycles of the temporal element, e.g., seven days in the week, etc. We assume functions p1(t), . . . , pf(t) that can project cycles and be new attributes Ai, e.g., attribute A2= p1(t) is the projection of seven days and attribute A3= p2(t) is the projection
of 24 hours of the day.
Example 1. Consider Figure 2 and the spatial network attribute Location. The Location attribute has three hierarchy
levels,i.e., S izeH(Location)=3, that are Node, Site, and ALL. Referring to Figure 2, Desc(LocationNode,site 1) = {node 10024, node 10025, node 10029}. In our running example, we consider three attributes,i.e., Location, Day,
and T oD (short for Time of Day). We now define hierarchies for the remaining attributes Day and T oD. The Day hierarchy has three levels,i.e., Day, Day type, and ALL, where Day level is the day of the week, Day type splits days
into weekdays or weekend days, and ALL aggregates all days. The T oD hierarchy has three levels Hour, Hour type, and ALL,i.e., Hour is the hour of the day, Hour type aggregates similar time hours, e.g., night, day, etc. hours, and
0 10029 10025 10024, Monday, 1 10025, Monday, 1 10029, Monday, 1 10025, Tuesday, 1 10029, Tuesday, 1 10024, Tuesday, 1 17134 17135 17139 Location node_10024 node_10029 node_10025 node_17134 node_17135 node_17139
LocationNode LocationSite LocationALL Location 20120507 01 20120507 01 20120507 01 20120507 02 20120507 02 20120507 02 20120515 01 20120515 01 20120515 01 10024, Monday, 2 10025, Monday, 2 10029, Monday, 2 384 13 2.1 922 42.3 32.1 All Locations site_1 site_120 ALL Node Hierarchy levels Site
T Location, Day, ToD Value
4.5 101
10024
Fig. 2. Hierarchy construction
Discretization. Data measurements come in different formats and depend on the inspected system, e.g., values might be represented as real numbers or text. Prediction of the precise absolute values is not always required and sometimes optimization instead relies on the predicted discrete class. The simple discretization technique presented in3was based on a defined threshold, thus only two classes Low and High could be used. In the current paper, we use
a more general discretization function Disc(v) = Class, where v is the value to be discretized and Class is the discrete class. The Disc function is not limited by the number of different classes.
Example 2. Let us consider MBN traffic data where v denotes the traffic in MB carried over a single hour at a
selected node, stored as real numbers. Our task requires predicting only a few possible network node states, e.g.,
Low, Median, and High, and does not require accurate prediction of traffic values. Predicted Low traffic nodes can potentially be turned off without a major loss in the Quality of Service(QoS) in the MBN.
We want to discretize traffic equal to v=74 MB carried at node node10024 during the first Saturday hour, see
Figure 1a. To discretize traffic values, we use a classification table defined as traffic ranges and names of the traffic classes (traffic load),e.g., {0, 30, Low}, {30, 500, Median}, and {500, ∞, High}. Using the discretization function we
classify v as Disc(v) = Disc(74) = Median.
4. Lattice-based contexts
Similarly to data cubes, combinations of levels of granularity form a lattice, e.g., see Figure 3. We now formally define this lattice and the concept of a context.
Lattice Construction. The following partial order allows us to consider a lattice representation. Let a lattice element, e, be defined as a combination of k hierarchy levels, i.e., e = (Hj1
1, . . . ,H
jk
k ), where H ji
i is a level in the hierarchy Hi. We define the partial order between two lattice e = (Hj1
1 , . . . ,H jk k ) and e ′= (Hj ′ 1 1, . . . ,H j′ k k ) as: e ) e′ ⇐⇒ ∀i =1 . . . k : Hji i )H j′ i i .
Example 3. Let us consider the two lattice elements, e = (Node, Day, Hour) and e′=(Node, Day, Hour type). Both
are at the lowest levels of the Location and the Day hierarchies. Since Hour ) Hour type, we have that e ) e′. The
complete lattice for the Location, Day, and T oD hierarchies is provided in Figure 3. Lattice elements are uniquely identified by ID numbers for easier later referencing.
Context definition. Lattice elements represent the hierarchy levels at which attributes are processed. Each hierarchy level contains multiple attribute values. A context is defined as an instance of different attribute values from the hierarchy levels of a given lattice element. Considering a lattice element, e = (Hj1
1 , . . . ,H
jk
k), a combination of attribute values forms a context of e, denoted by context = (a1, . . . ,ak), such that ∀i = 1 . . . k, ai ∈ Dom(Hiji).
Tuple selection that matches a specific context = (a1, . . . ,ak) is done by Datacontext = {(t, a1,a2, . . . ,ak,v) | a1 ∈
Desc(H1
Node, Day, Hour
Site, Day, Hour Node, Day_type, Hour Node, Day, Hour_type
ALL, Day, Hour Site, Day_type, Hour Site, Day, Hour_type Node, ALL, Hour Node, Day_type, Hour_type Node, Day, ALL ALL, Day_type, Hour ALL, Day, Hour_type Site, ALL, Hour Site, Day_type, Hour_type Site, Day, ALL Node, ALL, Hour_type Node, Day_type, ALL
ALL, ALL, Hour ALL, Day_type, Hour_type ALL, Day, ALL Site, ALL, Hour_type Site, Day_type, ALL Node, ALL,ALL ALL, ALL, Hour_type ALL, Day_type, ALL Site, ALL, ALL
ALL, ALL, ALL
1 2 3 4 5 6 7 8 9 10 18 19 20 21 22 23 11 12 13 14 15 16 17 24 25 26 27
Fig. 3. Lattice for the hierarchies Location, Day, and T oD
Example 4. We illustrate how a context is constructed for the lattice element e = (S ite, Day, Hour), the highlighted
lattice element in Figure 3. The attribute values site1, Monday, and 1 are selected from their respective hierarchies
S ite, Day, and Hour. For the selected attribute values we construct a context instance context =(site 1, Monday, 1).
The tuples that form the context satisfy Datacontext = {t | loc ∈ Desc(HLocationNode ,site 1) ∧ day ∈ Desc(H Day
Day,Monday) ∧
tod ∈ Desc(HT oDHour,1)} and are shaded. For clarity, the attribute values that do not match the context are white-boxed
in Figure 4.
5. Lattice-based spatio-temporal prediction
20120507 01 20120507 02 20120507 02 20120507 02 384 13 2.1 922 42.3 32.1 20120515 01 20120515 01 20120515 01 10024, Monday, 1 10025, Monday, 1 10029, Monday, 1 10025, Tuesday, 1 10029, Tuesday, 1 10024, Tuesday, 1 10024, Monday, 2 10025, Monday, 2 10029, Monday, 2
T Location, Day, ToD Value
0 101 20120507 01
4.5 20120507 01
Fig. 4. Tuples matching context contextsite1,Monday,1
The STEP approach proposed in3 is based on model
training and predictions of a single fixed and predefined context, i.e., context[node, hour]. In this paper we pro-pose LBSTEP which is a more general prediction approach based on contexts defined for the lattice elements. We split
Dataat time t′ into training data Data
T where t < t′and
evaluationdata DataEwhere t ≥ t′. Before introducing the approach itself, we first start by presenting the evaluation metrics that will allow assessing the quality of the predic-tion.
Prediction evaluation metrics For model evaluation
we use the standard qualitative metrics5, i.e., accuracy, recall, precision, and F-measure, which are calculated
sepa-rately for each discrete class. The standard metrics do not show the real model performance for the purpose of MBN optimization, i.e., a high accuracy score does not guarantee high utility. Therefore, to estimate the possible energy sav-ings in the MBN we define a utility score using #T ruePositive and #FalsePositive. #T ruePositive shows the correct predictions when the specific network part (node, site) potentially can be turned off and #FalsePositive represents the wrong predictions, i.e., the network part that will be turned off although it really should not have been. This will lead to an instant ”re-turning-on” of the mistakenly turned off network part, which causes an additional (penalty) energy consumption for turning back on. To evaluate the possible energy savings score of the selected class Class, we use
UtilityClass=#T ruePositive − wrongPenalty ∗ #FalsePositive, where wrongPenalty is the penalty score for incorrect prediction. These evaluation metrics are calculated, aggregated, and provided for every lattice element.
Example 5. Consider that the MBN traffic load levels predicted at a specific node is vp = {Low, Low, Low, Low, Low}.
The actual traffic monitored for 5 consecutive periods is ve = {10, 10, 100, 10, 10} for the same node. If MBN
opti-mization is performed using vpthe node will be turned off for the whole period, while it should not have been turned
off for period 3. Such an incorrectly predicted traffic load will require the turned off node to be turned on again. MBN equipment turning on and off is inefficient and requires additional energy consumption. Therefore, to estimate the real utility, we use wrongPenalty =2 for the wrong predictions, i.e., UtilityLow=4 − 2 ∗ 1 = 2, and the network could be
optimized for 2 time units only. As shown, high prediction accuracy score does not guarantee high utility value.
LBSTEP approach For data with schema [T, A1, . . . ,Ak,V], we want to build a model M that can predict future values of v. From a probabilistic point of view, M should be a good approximation of the probability distribution
p ∗(V|A1, . . . ,Ak,DataT). We assume that (1) p ∗ (V|A1, . . . ,Ak,DataT) is a good approximation of the true probability distribution p(V|A1, . . . ,Ak) and (2) p(V|A1, . . . ,Ak) is stationary, i.e., it does not evolve over time. As stated in6, ensemble methods have shown to be more efficient, accurate, and diverse than single method approaches. For these reasons, model M(A1, . . . ,Ak,DataT) is composed of n separate models, M1, . . . ,Mn, which are then combined using
a function M(A1, . . . ,Ak,DataT) = Agg(M1, . . . ,Mn) to provide a single ensemble prediction. We now describe how models are built using the lattice, lattice elements and the contexts defined in Section 4. Models are trained for each context. Using cross validation3, accuracy is calculated for every discrete class, model M
i, and contextual data
DataTcontext, i.e.,
AccClass(Mi,DataTcontext) =
X di∈DataTcontext
|Mi(DataTcontext\di) = Disc(di)| ∗ |Class = Disc(di)|
X di∈DataTcontext
|Class = Disc(di)| ,
where |Mi(DataTcontext\di)| is the class predicted by model Mion DataTcontext\di, and |Mi(DataTcontext\di) = Disc(di)| is
equal to 1 if prediction is correct, 0 otherwise. Correct prediction of the specific Class, |Class = Disc(di)| is equal to 1 if correct, 0 otherwise.
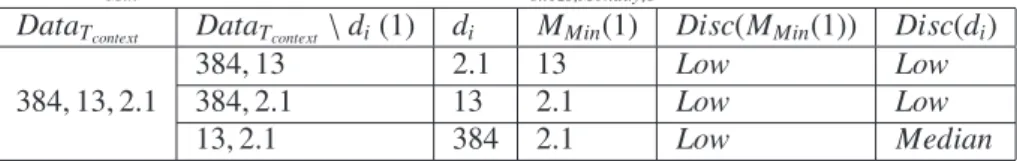
Example 6. We describe cross-validation, accuracy calculation, and traffic classification for the context
contextsite1,Monday,1, see Figure 4, and the single model MMin. Three traffic classes, Low (below30 MB), Median
(between 30 and 500 MB), and High (above 500 MB), are used. Model MMin returns the smallest traffic value of the provided data, i.e., MMin(384, 13, 2.1) = 2.1. In Table 1 we provide the accuracy calculation steps, where the
first column is contextual data, and the second and third columns represent cross-validation. The value predicted by model MMin(column four) is discretized(column five) and compared with the discretized actual value(column six).
Model MMin predicted class Low with AccLow =2/2, and the Median class was predicted once while in fact it was
Low, therefore AccMedian=0/1. Total accuracy for the model is T otalAccMMin =2/3, i.e., two classes out of three where
correct. The trained model MMinfor the selected context will predict PredictionMMin = Low class. We assume that
Table 1. MMinmodel construction for context contextsite1,Monday,1
DataTcontext DataTcontext\di(1) di MMin(1) Disc(MMin(1)) Disc(di)
384, 13, 2.1
384, 13 2.1 13 Low Low
384, 2.1 13 2.1 Low Low
13, 2.1 384 2.1 Low Median
the individual models are the following: MMingives the minimum, MMaxgives the maximum, MAvggives the average,
and MMedgives the set median. Model accuracies and weights, along with model predictions are provided in Table 2
for a larger training data set. Accuracies are provided for every class of the model. Model aggregation is extended by using weighted models wMi. T otalAccMi shows the total accuracy for the model Mi,e.g., the model MMinwas the most
accurate among the 4 models. PredictionMiis the class predicted by the model Mi,e.g., model MMinwill predict class
Low.
We now describe how individual predictions are combined. To do so, let us assume that the accuracies are known for the models M1, . . . ,Mntrained on DataT context. Aggregation of several models into a single ensemble model M is not
Table 2. Accuracy table trained for models MMin, MMax, MAvg, MMed
Models
MMin MMax MAvg MMed
Class
Low AccLow=4/6 AccLow=1/3 AccLow=1/3 AccLow=1/4
Median AccMedian=2/3 AccMedian=2/4 AccMedian=5/6 AccMedian=4/6
High AccHigh=2/3 AccHigh=4/5 AccHigh=0/3 AccHigh=1/2
Weight wMin=0.5 wMax=0.8 wAvg=0.4 wMed=1
T otalAccMi 8/12 7/12 6/12 6/12
PredictionMi Low High Low Median
a trivial task. First, individual models M1, . . . ,Mnare assigned weights, e.g., weight wM1 =1 for model M1. Second,
aggregation of models M1, . . . ,Mncan be done in several ways.
In this paper, we explore and compare four ensemble aggregation strategies, AggS i, described below. We note that the main focus of the paper is the lattice-based context framework, not the aggregation strategies, and thus even more advanced aggregation strategies are left for future work. If several different candidate classes are selected, the higher predicted Class is the one predicted.
1. As in3, we consider that ensemble prediction will select the model M
i∈M1, . . . ,Mnwith the highest T otalAccMi. 2. We consider only the frequency of PredictionMi, i.e., the most common predicted class is selected as the
predic-tion. This is special case of aggregation strategy 3, where all weights are equal, wMi =1.
3. We consider PredictionMi and weight wi for every model Mi, i.e., we calculate
!
ClasswMi for every predicted
Class. Prediction is the Class with the highest!Class.
4. We consider weights wMi, predicted classes PredictionMi, and total accuracies T otalAccMi for prediction. The
highest!ClasswMi∗T otalAccMi shows which Class is predicted.
Example 7. Using the presented prediction strategies and the accuracies in Table 2, we predict traffic load classes. 1. The highest T otalAccMi is for model MMin, so model M will predict class Low as predicted by model MMin. 2. The models Mi predict 3 different classes. The most common predicted class is Low, therefore we will predict
class Low.
3. For the provided weights,!Low=0.9,!Median=1, and!High=0.8, therefore M will predict class Median. 4. For the provided weights,!Low=6.4,!Median=6, and!High=5.6, therefore M will predict class Low.
Greedy heuristic Estimation of the optimal lattice element requires calculating accuracies of all lattice elements. Complex prediction models coupled with a potentially high number of lattice elements might be inefficient and too time consuming. To increase efficiency of the optimal lattice element selection, we propose a greedy heuristic. We start at the bottom element of the lattice (parent element). Iteratively, we estimate accuracies of the child elements and proceed with the single child with the highest accuracy, if accuracy is higher than the parent, otherwise we stop. Example 8. Consider the lattice structure in Figure 4 and lattice element accuracies, i.e., Acc(ID=1)=0.75,
Acc(ID=2)=0.74, Acc(ID=3)=0.72, Acc(ID=4)=0.77, Acc(ID=7)=0.74, Acc(ID=9)=0.72, Acc(ID=10)=0.73. Acc(ID=1)<Acc(ID=4), therefore we proceed with the child elements of lattice element ID=4. Since child elements provide lower accuracy, we stop at element ID=4.
6. Experimental evaluation
We consider an MBN of 660 nodes and 5 weeks of consecutively monitored traffic. The data did not contain noise, and it was regularly sampled. Missing records, which make up 0.3% of the total dataset, are generated using the average of the neighboring existing values. LBSTEP is evaluated using both qualitative and quantitative measures: the prediction model construction time and the model size. To our knowledge, no other context-based prediction strategy than STEP can serve as competitor to LBSTEP. Additionally, we experiment how the weights and the voting function affect the performance. We consider the same four models, i.e., MMin,MMax,MAvg,MMed, for ensemble prediction as
in3. The models were trained on the first four weeks and then evaluated on the last one. The considered lattice and the underlying dimensions are shown in Figure 3. In the following figures, ID of the lattice element is shown in x axis (see Figure 3), while the y axis represents various statistical measures. Traffic discretization implies that the number of traffic classes is not fixed. Network can be potentially optimized when traffic is low. Experiments were performed on an Intel i7 2.67GHz PC with 4GB RAM running Windows7 64-bit. LBSTEP has been implemented and tested with Java JDK 1.7 using 2GB RAM.
Optimal context Lattice construction depends on the number of attributes, levels in the hierarchies, and the size of the DataT. The discretization function Desc is defined using a threshold of 105 MB (the median traffic value of 5 weeks of traffic), i.e., class Low represents traffic below 105 MB, class High traffic above. For the initial optimal context selection, weights for single models are set to wMin =0.5, wMax =0.5, wAvg=1, and wMed =1. We calculate
(a) Accuracy (b) Utility (c) F-measure
Fig. 5. Optimal context comparison for all lattice elements
qualitative measures, i.e., accuracy, precision, recall, utility, and F-measure for all lattice elements. The three selected measurements (accuracy, utility, and F-measure) are provided for the four ensemble strategies in Figures 5a, 5b, 5c. Only 2 lines are visible since performance of the models is similar and graph lines overlap.
We test the influence of the discretization function by using different threshold values equal to 48 MB (1/3 of the traffic) and 205 MB (2/3 of the traffic). Models are consistent and give the best statistical results for the same lattice element, i.e., the highest scores are detected for the lattice element ID = 3.
Optimal weights We have already identified that the optimal lattice element for the predictions is element ID = 3. We now focus on the weight optimization for the ensemble strategies AggS3and AggS4. The estimated optimal weights
are provided in Table 3. For weight optimization we consider a two class discretization function and thresholds equal to 48MB, 105MB, and 205MB. We check which weight combination gives the best accuracy(short A), utility(short
Table 3. Optimized weights for models MMin, MMax, MAvg, MMed
Threshold=48 Threshold=105 Threshold=205
MMin MMax MAvg MMed MMin MMax MAvg MMed MMin MMax MAvg MMed
AggS3 A 0.1 0.1 0.9 1 0.1 0 1 1 0.1 0 1 1 U1 0.1 0.1 0.9 1 0.1 0 1 1 0.1 0 1 1 U2 0 0.1 1 1 0 0.1 1 1 0 0.1 1 1 F 0.1 0 1 1 0.1 0 1 1 0.1 0 1 1 AggS4 A 0.5 0.1 1 0.9 0.7 0.3 0.9 0.5 0.8 0.2 1 0.5 U1 0.5 0.1 1 0.9 0.7 0.3 0.9 0.5 0.8 0.2 1 0.5 U2 0.1 0.7 0.5 1 0.3 1 0.6 0.9 0.4 1 0.7 0.9 F 0.8 0 0.7 1 1 0 0.8 1 0.8 0.2 1 0.5
U), and F-measure(short F) results, i.e., the single models are assigned weights wiin the range [0,1] with a step size of 0.1. The utility score is calculated with two penalty scores wrongPenalty = 1 (short U1) and wrongPenalty = 2 (short U2). Use of different wrongPenalty scores allows simulating different network designs and technical details of the equipment installed in the MBN.
Different thresholds require different weights to get the best performance. Weights can be optimized according to user preferences aiming for the best accuracy, utility, or F-measure. For the inspected thresholds, ensemble strategy
AggS3 has constant high weights for models MAvg and MMed. Weights for strategy AggS4 vary for every threshold
(a) Time/disk space for models (b) Accuracy comparison (c) Utility comparison Fig. 6. Evaluation metrics
strategy by comparing statistical measures for all lattice elements. Ensemble strategy AggS3shows the highest sum of
accuracy, utility with wrongPenalty = 1, and F-measure. Ensemble strategies AggS1 and AggS4 shows similar results
to strategy AggS3, while ensemble strategy AggS2has lower scores.
Quantitative evaluation We evaluate model construction using two criteria, i.e., time and physical model size stored using Serializable functionality for ensemble strategy AggS3with threshold 30MB. The main factor that affects
the size of the trained models and time required for the model construction for the specific lattice element is S izeE, which defines the number of different contexts. For the lattice element ID=1 in total S izeENode,Day,Hour = 110880 contexts will be trained, while for element ID=4 S izeENode,Day,Hour type = 18480. The model construction time and disk space are provided in Figure 6a. Default information stored in prediction models takes a constant size, therefore the real size of the model can be estimated by subtracting 35.5 MB. Both time and disk space are higher for the lattice elements containing more different contexts.
Greedy heuristic validation We evaluate the greedy heuristic for prediction correctness and efficiency in terms of required time with 10 discretization functions defined using thresholds evenly distributed in the range 30 to 300 MB. The heuristic gives the correct result if the lattice element selected by the heuristic is the lattice element with highest accuracy. The greedy heuristic is 100% correct and provides the highest accuracy lattice element in all 10 cases. Use of the heuristic provides approx. 20% time savings, since accuracies of the most costly lattice elements ID=1. . . 4 are always evaluated, see Figure 6a.
LBSTEP vs ARIMA vs STEP We compare our proposed LBSTEP approach with other prediction strategies, i.e., the state of the art forecasting technique ARIMA and the single context approach STEP. We use the R package for ARIMA times series forecasting. ARIMA is tested with the same setup, i.e., four weeks used for training and one week for evaluation. ARIMA models show lower accuracy since most of the nodes are predicted to have High traffic, see Figure 6b. In addition, only the first ARIMA predictions actually vary and later the predictions become constant. This conservative ARIMA approach does not guarantee any energy savings for lower threshold values, see Figure 6c. We compare our previously proposed STEP, based on a fixed context[node, hour], and our multiple context LBSTEP. The STEP context[node, hour] in the lattice would be represented by the lattice element elementNode,ALL,Hour(ID=8) and ensemble strategy 1. As we have shown, elementNode,ALL,Hour is not the optimal lattice element for prediction results and ensemble strategy 1 is not optimal. Considering the optimal lattice element, i.e., ID=3, and the optimal ensemble strategy 3, we improve accuracy of the STEP approach by 1-2% for various thresholds, which is enough to give valuable energy savings.
7. Related work
Prediction and forecasting has been used for various applications. Traffic trends in mobile networks can be esti-mated using forecasting techniques. In7, Cisco presents a forecasting model, trained on a list of parameters specific for the mobile networks, e.g., density of the mobile users, active user time per hour, traffic generated within active period, other mobile network specific information. Even if this model is suitable for long term traffic predictions,
e.g.,one year period, and gives abstract traffic trend in the network, it is useless when considering MBN optimization based on short term traffic load.
Context-based predictions have been analyzed in the past. Predictions using data cubes where dimensional at-tributes are equipped with hierarchies have been addressed in8. Multiple context-based predictions and use cases are
presented in9. Context-based predictions are presented in10, where the authors present prediction using the context as well as future context prediction. In11, the authors consider factors that affects the accuracy of context use for pre-dictions. Relations between similar users allows assuming that the users might share the same context12. In STEP3,
models are built for the fixed context[node, hour] and afterward used for predictions. In the current paper, we extend model construction using multiple contexts defined by the lattice. Additionally, we propose a solution that can deal with more complex hierarchy types and multiple contexts.
Spatio-temporal predictions can be based on monitoring users and collecting spatial information, e.g., when and where users move. Expansion and the use of mobile devices made user tracking simple. In13, contextual information
is used as the solution supporting computations. The possibility to predict user movement using historical data as well as to perform network optimization has been presented in the papers14,15. Constant position tracking of every mobile user is costly, both in data size and position estimation. Therefore, the current paper instead considers MBN optimization using the aggregated traffic information at every network element.
8. Conclusion and future work
This paper investigated spatio-temporal time series prediction considering contextual data. We presented LBSTEP which significantly extends our previously approach STEP by (1) the use of multidimensional prediction models, (2) the use of several ensemble strategies, and (3) a domain specific evaluation metric, i.e., MBN possible energy savings. Multiple contexts levels are presented as lattice elements. The experimental results show that LBSTEP’s multidimensional prediction models improve all qualitative metrics for hierarchical data.
LBSTEP can be extended in several directions. First, more complex multidimensional models can be used for a single ensemble prediction model. Second, hierarchies can be automatically built for achieving better prediction results. Third, LBSTEP can be extended to handle concept drift.
References
1. Ramanathan, R., Engle, R., Granger, C.W.J., Vahid-Araghi, F., Brace, C.. Essays in econometrics. chap. Short-run forecasts of electricity loads and peaks. New York: Cambridge University Press; 2001, p. 497–516.
2. Palla, K., Knowles, D., Ghahramani, Z.. An infinite latent attribute model for network data. In: Langford, J., Pineau, J., editors. Proceedings of the 29th International Conference on Machine Learning. New York: Omnipress; 2012, p. 1607–1614.
3. Samuleviˇcius, S., Pitarch, Y., Pedersen, T.B., Sørensen, T.B.. Spatio-temporal ensemble prediction on mobile broadband network data. In: Vehicular Technology Conference (VTC Spring). 2013, p. 1–5.
4. Samuleviˇcius, S., Pedersen, T.B., Sørensen, T.B., Micallef, G.. Energy savings in mobile broadband network based on load predictions: Opportunities and potentials. In: Vehicular Technology Conference (VTC Spring). 2012, p. 1 –5.
5. Blair, D.C.. Information retrieval, 2nd ed. c.j. van rijsbergen. london: Butterworths; 1979: 208 pp. Journal of the American Society for Information Science1979;30(6):374–375.
6. Dietterich, T.G.. Ensemble methods in machine learning. In: Proceedings of the First International Workshop on Multiple Classifier Systems. London, UK: Springer-Verlag; 2000, p. 1–15.
7. Cisco, . Cisco visual networking index: Forecast and methodology, 2011-2016. 2012. URL:
http://www.cisco.com/en/US/solutions/collateral/ns341/ns525/ns537/ns705/ns827/white paper c11-481360.pdf. 8. Ramakrishnan, R., Chen, B.C.. Exploratory mining in cube space. Data Min Knowl Discov 2007;15(1):29–54.
9. Mayrhofer, R.. Context prediction based on context histories: Expected benefits, issues and current state-of-the-art. In: Prante, T., Meyers, B., Fitzpatrick, G., Harvel, L.D., editors. Proceedings of the 1st International Workshop on Exploiting Context Histories in Smart Environments. 2005, .
10. Anagnostopoulos, C., Mpougiouris, P., Hadjiefthymiades, S.. Prediction intelligence in context-aware applications. In: Mobile Data Management. 2005, p. 137–141.
11. Sigg, S., Gordon, D., von Zengen, G., Beigl, M., Haseloff, S., David, K.. Investigation of context prediction accuracy for different context abstraction levels. IEEE Transactions on Mobile Computing 2012;11(6):1047–1059.
12. Chen, A.. Context-aware collaborative filtering system: Predicting the user’s preference in the ubiquitous computing environment. In: Location- and Context-Awareness. 2005, p. 244–253.
13. Schilit, B., Adams, N., Want, R.. Context-aware computing applications. In: Mobile Computing Systems and Applications. 1994, p. 85–90. 14. Akyildiz, I.F., Wang, W.. The predictive user mobility profile framework for wireless multimedia networks. IEEE/ACM Trans Netw 2004;
12(6):1021–1035.
15. Samaan, N., Karmouch, A.. A mobility prediction architecture based on contextual knowledge and spatial conceptual maps. IEEE Trans Mob Comput2005;4(6):537–551.