HAL Id: tel-00940440
https://tel.archives-ouvertes.fr/tel-00940440v3
Submitted on 25 Feb 2014HAL is a multi-disciplinary open access
archive for the deposit and dissemination of sci-entific research documents, whether they are pub-lished or not. The documents may come from teaching and research institutions in France or abroad, or from public or private research centers.
L’archive ouverte pluridisciplinaire HAL, est destinée au dépôt et à la diffusion de documents scientifiques de niveau recherche, publiés ou non, émanant des établissements d’enseignement et de recherche français ou étrangers, des laboratoires publics ou privés.
Spatio-temporal characterization of the surface
electrocardiogram for catheter ablation outcome
prediction in persistent atrial fibrillation
Marianna Meo
To cite this version:
Marianna Meo. Spatio-temporal characterization of the surface electrocardiogram for catheter ablation outcome prediction in persistent atrial fibrillation. Other. Université Nice Sophia Antipolis, 2013. English. �NNT : 2013NICE4122�. �tel-00940440v3�
UNIVERSITÉ NICE SOPHIA ANTIPOLIS ÉCOLE DOCTORALE STIC
SCIENCES ET TECHNOLOGIES DE L’INFORMATION ET DE LA COMMUNICATION
THÈSE
pour l’obtention du grade de:
Docteur en Sciences
Mention: Automatique Traitement du Signal et des Images de l’Université Nice Sophia Antipolis
Présentée par
Marianna MEO
Caractérisation spatio-temporelle de
l’électrocardiogramme de surface pour
prédire le résultat de l’ablation par cathéter
de la fibrillation atriale persistante
thèse dirigée parVicente Zarzoso, Professeur, Université Nice Sophia Antipolis Olivier Meste, Professeur, Université Nice Sophia Antipolis
Soutenue publiquement le 12 décembre 2013 devant le jury composé de :
Président : Gérard Favier, Directeur de Recherche, CNRS
Rapporteurs : Sergio Cerutti, Professeur, Politecnico di Milano, Italie Leïf Sörnmo, Professeur, Lund University, Suéde
Examinateurs : Pietro Bonizzi, Maître de Conférences, Université de Maastricht, Pays Bas Rémi Dubois, Maître de Conférences, ESPCI - ParisTech
Nadir Saoudi, Professeur, Centre Hospitalier Princesse Grace, Monaco Olivier Meste, Professeur, Université Nice Sophia Antipolis
Marianna MEO
CARACTÉRISATION SPATIO-TEMPORELLE DE
L’ÉLECTROCARDIOGRAMME DE SURFACE POUR
PRÉDIRE LE RÉSULTAT DE L’ABLATION PAR
CATHÉTER DE LA FIBRILLATION ATRIALE
PERSISTANTE
UNIVERSITY OF NICE SOPHIA ANTIPOLIS
Doctoral School of Information and Communications Technology
THESIS
in fulfillment of the requirements for the degree of
Doctor in Sciences
Specialty: Systems, Signal and Image Processing at University of Nice Sophia Antipolis
Presented by
Marianna MEO
Spatio-temporal characterization of the
surface electrocardiogram for catheter
ablation outcome prediction in persistent
atrial fibrillation
Thesis supervised byVicente Zarzoso, Professor, University of Nice Sophia Antipolis Olivier Meste, Professor, University of Nice Sophia Antipolis
Presented on the 12th December 2013 to the jury committee composed by :
President : Gérard Favier, Research director, CNRS
Reviewers : Sergio Cerutti, Professor, Politecnico di Milano, Italy Leïf Sörnmo, Professor, Lund University, Sweden
Jury committee: Pietro Bonizzi, Assistant Professor, Maastricht University, The Netherlands Rémi Dubois, Associate Professor, ESPCI - ParisTech
Nadir Saoudi, Professor, Princesse Grâce Hospital, Monaco Olivier Meste, Professor, University of Nice Sophia Antipolis Vicente Zarzoso, Professor, University of Nice Sophia Antipolis
Marianna MEO
SPATIO-TEMPORAL CHARACTERIZATION OF THE
SURFACE ELECTROCARDIOGRAM FOR CATHETER
ABLATION OUTCOME PREDICTION IN PERSISTENT
ATRIAL FIBRILLATION
Abstract
Atrial fibrillation (AF) is the most common sustained cardiac arrhythmia encountered in clinical practice, and one of the main causes of ictus and strokes. Despite the advances in the comprehension of its mechanisms, its thorough characterization and the quantifi-cation of its effects on the human heart are still an open issue. In particular, the choice of the most appropriate therapy is frequently a hard task. Radiofrequency catheter ablation (CA) is becoming one of the most popular solutions for the treatment of the disease. Yet, very little is known about its impact on heart substrate during AF, thus leading to an inaccurate selection of positive responders to therapy and a low success rate; hence, the need for advanced signal processing tools able to quantify AF impact on heart substrate and assess the effectiveness of the CA therapy in an objective and quantitative manner. This approach would help understand which patients could effectively benefit from abla-tion, thus avoiding unnecessary and expensive procedures, and helping in the selection of a patient-tailored therapy.
Valuable information about AF can be provided by multilead electrocardiogram (ECG) recordings of heart electrical activity in a noninvasive and cost-effective manner. However, most of standard ECG processing techniques are affected by several shortcomings. First, some CA outcome predictors are manually determined on surface ECG, thus affected by low repetitiveness. In addition, several parameters are merely computed in one ECG lead, therefore neglecting potential information about AF and its spatial distribution coming from the other leads.
This doctoral thesis aims at exploiting the multi-lead character of the standard ECG to enhance CA outcome prediction accuracy and the ability of the extracted features to characterize CA. Application of multivariate signal decomposition techniques, such as principal component analysis (PCA), weighted PCA (WPCA) and nonnegative matrix factorization (NMF), allow enhancing the most discriminant components of ECG content. Features determined in this multivariate framework will act as classifiers for distinguishing between successful and failing CA procedures prior to their performance.
Spatial variability of the standard ECG can be exploited to highlight some properties of the ECG signal typically observed during AF. In particular, the role of fibrillatory wave (f-wave) amplitude as a predictor of AF termination by CA is effectively enhanced in a multilead framework based on the PCA of the observed data matrix. Higher amplitude values prove to be correlated with CA success, and drawbacks of traditional methods, such as manual computation and single-lead analysis, are overcome. Variations in this parameter measured between the beginning and the end of the procedure are also able to quantify CA effects on AF dynamics, related to ablation outcome.
Similarly, some multivariate signal decomposition techniques are employed to assess the predictive power of AF spatio-temporal variability (STV) on the 12-lead ECG. Pre-vious studies have demonstrated the correlation between single-lead STV measures and AF organization. The present study exploits the multivariate character of standard ECG enhanced by WPCA and underlines the ability of multilead STV descriptors to predict long-term CA outcome in persistent AF: the more irregular and dispersive the AF pattern, the less likely AF termination by CA. To the same extent, the NMF method proves to be an effective tool for processing STV variability content of the ECG.
The aforementioned ECG properties can be also exploited for a combined analysis of AF content by means of the logistic regression (LR) technique. This model condenses in a
unique index the most relevant contributions provided by surface recordings by selectively enhancing the most content-bearing ECG leads, while reducing the influence of the other electrodes. LR measures can effectively assess AF termination by CA at several follow-up periods.
Further contributions to AF analysis are provided by information theory, which actu-ally helps exploring surface ECG spatial variability by assessing the degree of similarity between AF patterns observed on different leads. These regularity measures also prove to quantify CA effectiveness, and a link between the degree of interlead correlation and the procedural success is demonstrated.
Another line of investigation focuses on the analysis of the ventricular response, as changes in atrioventricular (AV) node function and its refractoriness during AF are re-flected on the irregularity of the RR interval (RRI) distribution. Heartbeat occurrences are modeled as a point process, and effects of sino-atrial (SA) node response to sym-pathetic and parasymsym-pathetic inputs from the autonomous nervous system are taken into account in this probabilistic framework. Such a method allows for the extraction of heart rate variability (HRV) indexes which effectively highlight asymmetry and dispersion characteristics of the RRI distribution in presence of AF.
Résumé
La fibrillation auriculaire (FA) est la trouble cardiaque la plus courante, ainsi que une des causes principales des accidents vasculaires cérébraux. Malgré le progrès dans la compréhension de cette pathologie, les mécanismes à la base de la FA ses effets sur le coeur humain ne sont pas encore très clairs. D’où il vient le problème du choix de la stratégie de traitement la plus appropriée. La thérapie d’ablation par cathéter (CA) est de plus en plus utilisée pour traiter la FA, mais ses effets sur le substrat cardiaque ne sont pas suffisamment compris, d’où un taux de réussite très variable et le besoin d’outils du traitement des signaux capables de quantifier cette action. Cette approche perméttrait de traiter par CA seulement les sujets qui peuvent béneficier de cette thérapie.
L’électrocardiogramme (ECG) à 12 voies représente un outil non invasif peu coûteux pour caractériser la FA à partir de l’activité électrique du coeur. Cependant, les pré-dicteurs classiques de l’issue de la CA présentent plusieurs inconvénients, notamment leur calcul manuel sur une seule voie de l’ECG, qu’amène à négliger l’information sur la FA présente sur les autres dérivations.
Cette thèse exploite explicitement le caractère multi-capteur de l’ECG au moyen de techniques de décomposition multivariées, par exemple, l’analyse en composantes prin-cipales (PCA), la PCA pondérée (WPCA), la factorisation en matrices non négatives (NMF), démontrant qu’elles peuvent améliorer la puissance prédictive de certaines pro-priétés de l’ECG dans le cadre de la CA.
La variabilité spatiale de l’ECG standard peut être exploitée pour souligner certaines proprietés du signal ECG qui sont typiquement observées en présence de la FA. En parti-culier, l’amplitude des ondes fibrillatoires est corrélée avec le résultat de la CA, et traitée par une méthode multi-capteur basée sur la PCA. Valeurs plus élévées de ce paramètre prédisent la réussite de l’ablation, et les inconvenients des méthodes classiques (en par-ticulier, le calcule manuel sur une seule dérivation) sont eliminés. Les variations de ce déscripteur mésurée entre le début et la fin de l’ablation sont également capables de quantifier les effets de la CA sur la dynamique de la FA, en rélation avec le résultat de l’ablation.
D’autres techniques comme la WPCA et la NMF peuvent aussi quantifier la variabilité spatio-temporelle (STV) de la FA sur l’ECG. Des études précedents ont démontré une corrélation entre des mésures de la STV sur une seule voie et la complexité de la FA. Cette thèse souligne la valeur prédictive de cette mésure obténue dans un cadre multicapteur au moyen de la WPCA. Formes d’onde plus varaibles et irrégulieres sont associées à l’échec de la CA. Résultats similaires sont obténus en utilisant la NMF. Ces propriétés de l’ECG peuvent aussi être combinées par la régression logistique (LR), qui mets en valeur les contributions les plus significatives pour la caractérisation du résultat de l’ablation.
La théorie de l’information permet également d’estimer le niveau de corrélation entre les voies de l’ECG, mis en relation avec le résultat de la CA grâce à des approches multi-capteurs.
Enfin, une dernière ligne de recherche concerne la réponse ventriculaire manifestée sur la variabilité cardiaque. L’approche paramétrique de processus ponctuel est capable de quantifier les effets de la réponse vagale sur le noeud sino-atriale, et souligner certaines propriétés de cette variabilité, améliorant ainsi la caractérisation de la FA.
Contents
Acronyms 3
1 Introduction 5
1.1 Background and motivation . . . 5
1.2 Objectives . . . 6
1.3 Thesis overview and summary of contributions . . . 6
1.4 Publications issued from this work . . . 9
I
Background
11
2 Electrophysiology of the heart and electrocardiography 13 2.1 Introduction . . . 132.2 Anatomy of the heart . . . 13
2.3 The electrical conduction system . . . 16
2.4 The standard 12-lead ECG . . . 17
2.5 Summary and conclusions . . . 27
3 Atrial fibrillation 29 3.1 Introduction . . . 29
3.2 Definition of atrial arrhythmias . . . 29
3.3 Atrial fibrillation . . . 30
3.4 Overview of the main AF therapies . . . 35
3.5 Ablation therapy for AF treatment . . . 38
3.6 Predicting CA outcome from ECG analysis . . . 45
3.7 Summary and conclusions . . . 46
II
Contributions
47
4 F-wave amplitude multivariate assessment 49 4.1 Introduction . . . 494.2 Clinical assessment of f-wave amplitude . . . 50
4.3 Multilead characterization of f-wave amplitude by means of principal com-ponent analysis . . . 52
4.4 Prediction of acute AF termination by CA . . . 58
4.5 Measures of central tendency for long-term CA outcome prediction . . . . 64
4.6 Assessment of therapy effects on AF dynamics during CA . . . 66
Contents ii
5 AF STV multivariate assessment for CA outcome prediction 75
5.1 Introduction . . . 75
5.2 Motivation and links with AF organization . . . 76
5.3 Multilead STV predictors in the PCA framework . . . 78
5.4 Moving to the weighting perspective in the WPCA framework: weighted principal component analysis for STV quantification . . . 84
5.5 Multilead STV measures on standard ECG in the nonnegative matrix fac-torization framework . . . 94
5.6 STV predictors of CA outcome: extension to long-term CA outcome pre-diction and classification test on a larger ECG database . . . 99
5.7 Summary and conclusions . . . 100
6 Combination of multiple features assessed on standard ECG 103 6.1 Introduction . . . 103
6.2 Definition of the logistic regression model . . . 103
6.3 LR modeling of multivariate f-wave amplitude . . . 104
6.4 LR modeling of AF STV multilead measures . . . 108
6.5 LR modeling of combined measures of f-wave amplitude and STV content . 109 6.6 Summary and conclusions . . . 114
7 Contributions from information theory to CA outcome prediction 117 7.1 Introduction . . . 117
7.2 Basic theoretic definitions . . . 118
7.3 Single-lead assessment of AF regularity on surface ECG for CA analysis . . 120
7.4 Multilead assessment of AF regularity on surface ECG for CA analysis . . 123
7.5 Summary and conclusions . . . 131
8 Point process characterization of ventricular response during AF 133 8.1 Introduction . . . 133
8.2 Point process modeling of RRI distribution . . . 134
8.3 Point process analysis of heart rate and heart rate variability in CA out-come prediction . . . 139
8.4 Point process application to AF pattern recognition . . . 145
8.5 Summary and conclusions . . . 155
III
Summary and conclusions
157
9 Conclusions and future work 159 9.1 Summary and conclusions . . . 1599.2 Future work . . . 162
Bibliography 165 Appendixes179 A.1 Derivation of the least squares estimates . . . 181
A.2 WPCA algorithm . . . 181
A.3 NMF: ALS algorithm . . . 182
iii Contents A.5 IT entropy extension to multiple variables . . . 183
List of Figures
1.1 Thesis structure graphical representation. . . 7
2.1 Anatomy of the heart . . . 14
2.2 Section of the heart wall layers. . . 15
2.3 Pulmonary and the systemic circuits. . . 15
2.4 Sequence of the instantaneous heart wavefront vectors at each step of the cardiac cycle [96]. . . 19
2.5 ECG signal, its fiducial points and the corresponding phases in the cardiac cycle [68]. . . 20
2.6 The heart conduction system with its main components, their typical po-tential waveforms and the corresponding points on surface ECG [96]. . . . 20
2.7 Frontal ECG leads. . . 22
2.8 Precordial ECG leads [96]. . . 23
2.9 The projections of the lead vectors of the standard ECG system in 3 or-thogonal planes. . . 23
2.10 Examples of IEGM. . . 24
2.11 Example of electroanatomic voltage map. . . 25
2.12 BSPM system. . . 26
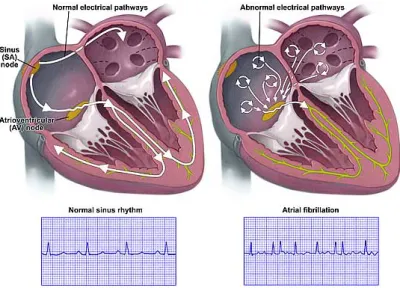
3.1 Differences in ECG pattern between AF and SR. . . 31
3.2 Models of AF mechanisms. . . 32
3.3 Wells’ criterion for AF classification. . . 35
3.4 CEE procedure for conversion of AF to normal SR [148]. . . 37
3.5 Maze lesion. . . 38
3.6 ECG database diagram. . . 42
4.1 Example of ECG recording during AF. . . 49
4.2 Single-lead atrial waveform interpolation algorithm. . . 53
4.3 The multilead AA signal YAA (continuous line) and its rank-1 estimation by PCA (dashed line). Top: lead II. Middle: lead V1. Bottom: lead V3. . 57
4.4 DfL prediction performance as a function of the size L. . . . 60
4.5 AUC of Df8 as a function of R. . . . 62
4.6 Example of a scatter plot of random data, the regression line y = Sx + I and discrepancies di between estimated and real data . . . 67
4.7 Scatter plot of (DL)END as a function of (DL)START. . . 69
4.8 regression analysis of (Df8)START,PCHIP as a function of (Df8)END,PCHIP. . . . 72
5.1 Repartition of the multilead AA signal in segments for STV content ex-traction. . . 78
5.2 Diagram of the main steps of the algorithm for AF STV multivariate as-sessment. . . 80
List of Figures vi 5.3 Evolution of the inverse-variance weighted mean µePCA8 as a function of
NMSE tuning parameters. . . 81 5.4 Single-lead NMSE spatial distribution and AUC assessment. . . 82 5.5 AUC values describing µePCA8 prediction performance as a function of the
rank n of the WPCA decomposition. . . . 83 5.6 Evolution of µeWPCA8 as a function of the number of segments S. . . . 86
5.7 Evolution of µeWPCA8 as a function of the number of samples per segment
NS. . . 87 5.8 AUC values related to the multilead AF STV descriptor as a function of
the number of leads L: PCA vs WPCA. . . . 89 5.9 Effects of the multilead weighting scheme on AA reconstruction. σAA2 :
variance of the input AA signal per lead; σ2
PCA: variance per lead of the rank-1 AA signal approximation by PCA; σ2
WPCA: variance per lead of the rank-1 AA signal approximation by WPCA. . . 90 5.10 Assessment of CA outcome prediction performance of single-lead energy
descriptors. σ2
AA: energy per lead of the original AA signal; σPCA2 : energy per lead of the rank-1 AA signal approximation by PCA; σ2
WPCA: energy per lead of the rank-1 AA signal approximation by WPCA. . . 91 5.11 AUC values describingµeWPCA8 prediction performance as a function of the
rank n of the WPCA decomposition. . . . 92 5.12 AUC dependence on the NMF approximation rank R in CA outcome
pre-diction. . . 98 6.1 Amplitude LR score: AUC evolution as a function of L in long-term
pre-diction of CA outcome. . . 105 6.2 Spatial distribution of the AUC index in the LR framework. . . 112 6.3 LR regression coefficients of ECG multivariate features, both in separate
and combined analysis. . . 113 7.1 Graphical representation of the relationships between the IT parameters
defined in Sec. 7.2. . . 119 7.2 Box-and-whisker plot of the single-lead entropy H(X) in the long-term CA
outcome prediction. . . 121 7.3 AUC index related to H(X) long-term CA outcome prediction quality on
each ECG lead. . . 122 7.4 Spatial distribution of the negentropy index determined on each ECG lead
of the AA signal before and after variance normalization. . . 122 8.1 Some representative examples of HDIG PDF. . . 136 8.2 RRI histogram: Left: AF, subject 7; Right: SR, subject 8. . . 137 8.3 RRI time series as a function of R wave time instants: Left. AF, subject
7; Right. SR, subject 8. . . 138 8.4 Representative examples of KS plots for testing HDIG model
goodness-of-fit. Top: an example of accurate fit (patient 2). Bottom: an example of poor fit (patient 22). . . 141
vii List of Figures 8.5 Representative examples of autocorrelation function of the rescaled RRIs
and their related bounds of confidence. Top: good agreement with uncor-relation hypothesis (patient 5). Bottom: an example of low consistency with uncorrelation hypothesis (patient 31). . . 142 8.6 Box-and-whiskers plots of HR and RRI variability indices in AF pattern
recognition. . . 150 8.7 Autocorrelation function of the rescaled RRIs computed in AF patient 8
for 2 distinct regression order values q. Left: q = 2. Right: q = 5. . . 152 8.8 Two examples of KS plots for HRV characterization in AF patients and
healthy subjects. Left: High modeling accuracy (AF, subject 39). Right: Low modeling accuracy (SR, subject 62). . . 154
List of Tables
4.1 Interclass statistical analysis for AF procedural acute termination assessment. 58 4.2 CA outcome prediction performance for AF procedural acute termination
assessment. . . 59 4.3 ECG lead subsets with optimal prediction performance based on parameter
f
DL . . . 61 4.4 Interclass statistical analysis: extension of amplitude measures to the
long-term follow-up. . . 65 4.5 CA outcome prediction performance: extension of amplitude measures to
the long-term assessment of AF termination by CA. . . 65 4.6 Regression analysis of the parameters DL, D(V1), DfL (mV) and NMSE
(n.u.: normalized units). . . 68 4.7 F-wave amplitude linear regression in the long-term follow-up. . . 71 5.1 PCA characterization of STV content for long-term CA outcome prediction. 81 5.2 WPCA convergence. . . 88 5.3 Long-term CA outcome prediction through the WPCA decomposition . . . 88 5.4 ECG lead subsets with optimal prediction performance ofµePCA8 andµeWPCA8. 88
5.5 Short-term CA outcome assessment: interclass statistical analysis. . . 97 5.6 ROC analysis of the NMF decomposition for short-term CA outcome
pre-diction . . . 97 5.7 AF STV indices: extension to the 36-patient database in the long-term
follow-up. . . 100 6.1 Statistical analysis of the LR modeling of f-wave amplitude in long-term
CA outcome prediction. . . 105 6.2 ROC analysis of the LR modeling of f-wave amplitude in long-term CA
outcome prediction. . . 106 6.3 ECG lead subsets with optimal prediction performance based on the LR
score LRA . . . 106 6.4 LR analysis of combined ECG features for selection of CEE candidates:
unpaired statistical test and ROC analysis. . . 116 7.1 ROC analysis of the short-term CA outcome of the JE index directly
com-puted on the AA signal. . . 124 7.2 ROC analysis of the long-term CA outcome of the JE index directly
com-puted on the AA signal. . . 125 7.3 AUC criterion assessment of long-term AF termination prediction
perfor-mance of the MMI index directly computed on the AA signal . . . 126 7.4 ROC analysis of the long-term CA outcome of the JE index computed on
List of Tables x 7.5 ROC analysis of the short-term CA outcome of the JE index computed on
the PCA low-rank approximation to AA signal. . . 129 7.6 Unpaired statistical analysis and long-term CA outcome prediction
perfor-mance of MMI measures. . . 130 8.1 Number of subjects ns for whom regression order q is optimal according to
the AIC criterion. . . 143 8.2 Long-term CA outcome prediction: HR and RRI variability parameters
under the RRI independence assumption (non-parametric approach) . . . . 144 8.3 Long-term CA outcome prediction: HR and RRI variability parameters;
RRI time series is considered stationary and obeys a HDIG model, and its first moment is approximated to mean RRI. . . 144 8.4 Long-term CA outcome prediction: HR and RRI variability parameters;
RRI time series is considered stationary and obeys a HDIG model, without first moment approximations. . . 144 8.5 Long-term CA outcome prediction: HR and RRI variability parameters;
RRI time series is assumed non-stationary and obeys a HDIG model. . . . 145 8.6 Goodness-of-fit of the HDIG model in CA outcome prediction . . . 145 8.7 KS test of transformed RRIs: point process vs the KDE method. . . 147 8.8 Analysis of the skewness index computed on RRI data modeled by the
KDE method. . . 147 8.9 Number of subjects ns with optimal regression order q according to the
AIC criterion in AF pattern recognition. . . 149 8.10 LDA classification of HRV features determined on raw RRI series data. . . 151 8.11 LDA classification of HRV features under the point process modeling. . . . 151
Acronyms 2
Acronyms
AA atrial activity
AF atrial fibrillation
AEG atrial electrograms
AFCL atrial fibrillation cycle length
AFL atrial flutter
AIC Akaike information criterion
ALS alternating least squares
AR autoregressive
AT atrial tachycardia
AUC area under curve
AV atrioventricular
AVNRT AV nodal re-entrant tachycardia
bpm beats per minute
BSPM body surface potential mapping
CA catheter ablation
CDF cumulative distribution function
CEE electrical cardioversion
CFAE complex fractionated electrograms
CS coronary sinus
ECG electrocardiogram
EEG electroencephalogram
EVD eigenvalue decomposition
FN false negative
FP false positive
f-wave fibrillatory wave
HDG history-dependent Gaussian
HDIG history-dependent inverse Gaussian
HIS d distal HIS-bundle
HIS p proximal HIS-bundle
HOSVD high order singular value decomposition
HR heart rate
HRA high right atrial
HRV heart rate variability
IEGM intracardiac electrogram
IG IG inverse Gaussian
IT information theory
IVC inferior vena cava
JE joint entropy
KDE kernel density estimation
KS Kolmogorov-Smirnov
LA left atrium
LAA left atrial appendage
3 Acronyms
LIPV left inferior pulmonary vein
LOOCV leave-one-out cross validation
LR logistic regression LS least squares LV left ventricle MI mutual information ML maximum likelihood MLL maximum log-likelihood
MMI multivariate mutual information
MPCA multilinear principal component analysis
MSV mean square value
MV mitral valve
NMSE normalized mean square error
NMF nonnegative matrix factorization
n.u. normalized units
PAC premature atrial contraction
PARAFAC parallel factor analysis
PC principal component
PCA principal component analysis
PCHIP paroxysmal supraventricular tachycardia
PSVT pulmonary vein
PV pulmonary vein
QSE squared sample entropy
RA right atrium
RAA right atrial appendage
RIPV right inferior pulmonary vein
RMS root mean square
ROC receiver-operating curve
RRI RR interval
RSPV right superior pulmonary vein
RV right ventricle
r.v. random variable
RVA right ventricular apex
SA sinoatrial
STV spatio-temporal variability
SVA supraventricular arrhythmia
SVC superior vena cava
SVD singular value decomposition
TN true negative
TP true positive
TV tricuspid valve
VC venae cavae
WPCA weighted principal component analysis
1
Introduction
1.1
Background and motivation
Atrial fibrillation (AF) is currently the most common sustained cardiac arrhythmia, responsible for serious long-term issues, such as ictus and stroke. Unlike other cardiac diseases, despite advances in its understanding, AF mechanisms are not clear yet, and still need to be elucidated. Accordingly, several theories about its generation and maintenance have been put forward. Such a variety of hypotheses have given rise to several therapeutic approaches, mainly dependent on AF chronicity, as well as patient’s clinical background. One of the most recurrent strategies in persistent AF treatment is represented by ra-diofrequency catheter ablation (CA), aiming at cauterizing abnormal rhythm sources in the atrial myocardium.
Despite its increasing employment and the higher efficacy with respect to traditional cardioversion therapies, results obtained in clinical centers are still quite disparate and hardly comparable, due to the multiplicity of modalities and methodologies applied for ablation performance. Indeed, as AF causes are not known yet, it is equally hard to establish an effective protocol, applicable under any circumstances. By contrast, in med-ical centers CA performance is mainly guided by clinician’s considerations, related to the pratictioner’s experience and subjectivity. One of the main AF management lines consists in identifying potential positive responders to CA therapy, so as to exclusively treat patients who will benefit from CA and avoid unnecessary and potentially harmful procedures. Nevertheless, also in this case most of patient’s evaluation is frequently biased by clinician’s subjectivity, with no assessment of AF condition by means of quantitative and measurable parameters.
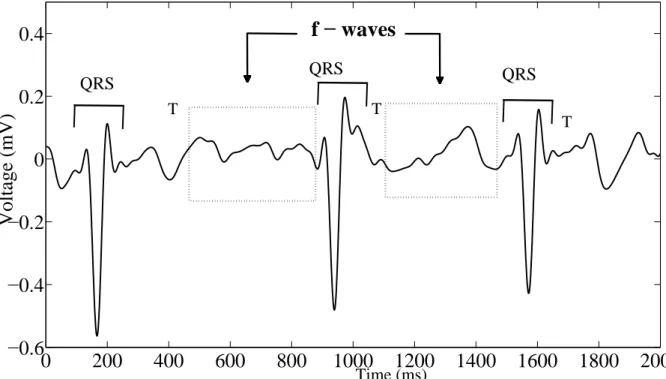
To this extent, some efforts have been made so as to search for any potential descrip-tors of heart electrical activity during AF, which can shed some light on CA effectiveness, thus revealing which patients can be treated by CA without risk of AF recurrence in the follow-up. Standard electrocardiogram (ECG) is widely employed in medical centers for recording heart electrical activity by means of some electrodes positioned on patient’s body and monitoring his conditions. It is characterized by several advantages: it is nonin-vasive, rapid, cost-effective, easy to acquire and provides potential diagnostic information about a wide variety of cardiac diseases. This tool is suitable for AF analysis, whose presence can be even visually detected on standard ECG, for instance, through the ab-sence of P waves, replaced by irregular fibrillatory waves (f-waves), and the more irregular RR interval (RRI) distribution. Accordingly, several attempts have been made in order to define novel ECG-based features to be combined with patient’s clinical characteristics and quantify CA effects on heart substrate in the presence of AF. Nevertheless, most
1.2. Objectives 6 of these parameters present several drawbacks. In particular, some of them are manu-ally obtained on the standard ECG, thus affecting repeatability of the measure, which is operator-dependent, and increasing error probability. In addition, such indices are usually computed in only one ECG lead, thus discarding the remaining ones. However, such an approach lacks robustness to lead selection, as spatial variability of surface ECG is not taken into account. ECG content can considerably change with respect to the heart plane and orientation considered, and so can the parameters measured at that specific location. Most of the traditional techniques are not able to process ECG content from all ECG leads at the same time, and they are therefore subject to the lead choice constraint.
1.2
Objectives
The present thesis takes a step from these preliminary considerations, and it is moti-vated by the research for novel multilead measures extracted from the 12-lead ECG which can predict AF termination by CA. Our investigation aims at yielding ECG-based pa-rameters which take into account contributions from all ECG leads, and which are herein compared with classical methods for AF analysis and CA outcome assessment. To this end, standard ECG content is properly processed by multivariate techniques that are able to enhance the most content-bearing components while reducing the influence of polluting and/or redundant elements. This strategy presents the potential of examining the whole multilead recording at once, with no need for an a priori selection of the ECG leads to be analyzed, since the most significant contributions are automatically emphasized.
One of the main goals of this work is characterizing some classical indices determined on the standard ECG in a multilead framework, and corroborating the correlation with CA clinical outcome. These objectives motivate the multivariate description of f-wave amplitude, widely regarded as a predictor of AF termination by CA. To the same extent, information about spatio-temporal variability (STV) of AF coming from surface ECG, which is usually exploited for rendering AF complexity, is herein applied to distinguish between successful and failing CA procedures. Combination of these heterogeneous fea-tures is also applied to prediction of AF recurrence after CA at several follow-ups. Another line of research investigates the predictive accuracy of other features, based on information theory (IT). These measures render the degree of AF regularity in terms of spatial corre-lation between ECG leads. Finally, AF analysis and CA outcome prediction are envisaged from another perspective, based on the analysis of the ventricular response. Changes in RRI variability due to AF impact are characterized in a parametric probabilistic scenario, modeling as well the dependence of RRI length on dynamic vagal inputs to the sinoatrial (SA) node is modeled as well.
1.3
Thesis overview and summary of contributions
The remaining of this thesis consists of 8 chapters (Chapters 2 - 9) divided in 3 main parts. In the first part, a general overview about the main themes envisaged in this dissertation is provided. In particular, in Chapter 2 we focus on some basic clinical
concepts, which help understanding the anatomy and the electrophysiology of the heart,
7 Introduction propagation. The informative content of the standard ECG and its clinical application are then illustrated, after indicating its main characteristics, both in healthy and pathologic conditions, and the processing modalities prior to information extraction.
Then, Chapter 3 introduces the AF problem. AF pathophysiology is herein defined, and the main theories about its generation and maintenance are summarized, as well as the criteria for classifying its complexity, which are crucial for therapeutic choices. Particular attention is paid to AF chronicity effects, altering atria structure and function through electromechanical remodeling. The most current AF therapies are then described in our dissertation. Pharmacological and electrical cardioversion are illustrated, and their advantages and drawbacks are reviewed. The final part of this chapter focuses on
ra-diofrequency CA, regarded as a new frontier in persistent AF treatment; its performance
modalities, as well as some of the protocols adopted, are explained. Issues derived from this therapy prompts the search for criteria allowing the selection of the most suitable candidates to be treated by CA. Hence, it motivates the analysis of standard ECG and the extraction of some measures conventionally regarded as predictors of procedural AF termination, yet affected by some critical drawbacks, such as their manual computation in a single lead.
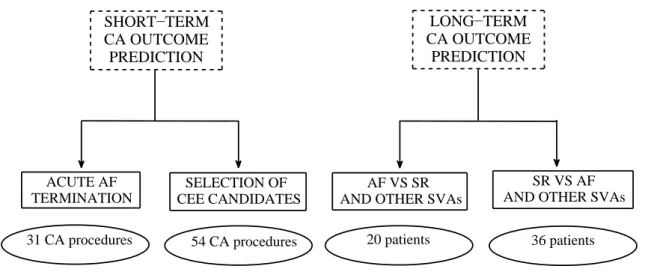
The central part of this thesis concerns the contributions and the methods developed to fulfill the objectives highlighted in the previous section. The principal lines of inves-tigation of this thesis can be graphically summarized in Fig. 1.1. The main goals of this
ECG FEATURES
F−WAVE RR VARIABILITY
AMPLITUDE STV POINT PROCESS
PCA SPATIAL REGULARITY (IT) PCA PCA WPCA NMF LR − LONG/SHORT−TERM CA OUTCOME PREDICTION − AF PATTERN RECOGNITION − LONG/SHORT−TERM CA OUTCOME PREDICTION
− SELECTION OF CEE CANDIDATES AFTER CA
Figure 1.1: Explicative diagram of the main parts composing the thesis study. Sections referring to ECG features are contained in solid-line boxes. The multivariate techniques employed are included in dash-dot boxes. Clinical applications tested are marked in dashed boxes. Meaning of acronyms: AF: atrial fibrillation; CA: catheter ablation; CEE: electrical cardioversion; ECG: electrocardiogram; f-wave: fibrillatory wave; IT: informa-tion theory; LR: logistic regression; NMF: nonnegative matrix factorizainforma-tion; PCA: prin-cipal component analysis; STV: spatio-temporal variability; WPCA: weighted PCA. work are the multilead assessment and enhancement of ECG features having remarkable
1.3. Thesis overview and summary of contributions 8 predictive properties for CA outcome definition. Accordingly, we mainly focused on 2 ECG characteristics, namely, fibrillatory waves (f-wave) and RR variability. First, in
Chapter 4 the predictive role of f-wave amplitude in CA of persistent AF, traditionally as-sessed in only one lead on surface ECG, is herein automatically computed and extended to multiple ECG leads. This is achieved by means of reduced-rank approximations to the AA
signal determined by principal component analysis (PCA), which enhance the maximum-variance components of the AA signal, and show to improve CA outcome prediction. This is demonstrated at different follow-up lengths, by properly combining contributions from all ECG leads through suitable statistical descriptors (e.g., the median amplitude).
Then, in Chapter 5 we investigate another ECG feature, depicting the spatio-temporal
variability (STV) of the AF pattern. Some single-lead measures of this AF property
re-cently proposed are correlated with AF complexity, traditionally assessed on endocardial recordings, for instance, by means of Wells’ and Konings’ criteria. In this thesis we provide
a multilead characterization of such indices, thus assessing not only the extent of temporal repetitiveness of the atrial pattern, but also its spatial distribution over ECG leads. To
this extent, several multivariate signal processing techniques, such as PCA, weighted PCA (WPCA), nonnegative matrix factorization (NMF), have been tested for AA signal processing. The measures output by the algorithms developed are able to discriminate
between effective and failing CA procedures at several follow-up periods.
In Chapter 6 we combine heterogeneous ECG features for assessing AF therapy out-come. Unlike previous chapters, we examine information about f-wave amplitude and
STV properties presented in Chapter 4 and Chapter 5 coming from all ECG leads at the
same time. Multivariate characterization of such measures is performed by the logistic
regression (LR) model, which properly weights contributions provided by the ECG leads
examined. Such selective action allows for enhancing components which are most relevant to CA outcome prediction, which has been effectively performed at different follow-up mo-ments.
In Chapter 7 we explore the potential predictive role of several indices typical of the
information theory (IT) domain, which quantify the level of coupling between leads, and
thus the degree of spatial correlation. This concepts have been borrowed from the theory of telecommunication systems, whose objective is assessing the amount of information exchanged between transmitter and receiver, and thus the percentage of data loss. To our knowledge, they are applied for the first time to CA outcome prediction in persistent AF and characterized in a multivariate framework. The link of AF regularity as measured by these parameters with clinical outcome of CA therapy is emphasized on multiple ECG leads, thanks to the compressing properties of PCA, enhancing the most relevant com-ponents of AA signal. Regularity assessment is first carried out on 2 ECG leads, and a multilead extension is provided as well.
In Chapter 8 we approach another perspective for AF analysis, based on the
charac-terization of the ventricular response. RRI distribution is modeled in a parametric prob-abilistic framework, not yet applied in the framework of AF, which takes into account the effects of the dynamic vagal inputs to the SA node on the RRI length. Features describing
9 Introduction characteristics and their predictive power in CA outcome assessment is investigated. Such indices are subsequently exploited in AF pattern recognition, and differences between AF and SR conditions are explored.
The final part of the manuscript includes Chapter 9, which summarizes the main results presented in this thesis and sheds some light on potential new perspectives for AF investigation and CA outcome prediction.
1.4
Publications issued from this work
1.4.1 International journals
M. Meo, V. Zarzoso, O. Meste, D. G. Latcu and N. Saoudi, Catheter Ablation Out-come Prediction in Persistent Atrial Fibrillation Using Weighted Principal Component Analysis, Biomedical Signal Processing and Control, special issue on atrial arrhythmias, 2013, in press.
M. Meo, V. Zarzoso, O. Meste, D. G. Latcu and N. Saoudi, Spatial Variability of the 12-Lead Surface ECG as a Tool for Noninvasive Prediction of Catheter Ablation Outcome in Persistent Atrial Fibrillation, IEEE Transactions on Biomedical Engineering, Vol. 60, no. 1, pages 20-27, Jan. 2013.
1.4.2 International conferences
M. Meo, V. Zarzoso, O. Meste, D. G. Latcu, N. Saoudi and R. Barbieri, Point Process Modeling of R-R Interval Dynamics during Atrial Fibrillation, Computing in Cardiology, Sept. 22-25, 2013, Zaragoza, Spain, accepted.
V. Zarzoso, M. Meo and O. Meste, Low-rank Signal Approximations with Reduced Error Dispersion, in: Proc. 21st European Signal Processing Conference (EUSIPCO), Marrakech, Morocco, September 9 - 13, 2013, accepted.
M. Meo, V. Zarzoso, O. Meste, D. G. Latcu and N. Saoudi, Noninvasive Prediction of Catheter Ablation Acute Outcome in Persistent Atrial Fibrillation Based on Logistic Re-gression of ECG Fibrillatory Wave Amplitude and Spatio-temporal Variability, in: Proc.
35th Annual International IEEE Engineering in Medicine and Biology Society Conference (EMBC), Osaka, Japan, July 3-7, 2013, pages 5821-5824.
M. Meo, D.G. Latcu, V. Zarzoso, O. Meste, M. Garibaldi, I. Popescu, N. Saoudi, Auto-matic Multilead Characterization of F-wave Amplitude Enhances Prediction of Catheter Ablation Outcome in Persistent Atrial Fibrillation, abstract presented at EHRA
EU-ROPACE 2013 , Athens, Greece, June 23-26 2013.
M. Meo, V. Zarzoso, O. Meste, D. G. Latcu and N. Saoudi, Multidimensional Charac-terization of Fibrillatory Wave Amplitude on Surface ECG to Describe Catheter Ablation
1.4. Publications issued from this work 10 Impact on Persistent Atrial Fibrillation, in: Proc. 34th Annual International IEEE Engineering in Medicine and Biology Society Conference (EMBC), San Diego, MA, Aug. 28 -Sep. 1, 2012, pages 617-620.
G. Laouini, O. Meste and M. Meo, Analysis of Heart Rate Variability Using Time-Varying Filtering of Heart Transplanted Patients, in: Proc. 34th Annual International
IEEE Engineering in Medicine and Biology Society Conference (EMBC), San Diego, MA,
Aug. 28- Sep. 1, 2012, pages 3436-3439.
M. Meo, D.G. Latcu, V. Zarzoso, O. Meste, M. Garibaldi, I. Popescu, N. Saoudi, Math-ematical Analysis of Atrial Spatiotemporal Complexity on Standard ECG for Catheter Ablation Outcome Prediction in Persistent Atrial Fibrillation, abstract presented at
Eu-ropean Society of Cardiology Congress, Munich, Germany, Aug. 25-29, 2012.
M. Meo, D.G. Latcu, V. Zarzoso, O. Meste, M. Garibaldi, I. Popescu, N. Saoudi, ECG Spatiotemporal Complexity Predicts Catheter Ablation Outcome in Persistent Afib, ab-stract presented at CARDIOSTIM 2012 , Nice, France, June 13-16, 2012.
M. Garibaldi, V. Zarzoso, D.G. Latcu, M. Meo, O. Meste, I. Popescu, N. Saoudi, Persistent Atrial Fibrillation Dominant Frequency on Standard ECG Predicts Catheter Ablation Outcome, abstract presented at CARDIOSTIM 2012 , Nice, France, June 13-16, 2012.
M. Meo, V. Zarzoso, O. Meste, D. G. Latcu and N. Saoudi, Nonnegative Matrix Fac-torization for Noninvasive Prediction of Catheter Ablation Outcome in Persistent Atrial Fibrillation, in: Proc. IEEE International Conference on Acoustics, Speech, and Signal
Processing (ICASSP), Kyoto, Japan, March 25-30, 2012, pages 601-604.
M. Meo, V. Zarzoso, O. Meste, D. G. Latcu and N. Saoudi, Catheter Ablation Out-come Prediction in Persistent Atrial Fibrillation Based on Spatio-Temporal Complexity Measures of the Surface ECG, in: Proc. Computing in Cardiology, Hangzhou, China , vol. 38, Sept. 18-21, 2011, pages 261-265.
M. Meo, V. Zarzoso, O. Meste, D. G. Latcu and N. Saoudi, Non-invasive Prediction of Catheter Ablation Outcome in Persistent Atrial Fibrillation by Exploiting the Spatial Diversity of Surface ECG, in: Proc. 33rd Annual International IEEE Engineering in
Medicine and Biology Society Conference (EMBC), Boston, MA, Aug. 30-Sep. 3, 2011,
Part I
Background
2
Electrophysiology of the heart and
electrocardiography
2.1
Introduction
The first part of this doctoral thesis aims at providing a general description of heart anatomy, its structure and leading steps of the cardiac cycle, responsible for distribution of oxygen to all parts of the human body. The main goal of this section is helping com-prehension of heart activity in healthy conditions so as to better understand alterations and complications deriving from cardiac diseases. Particular attention is paid to the electrical conduction system, enabling the propagation of electrical potentials throughout the cardiac tissue, and thus the blood pumping action intrinsic to the electromechanical coupling function. Recording heart electrical activity is essential for a rapid diagnosis of certain cardiac diseases, as well as a deeper understanding of their triggering causes. To this goal, the 12-lead ECG represents a noninvasive and cost-effective tool increasingly employed in clinical centers; hence, the increasing interest in developing sophisticated sig-nal processing techniques able to extract valuable clinical information, especially under pathological conditions. Accordingly, after introducing the clinical background around the heart and its main functions, we give a general description of the standard ECG and its main characteristics. More precisely, in Sec. 2.2 we provide a general overview of heart anatomy. Subsequently, we focus on the electrical conduction system in Sec. 2.3. Stan-dard ECG is then introduced in Sec. 2.4. Finally, an overall summary of our description is reported in Sec. 2.5.
2.2
Anatomy of the heart
Most of this chapter refers to [55, 96, 114, 143]. The human heart is an organ that pumps blood throughout the body via the circulatory system. It is located under the ribcage in the center of body chest between right and left lungs. It is widely known that the heart can be regarded as a pump propelling blood throughout the body and consisting of 4 chambers, made entirely of muscle. The upper chambers are referred to as atria, whereas the lower ones are named ventricles (see Fig. 2.1). These hollow compartments are delimited by heart walls, composed of cardiac muscle, called myocardium. A wall of muscle named the septum separates the right and the left side of the heart1.
2.2. Anatomy of the heart 14
Figure 2.1: Anatomy of the heart 2.
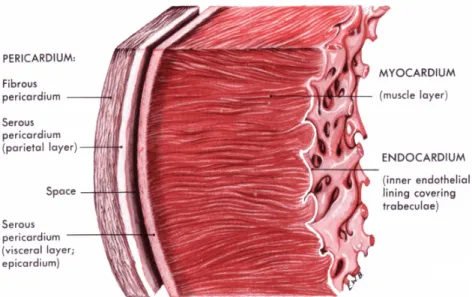
Moving from the outermost heart tissue layers, a double-walled sac called the peri-cardium encases the heart, so as to protect and anchor it inside the chest. It is formed by 3 layers, as shown in Fig. 2.2, and between them some pericardial fluid flows so as to lubricate the heart during contractions and movements of the lungs and diaphragm. The innermost pericardium component is referred to as the epicardium, which represents the external membrane enclosing the heart. Then we meet the myocardium, the thickest layer, consisting of cardiac muscle inducing contraction. Finally, the innermost layer, or endocardium, is the epithelial tissue lining in contact with the blood.
The heart can be regarded as an ensemble of 2 pumps connected in series. Indeed, it pumps blood through 2 circuits: the pulmonary circuit and the systemic circuit. The first one, the right ventricle (RV), receives blood from the right atrium (RA), after coming from superior and inferior venous cavae (SVC and IVC, respectively), and propels deoxygenated blood via the pulmonary artery. Blood reaches the lungs, absorbs oxygen and goes back to the left atrium (LA) and then to the left ventricle (LV) through the pulmonary veins (PVs). This pathway represents the pulmonary circuit. In the second pathway, the systemic circuit, oxygenated blood leaves the body via the aortic valve to the aorta, and from there enters the arteries and capillaries of the systemic circulation, where it supplies the body’s tissues with oxygen. Deoxygenated blood returns via the veins to the venae cavae (VC), re-entering the heart’s RA, so that the cycle can start again. Blood flow through the heart is unidirectional, thanks to the cardiac valves, whose opening and closure are enabled by proper pressure gradients. Between the RA and RV lies the tricuspid valve (TV), and between the LA and LV there is the mitral valve (MV). The pulmonary valve separates RV and the pulmonary artery, while the aortic valve lies in the outflow tract of the LV, and separates the RV from the aorta. All the aforementioned components of the heart are displayed in Fig. 2.1. A graphical representation of the blood circuits is provided in Fig. 2.3.
15 Electrophysiology of the heart and electrocardiography
Figure 2.2: Section of the heart wall showing the components of the outer pericardium (heart sac), muscle layer (myocardium), and inner lining (endocardium)2.
Figure 2.3: Schematic representation of the pulmonary and the systemic circuits with their main components [81].
2.3. The electrical conduction system 16
2.3
The electrical conduction system and the
elec-tromechanical coupling
The electrical conduction system of the heart, shown in Fig. 2.6, allows for the gener-ation and propaggener-ation of impulses via a specialized conduction pathway, which stimulate the heart to contract and pump blood. In contrast with other kinds of muscles, heart muscle fibers are self-excitatory. It turns out that potential generation can occur without any nerve signal triggers. The anatomy of cardiac muscle is such that the initiation of an action potential in a fiber would result in the action potential excitation of all the muscle fibers. Even though any part of the heart can generate impulses, the sinoatrial (SA) node serves as a natural pacemaker, since it exhibits the highest intrinsic frequency, thus it sets the activation frequency of the whole heart. It is located in the RA where VC terminates, and its firing rate is usually around 70 bpm. Even though its function is quite autonomous, we must mention that its pacing is also influenced by information sent by the sympathetic and the parasympathetic inputs of the autonomic nervous system. Indeed, the former increases the heart rate (HR), whereas the latter induces the opposite effect.
The cardiac cycle is created when such impulse propagates through the conduction system, so as to trigger the mechanical force. As a consequence, the electrical event always precedes the mechanical action. When RA is triggered to contract, it pumps the blood collected from all the parts of the body into the RV. When it is completely filled, blood is forced into the lungs for oxygenation and then returned to the LA through the PVs. Blood is finally emptied to the LV, so as to be spread throughout the body. As previously stated, all these mechanical events are triggered by electrical stimuli. Each cardiac cycle consists of 2 mechanical phases, contraction and relaxation, whose electrical counterparts are referred to as depolarization and repolarization, respectively. Depolarization is induced by a variation in the resting membrane potential of myocardial cells (from −90 to 20 mV), which rapidly spreads throughout the myocardium. The self-depolarization of the SA node enables a rhythmic series of action potentials, which spread throughout the RA and LA. This induces atria contraction, and blood is pumped into ventricles (diastole). The action potential propagates through the atria at a relatively slow velocity (0.3 − 0.4 m/s). Depolarization wavefront then reaches the atrioventricular (AV) node, which provides atria with a conductive pathway to ventricles. Since its natural frequency is lower than SA firing rate (i.e., about 50 bpm), the AV node spontaneously follows SA frequency. The action potentials propagates from the atrium to the AV node, thus allowing time for the atria to pump blood into the ventricles. The AV node is a pathway of muscle fiber which introduces a short delay of about 11 ms into the impulse propagation to the ventricles, so that atria can effectively contract and completely empty blood into ventricles. Signal transmission from the AV node to the ventricles is ensured by a specialized conduction system. It consists of a bundle, i.e., the bundle of His, which then ramifies into two bundle branches, which in turn divide into Purkinje fibers, directly connected to the inner ventricular walls. Such components are themselves large muscle fibers whose action potentials propagate at a velocity of 1.5 − 2 m/s. The depolarization wavefronts then spread through the ventricular wall, from endocardium to epicardium, enabling ventricular contraction. Once each ventricle cell has depolarized, repolarization allows for relaxation of the myocardial muscle, and the cardiac cycle can start again. This slow process gives
17 Electrophysiology of the heart and electrocardiography rise to a plateau in the cardiac action potential which can be observed in Fig. 2.6, in contrast with nerve and skeletal action potentials. This plateau allows the muscle fibers to contract in synchronism resulting in a forceful pumping action. The ECG signal, picked up by the surface electrode on the body surface is a superposition of these action potentials.
2.4
The standard 12-lead ECG
Due to their conductive nature, heart nerves and cells can be regarded as a source of electrical charges in motion during depolarization and repolarization processes within a volume conductor, i.e., the thorax. Indeed, the sum of cardiac cell potentials can be represented by a unique heart electrical vector in a first-order approximation, whose magnitude and direction change in time according to pulse wavefront propagation and strength. The electrical field generated by these charges can be thus detected on its equipotential lines on thorax surface. This electrical activity signal can be acquired by means of electrodes positioned on the subject’s thorax and then amplified and recorded by the electrocardiograph. Electrocardiography is a commonly used, noninvasive procedure for recording heart electrical activity. The signal recorded, named electrocardiogram (ECG or EKG), graphically shows the series of waves associated with electrical phenomena of depolarization and repolarization of the heart during the cardiac cycle, and represents the summation in space of the action potentials generated by the myocadial cells at each time instant. The first practical ECG was invented in 1903 by Einthoven, who was awarded with the Nobel Prize in Medicine in 1924 for it. He refined the string galvanometer used for measuring the heart’s rhythms, and he also paid attention to wave terminology definition and examination of some cardiac disorders on ECG [49]. ECG leads thus report the instantaneous difference in potential between electrodes. The signals are detected by means of metal cutaneous electrodes attached to the extremities and chest wall, and they are then amplified and recorded by the electrocardiograph. A difference of voltage can be measured between each pair of electrodes, named lead, whose amplitude and direction depend on electrodes’ configuration. ECG signal values are generally quite low, ranging from a few microvolt up to 1 V, therefore acquisition system always includes an amplifier.
As it is a noninvasive, rapid and cost-effective test, ECG is a valuable and highly versatile tool in clinical practice for detecting several heart dysfunctions by inspection of alterations in ECG pattern shape or duration of wave intervals.
Electrocardiography is a starting point for detecting many cardiac problems, such as angina pectoris, ischemic heart disease, arrhythmias, myocardial infarction. In addition, it may reveal other findings related to life-threatening metabolic disturbances (e.g., hy-perkalemia) or increased susceptibility to sudden cardiac death (e.g., QT prolongation syndromes). It is routinely employed for monitoring surgeries and exercise tolerance tests (e.g., stress tests), as well as evaluating certain symptoms (for instance, chest pain, shortness of breath, palpitations).
As previously stated, the ECG records the complex spatial and temporal summation of electrical potentials from multiple myocardial fibers conducted to the surface of the body [55]. Each group of cells depolarizing at the same time can be represented as an equivalent current dipole vector. Each vector describes the dipole’s time-varying position,
2.4. The standard 12-lead ECG 18 orientation, and magnitude. The vectors related to all these groups can be summed to give a dominant vector which describes the main direction of the electrical impulse throughout the heart. In order to better understand the generation of the ECG signal, Fig. 2.4 displays the sequence of the instantaneous heart wavefront vectors at each step of the cardiac cycle. Each phase of the depolarization and repolarization processes are reflected on ECG by the following characteristic points, also shown in Fig. 2.5:
• P wave: it describes simultaneous depolarization of left and right atria. The normal atrial depolarization vector is oriented downward and toward the subject’s left, as it reflects the wavefront moving from the SA to the RA and then the LA myocardium. • QRS complex: it represents ventricular depolarization. As ventricles have larger mass compared to the atria, the QRS complex usually has a much larger amplitude than the P wave. The process can be divided into 2 major, sequential phases. The first one concerns the depolarization of the interventricular septum from the left to the right and anteriorly. The second phase includes the simultaneous depolarization of RV and LV. The QRS pattern in the extremity leads may vary considerably from one normal subject to another depending on the electrical axis of the QRS, whose mean orientation is referred to the 6 frontal plane leads. In healthy conditions, the QRS axis ranges between −30◦ and +100◦. Any deviation outside the lower (upper) bound is referred as to left (right) axis deviation. It may occur as a normal variant of heart condition, but sometimes it can also be symptom of more serious diseases. • T wave: it is associated with ventricular repolarization, and its representative vector is oriented roughly concordant with the mean QRS vector (within about 45◦ in the frontal plane). The interval from the beginning of the QRS complex to the apex of the T wave is referred to as the absolute refractory period, whereas the terminal part of the T wave reflects the relative refractory period.
Atrial repolarization is usually too low in amplitude to be detected, but it may become apparent in some conditions, e.g., acute pericarditis or atrial infarction. The QRST waveforms of the standard ECG correspond in a general way with the different phases of simultaneously obtained ventricular action potentials, depicting the activity of single myocardial fibers. With reference to Fig. 2.6, the rapid upstroke of the action potential corresponds to the QRS onset. This is followed by the plateau phase, corresponding to the isoelectric ST segment, and then completed by the active repolarization, represented by the inscription of the T wave on ECG.
ECG baseline (the flat horizontal segments) is measured between the end of the T wave and the beginning of the next P wave. It represents the resting potential of the myocardial cells. Also in the PR and ST segments we encounter ECG baseline. In SR conditions, the baseline is equivalent to the isoelectric line (0 mV). By contrast, in presence of certain diseases there could be drifts from zero due to injury currents flowing when the ventricles are at rest.
In clinical practice, some intervals are also studied on ECG, knowing that alterations in their duration can be symptom of certain pathologies. In particular we mention:
• RR interval: the mean distance between two consecutive R peaks provides a HR measure, ranging between 60 and 100 bpm at rest.
• PR interval: starting at the beginning of the P wave up to the beginning of the QRS complex, it indicates the time of propagation of the potential action from the SA to the AV node, thus rendering a good estimate of AV node function.
19 Electrophysiology of the heart and electrocardiography
Figure 2.4: Sequence of the instantaneous heart wavefront vectors at each step of the cardiac cycle [96].
2.4. The standard 12-lead ECG 20
Figure 2.5: ECG signal, its fiducial points and the corresponding phases in the cardiac cycle [68].
Figure 2.6: The heart conduction system with its main components, their typical potential waveforms and the corresponding points on surface ECG [96].
21 Electrophysiology of the heart and electrocardiography the T wave. A prolonged duration is predictive of ventricular tachyarrhythmias and sudden death.
The choice of a unique, standard system of lead position for ECG acquisition derives from the need to compare cardiac potentials recorded in different subjects, and examine signals acquired in the same subject, but at different times and places. In the standard ECG 12 leads are employed. More precisely, 10 electrodes are placed at standardized positions of the body surface. As explained later, some potentials are linearly dependent between them. Since the voltages recorded in the leads are regarded as projections of the heart electrical vector on the particular lead, any two of the leads may be used to plot the instantaneous magnitude and direction of the cardiac vector in the plane they form.
The ECG leads can be subdivided into two general types, namely, bipolar leads and unipolar leads [109]. A bipolar lead consists of two electrodes placed at two distinct sites, so as to register the difference in potential between them. The actual absolute potential at either electrode is not known, and only the difference between them is recorded. One electrode is designated as the positive input; the potential at the other, or negative, electrode is subtracted from the potential at the positive electrode to yield the bipolar potential. Unipolar leads, in contrast, measure the absolute electrical potential at one site, with respect to a reference potential, which is deemed to be zero. In clinical elec-trocardiography, a specially designed electrode configuration is adopted for the 12-lead ECG, detailed in Sec. 2.4.1-2.4.3.
2.4.1 Einthoven’s leads
The first 3 leads are defined by Einthoven’s triangle. Each lead measures the difference in potential between electrodes at 2 of the 3 extremities (right arm; left arm; left leg), as displayed in Fig. 2.7. Potentials are thus defined as:
I = ΦL− ΦR (2.1)
II = ΦF− ΦR (2.2)
III = ΦF− ΦL (2.3)
where I, II and III stand for potential of lead I, II and III, respectively, ΦL, ΦR and ΦF represent the potentials at the left arm, the right arm and the left foot. As these leads form a closed circuit, each of them can be expressed as a linear combination of the other ones:
II = I + III (2.4)
What is more, since these 3 electrodes are positioned at the corners of a equilateral triangle, containing the human heart at the center, such a leads’ configuration registers heart electrical activity on the frontal plane, and each direction differs from the other one of 60◦. Note that the right leg acts as a ground potential.
7http://www.nottingham.ac.uk/nursing/practice/resources/cardiology/function/bipolar_
2.4. The standard 12-lead ECG 22
Figure 2.7: Frontal ECG leads: Einthoven’s leads, and Goldberger’s (augmented) leads7.
2.4.2 Goldberger’s leads
In addition to the bipolar limb leads, there are 3 augmented limb leads, also known as Goldberger’s leads. Potential of these leads is measured by assuming the central Wilson’s terminal (or indifferent electrode) as a reference. This ground electrode is referenced against a combination of the other limb electrodes, from which they are shifted of 30◦. Hence, these potentials aVR, aVL and aVF, are considered unipolar and are electrically augmented by 50% by omitting the resistance from the Wilson central terminal, which is connected to the measurement electrode. Potentials measured are mathematically ex-pressed as: aVR = I − II 2 (2.5) aVL= I − 1 2II (2.6) aVF = II − 1 2I (2.7) 2.4.3 Precordial leads
The limb leads take into account direction of depolarization in the frontal plane. However, as the heart is not parallel to this plane, related leads give information about the inferior and lateral walls but do not distinguish between other areas, in particular septal and anterior and lateral heart walls. The precordial, unipolar leads are positioned in specific sites on the rib cage and record potentials transmitted onto the horizontal plane (see Fig. 2.8). In particular, leads V1 and V2 are positioned at the 4th intercostal space, to the right and the left of the sternum, respectively. Lead V3 is placed midway between V2 and V4, which is in turn located on the midclavicular line, at the 5th intercostal space; lead V5 is on the anterior axillary line, at the same level as V4. Finally, lead V6 is positioned on the midaxillary line, at the same level as V4 and V5.
2.4.4 Information content of the standard ECG
In this framework, all the aforementioned electrodes provide a three-dimensional rep-resentation of heart electrical activity in the cardiac cycle. Most of the heart’s electric
23 Electrophysiology of the heart and electrocardiography
Figure 2.8: Precordial ECG leads [96].
Figure 2.9: The projections of the lead vectors of the standard ECG system in 3 orthogonal planes. The volume conductor is assumed to be spherical homogeneous and the cardiac source centrally located [96].
activity can be characterized with a dipole source model. Under this hypothesis, 3 linearly independent leads (2 limb leads and a precordial one) are sufficient to describe heart elec-trical activity temporal evolution. Indeed, in the 12-lead system, there is a redundancy of 4 leads. The limb leads and the augmented leads can be expressed as a function of 2 independent potential differences, therefore standard ECG includes 8 independent leads. The interest in considering also the other leads can be explained by the standard ECG ability to detect further nondipolar components, which have diagnostic significance because of their proximity to the frontal part of the heart.
The main reason for recording also redundant leads is that it enhances pattern recogni-tion. Indeed, it allows comparing the projections of the resultant vectors in two orthogonal planes and at different angles. For instance, right precordial leads, V3R and V4R, are useful in detecting evidence of acute right ventricular ischemia. In Fig. 2.9, ECG lead projections are displayed in 3 perpendicular planes.
2.4. The standard 12-lead ECG 24
Figure 2.10: Examples of IEGM. HRA: high right atrial IEGM; HIS p and HIS d: proximal and distal HIS-bundle IEGM; CS 1 − 2, CS 3 − 4, CS 5 − 6, CS 7 − 8, CS 9 − 10: distal bipole 1 − 2, bipole 3 − 4, bipole 5 − 6, bipole 7 − 8, proximal bipole 9 − 10, respectively; RVa = RV apex IEGM; Stim 2 = stimulus channel. These signals are induced by straight atrial pacing with a drive-cycle length of 340ms and acquired by means of a decapolar catheter in the CS and quadripolar catheters in the high RA, His-bundle region and RV apex, according to the protocol described in [51].
2.4.5 Other forms of heart electrical activity recording
For the sake of completeness, even though our investigation merely focuses on standard ECG, it is worth to provide a few notions about other kinds of signals depicting heart electrical activity, whose description can help comprehension of other sections of this dissertation, in particular those concerning AF organization and type classification.
Intracardiac electrograms
An intracardiac electrogram (IEGM) is a record of timing or sequence of activation of specific cardiac locations (e.g., the distal CS or the left upper PV), as measured with electrodes directly placed within the heart via endocardiac catheters. They are generally employed for recording electric potentials of sites that cannot be assessed by body surface electrodes, for instance, the bundle of His, which is too small to produce sufficiently high voltages to register on the surface ECG [162]. Furthermore, it is widely know how difficult is to correlate heart electrical events recorded at body surface with in-depth activity, therefore knowledge about ECG content needs to be supported by intracardiac signals.
There are two types of IEGMs, namely, bipolar and unipolar signals. Bipolar signals are produced when the voltages on the two recording electrodes both vary with time - as is the case when each is positioned within the heart. By contrast, unipolar signals are produced when one varying signal is compared with a constant (or indifferent) reference placed outside the heart. In general, clinical practice refers to bipolar signals, as they reduce far-field signals and they are less prone to electrical noise [162]. Examination of unipolar signals is motivated by interest in signals from each pole of a catheter separately. In Fig. 2.10 some examples of IEGMs are shown.

![Figure 2.4: Sequence of the instantaneous heart wavefront vectors at each step of the cardiac cycle [96].](https://thumb-eu.123doks.com/thumbv2/123doknet/13129748.387986/44.892.175.763.218.941/figure-sequence-instantaneous-heart-wavefront-vectors-cardiac-cycle.webp)
![Figure 2.6: The heart conduction system with its main components, their typical potential waveforms and the corresponding points on surface ECG [96].](https://thumb-eu.123doks.com/thumbv2/123doknet/13129748.387986/45.892.263.588.697.980/figure-conduction-components-typical-potential-waveforms-corresponding-surface.webp)
![Figure 2.11: Example of electroanatomic voltage map [116]. LIPV: left inferior PV. RIPV:](https://thumb-eu.123doks.com/thumbv2/123doknet/13129748.387986/50.892.301.631.105.459/figure-example-electroanatomic-voltage-lipv-left-inferior-ripv.webp)
![Figure 3.4: CEE procedure for conversion of AF to normal SR [148].](https://thumb-eu.123doks.com/thumbv2/123doknet/13129748.387986/62.892.290.643.112.332/figure-cee-procedure-conversion-af-normal-sr.webp)