Pépite | Smart City : Implémentation et développement des plateformes pour gestion SunRise Smart Campus
163
0
0
Texte intégral
(2) Thèse de Shayar Ali, Université de Lille, 2018. © 2018 Tous droits réservés.. lilliad.univ-lille.fr.
(3) Thèse de Shayar Ali, Université de Lille, 2018. ACKNOWLEDGMENTS Firstly, I would like to express my sincere gratitude to my advisor Prof. Isam SHAHROUR for the continuous support of my Ph.D study and related research, for his patience, motivation, and immense knowledge. His guidance helped me in all the time of research and writing of this thesis. I could not have imagined having a better advisor and mentor for my Ph.D study.. Besides my advisor, I would like to thank the rest of my thesis committee: Prof. Marwan SADEK, Prof. Aziz SOULHI, Prof. Fadi HAGE CHEHADE, Prof. Azzedine HANI, Prof. Sawsan SADEK, Dr. Alia QUIRIN HATEM, and Dr. Yasin FAHJAN, for their insightful comments and encouragement, but also for the hard question, which incented me to widen my research from various perspectives.. My sincere thanks also goes to Dr. Ammar Aljer, who helped and provided me an opportunity to join SunRise team, and who gave access to the laboratory and research facilities. Without his precious support, it would not be possible to conduct this research. Thanks to the laboratory of LGCgE, most of my theatrical foundations are built in the laboratory. I look forward to call each of you friends and colleagues in the laboratory for many years to come for their pleasant atmosphere and for supporting me every day for several years.. Last but not the least, I would like to thank my family: my parents specially my mother and my wife and to my brothers and sister for supporting me spiritually throughout writing this thesis and my life in general.. © 2018 Tous droits réservés.. lilliad.univ-lille.fr.
(4) Thèse de Shayar Ali, Université de Lille, 2018. Abstract This PhD work concerns the implementation and development of platforms for the management of Smart Cities. It is a part of SunRise project, which aims at turning the Scientific Campus of Lille University into a large-scale demonstrator site of the "Smart and Sustainable City". The campus is representative of a small town of 25000 inhabitants and 100 km of urban infrastructure. This thesis is composed of five parts. The first part includes a literature review concerning the Smart Cities with its definitions and components. The second part presents the role of data in Smart Cities, as well as the latest technologies that are used for Smart City management. It presents also the different existing architectures and platforms for management a Smart City. The Third part presents the SunRise Smart City demonstrator, which is used as a basis for this thesis. The part details the instrumentation installed in the demo site as well as the GIS model of the demonstrator. The fourth part concerns the architecture of the two professional platforms PI System and OpenDataSoft as well as their implementation and use for the analysis of water consumption. The last part describes the architecture of the platform SunRise and details its layers. It presents also the stages of the platform development and implementation.. Keywords: Smart Cities, data management, IoT, PI system, OpenDataSoft, platform, ICT, WebGIS, GIS, SunRise, Campus.. i © 2018 Tous droits réservés.. lilliad.univ-lille.fr.
(5) Thèse de Shayar Ali, Université de Lille, 2018. RESUMÉ Ce travail concerne la mise en place et le développement de plateformes informatiques pour la gestion des villes intelligentes. Il s’inscrit dans le cadre du projet SunRise qui vise à transformer le campus de la Cité Scientifique de l'Université de Lille en une «ville intelligente et durable». Le campus est représentatif d'une petite ville de 25 000 habitants et de 100 km de réseaux urbains. Cette thèse est composée de cinq parties. La première partie comprend un état de l’art concernant les villes intelligentes, notamment les composantes de ces villes. La deuxième partie présente le rôle des données dans les villes intelligentes, ainsi que les dernières technologies utilisées pour la gestion des villes intelligentes. Elle présente également les architectures et plateformes existantes pour la gestion de la ville intelligente. La troisième partie présente le démonstrateur SunRise Smart City, sur lequel s’appuie cette thèse. Elle décrit l'instrumentation du site de démonstration ainsi que son modèle SIG. La quatrième partie concerne l'architecture des deux plateformes professionnelles PI System et OpenDataSoft ainsi que leur installation e utilisation pour l'analyse de la consommation d'eau. La dernière partie décrit l'architecture de la plateforme SunRise développée dans ce travail de thèse. Elle présente les étapes du développement et l’implémentation de cette plateforme.. Mots-clés : Ville intelligente, gestion des données, IoT, PI system, OpenDataSoft, plateforme, ICT, WebSIG, SIG, SunRise, Campus.. ii © 2018 Tous droits réservés.. lilliad.univ-lille.fr.
(6) Thèse de Shayar Ali, Université de Lille, 2018. Table of Content List of Figures ....................................................................................................................................vi List of Tables .................................................................................................................................................. ix List of Abbreviations ................................................................................................................................... x General introduction .................................................................................................................................. 1 Chapter 1 – Smart Cities state of the art ........................................................................................... 4 1.1. City Challenges ................................................................................................................................ 4. 1.1.1. Transportation ....................................................................................................................... 5. 1.1.2. Waste Management .............................................................................................................. 5. 1.1.3. Water and Energy Management ...................................................................................... 6. 1.1.4. Human Services ..................................................................................................................... 6. 1.2. Need for Smart Solutions ............................................................................................................ 7. 1.2.1. Why Smart Cities? ................................................................................................................. 7. 1.2.2. What is a Smart City? ........................................................................................................... 8. 1.2.3. Digital City, Intelligent City and Smart City ................................................................. 9. 1.2.4. Definitions of A Smart City ............................................................................................. 10. 1.2.5. Smart City Components ................................................................................................... 11. 1.3. Examples of Smart Cities .......................................................................................................... 16. 1.3.1. Singapore ............................................................................................................................... 16. 1.3.2. Barcelona, Spain ................................................................................................................. 20. 1.3.3. Rio de Janeiro, Brazil ......................................................................................................... 24. 1.3.4. Amsterdam, Netherlands ................................................................................................ 27. 1.4. Conclusion...................................................................................................................................... 27. Chapter 2 – Smart City Management................................................................................................ 30 2.1. The Role of Data in Smart Cities ............................................................................................ 30. 2.2. Smart City Data Management ................................................................................................. 30. 2.2.1. Internet of things (IoT) .................................................................................................... 31. 2.2.2. Big Data (DeRen Li, Cao, and Yao 2015) .................................................................... 34. 2.2.3. Cloud computing (Hashem et al., 2015, 2016) ........................................................ 36. 2.3. Smart City Architectures .......................................................................................................... 38. 2.4. Smart City Platforms .................................................................................................................. 45. 2.4.1. Presentation of existing Smart Cities platforms..................................................... 46. 2.4.2. Essential Requirements ................................................................................................... 51. 2.5. Conclusion...................................................................................................................................... 55 iii. © 2018 Tous droits réservés.. lilliad.univ-lille.fr.
(7) Thèse de Shayar Ali, Université de Lille, 2018. Chapter 3 – Presentation of SunRise Project ............................................................................... 57 3.1. Introduction .................................................................................................................................. 57. 3.2. Scientific Campus of the University of Lille ...................................................................... 57. 3.2.1. Building Assets .................................................................................................................... 58. 3.2.2. Drinking water network (FARAH 2016) ................................................................... 60. 3.2.3. Heating network (AYARI 2014) .................................................................................... 63. 3.2.4. Electrical network (SAKR 2017) .................................................................................. 65. 3.2.5. Sewage network.................................................................................................................. 68. 3.3. Conclusion...................................................................................................................................... 72. Chapter 4 – Implementation of professional platforms in SunRise Smart City Demonstrator .............................................................................................................................................. 74 4.1. Introduction .................................................................................................................................. 74. 4.2. Use of PI System .......................................................................................................................... 74. 4.2.1. PI Interfaces & Connectors ............................................................................................. 75. 4.2.2. PI Server................................................................................................................................. 76. 4.2.3. PI Visualization.................................................................................................................... 77. 4.3. Implementation of PI System in SunRise ........................................................................... 78. 4.3.1. Data collection ..................................................................................................................... 78. 4.3.2. Data connection and storage ......................................................................................... 80. 4.3.3. Data structure creation .................................................................................................... 83. 4.3.4. Analysis creation ................................................................................................................ 86. 4.3.5. Results visualization ......................................................................................................... 92. 4.4. Application of PI Analyses to water leak detection ....................................................... 96. 4.4.1. Global Balance Method..................................................................................................... 96. 4.4.2. Global balance - SunRise water system ..................................................................... 96. 4.4.3. Threshold Water Consumption Profile ...................................................................... 98. 4.4.4. TWCP – SunRise water system (2016) ...................................................................... 99. 4.5. OpenDataSoft ..............................................................................................................................106. 4.5.1. Presentation .......................................................................................................................106. 4.5.2. Implementation of OpenDataSoft in SunRise ........................................................106. 4.5.3. Data collection ...................................................................................................................107. 4.5.4. Data processing .................................................................................................................107. 4.5.5. Data storage........................................................................................................................108. 4.5.6. Data analyses and visualization ..................................................................................109. 4.5.7. Implementing of TWCP using ODS tools .................................................................115 iv. © 2018 Tous droits réservés.. lilliad.univ-lille.fr.
(8) Thèse de Shayar Ali, Université de Lille, 2018. 4.6. Conclusion....................................................................................................................................119. Chapter 5 – Development of the Platform SunRise ................................................................121 5.1. Introduction ................................................................................................................................121. 5.2. Architecture of SunRise Platform .......................................................................................121. 5.3. SunRise platform development ...........................................................................................123. 5.3.1. Data collection ...................................................................................................................123. 5.3.2. Data storage........................................................................................................................123. 5.3.3. Data analysis ......................................................................................................................124. 5.3.4. Data display and visualization ....................................................................................124. 5.3.5. User interface and stockholders’ interaction ........................................................132. 5.4. Conclusion....................................................................................................................................139. General conclusion .....................................................................................................................................140. v © 2018 Tous droits réservés.. lilliad.univ-lille.fr.
(9) Thèse de Shayar Ali, Université de Lille, 2018. List of Figures Figure 1.1: World's population estimation............................................................................................ 4 Figure 1.2: World's Urbanisation Estimation ....................................................................................... 5 Figure 1.3: Smart City components ....................................................................................................... 11 Figure 2.1: Internet of Things (IoT DawnBIT.com)) ....................................................................... 31 Figure 2.2 : Radio Frequency Identification Tag .............................................................................. 32 Figure 2.3: Example of Wireless Sensor Network ........................................................................... 33 Figure 2.4: Big Data characteristics ....................................................................................................... 35 Figure 2.5: Cloud Computing (source: datamation.com) .............................................................. 36 Figure 2.6: The difference between IaaS, PaaS, and SaaS ............................................................. 38 Figure 2.7: The architecture of USN platform ................................................................................... 40 Figure 2.8 : Smart city initiative Framework ..................................................................................... 42 Figure 2.9: Platforms based on enabling technologies (Santana et al., 2016) ...................... 46 Figure 3.1: Scientific Campus of the University of Lille, support of SunRise demonstrator (145 buildings) .............................................................................................................................................. 58 Figure 3.2: The distribution of campus buildings by sector ........................................................ 59 Figure 3.3: Pipes and hydrants distribution in the campus ......................................................... 60 Figure 3.4: General meters........................................................................................................................ 61 Figure 3.5: Distribution of the general and sub-meters in the campus ................................... 62 Figure 3.6: The heating network in the campus ............................................................................... 64 Figure 3.7: The electrical grid in the scientific campus ................................................................. 66 Figure 3.8: Fiber optic communication network (in yellow) ...................................................... 67 Figure 3.9: The public lighting network in the campus ................................................................. 68 Figure 3.10: Stormwater network in the Campus of university Lille1 .................................... 69 Figure 3.11: The stormwater system with watersheds limit ...................................................... 70 Figure 3.12: Wastewater system in the Campus .............................................................................. 72 Figure 4.1: PI System components......................................................................................................... 75 Figure 4.2: PI System implementation steps ..................................................................................... 78 Figure 4.3: Telemetry system .................................................................................................................. 79 Figure 4.4: Example of an UFL file ......................................................................................................... 83 Figure 4.5: Elements that represents all networks ......................................................................... 84 Figure 4.6: Structure of drinking water network ............................................................................. 84 Figure 4.7: Example of an element attributes ................................................................................... 85 Figure 4.8 : An attribute settings ............................................................................................................ 85 vi © 2018 Tous droits réservés.. lilliad.univ-lille.fr.
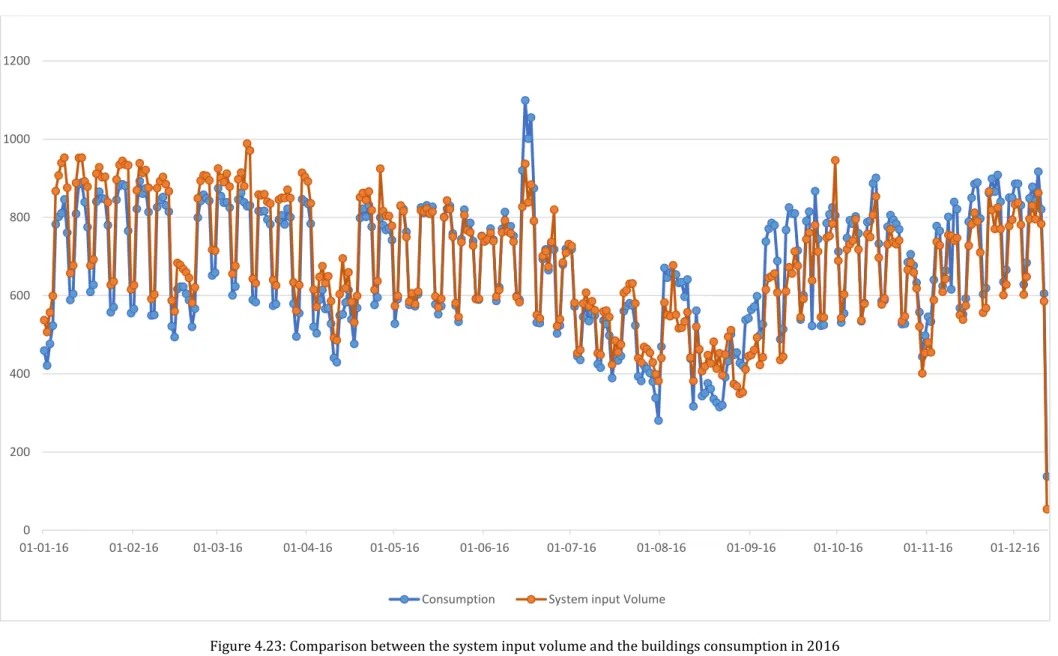
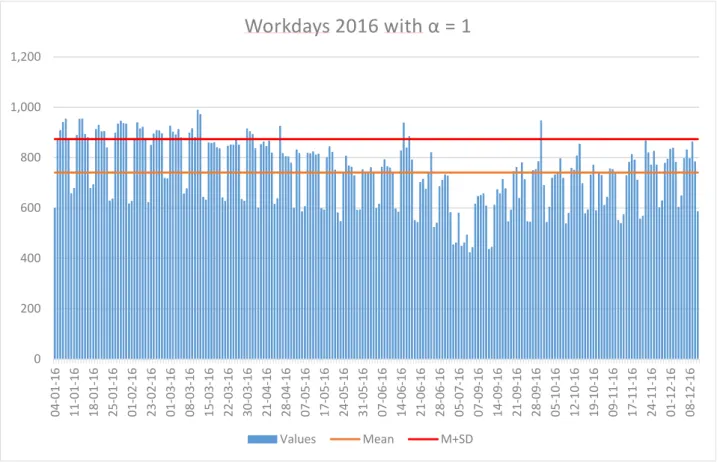
(10) Thèse de Shayar Ali, Université de Lille, 2018. Figure 4.9 : Created templates and tables........................................................................................... 86 Figure 4.10 : Examples of expression analyses................................................................................. 87 Figure 4.11: Output attributes of applied analyses ......................................................................... 88 Figure 4.12 : Rollup analysis setting example ................................................................................... 89 Figure 4.13 : Created analyses ................................................................................................................. 90 Figure 4.14: Example of expression analyses .................................................................................... 91 Figure 4.15: Example of rollup analyses.............................................................................................. 91 Figure 4.16 : Backfilling operation settings ....................................................................................... 92 Figure 4.17: Water consumption compression for building of "CAMUS" ............................... 93 Figure 4.18: Analysis output attributes for restaurant "BARROIS" .......................................... 93 Figure 4.19: PI DataLink ribbon in Excel ............................................................................................. 94 Figure 4.20: An example of searching specific items ...................................................................... 94 Figure 4.21: An example of compressed data .................................................................................... 95 Figure 4.22: An example of sampled data ........................................................................................... 95 Figure 4.23: Comparison between the system input volume and the buildings consumption in 2016 .................................................................................................................................. 97 Figure 4.24: Flow chart of TWCP methodology ................................................................................ 98 Figure 4.25: Daily consumption in workdays in the year 2016 with the factor a = 1 ......100 Figure 4.26: Daily consumption in workdays in the year 2016 with the factor a = 2......100 Figure 4.27: Daily consumption in Saturdays in the year 2016 with the factor a = 1 .....101 Figure 4.28: Daily consumption in Saturdays in the year 2016 with the factor a = 2 .....101 Figure 4.29: Daily consumption in Sundays in the year 2016 with the factor a = 1 .........102 Figure 4.30: Daily consumption in Sundays in the year 2016 with the factor a = 2 .........102 Figure 4.31: Daily consumption in Holidays in the year 2016 with the factor a = 1 ........103 Figure 4.32: Daily consumption in Holidays in the year 2016 with the factor a = 2 ........103 Figure 4.33: New mean and standard deviation ............................................................................105 Figure 4.34: High probability of leakage detection .......................................................................105 Figure 4.35: The architecture of water data tables .......................................................................107 Figure 4.36: An example of applying ODS built-in processors .................................................108 Figure 4.37 : Water data API ..................................................................................................................108 Figure 4.38: A comparison between the general and sub meters consumption in 2015 and 2016 ........................................................................................................................................................109 Figure 4.39: Distribution of the water consumption over the general meters in 2016 ..110 Figure 4.40: The consumption of each general meter..................................................................110 Figure 4.41: The distribution of the water consumption for the sub-meters in 2016 ....111 vii © 2018 Tous droits réservés.. lilliad.univ-lille.fr.
(11) Thèse de Shayar Ali, Université de Lille, 2018. Figure 4.42: Water consumption for the CROUS domain ...........................................................111 Figure 4.43: Consumption of LILLE1 buildings in 2016 ..............................................................112 Figure 4.44: Distribution of the water consumption by sections ............................................113 Figure 4.45 (a): Distribution of water consumption over the MATHMATICS section .....113 Figure 4.45 (b): Distribution of water consumption over the PHYSICS section ................114 Figure 4.45 (c): Distribution of water consumption over the CHEMISTRY section .........114 Figure 4.46: The water consumption during workdays and holidays of the year 2016 .115 Figure 4.47: The water consumption in Saturdays and Sundays of the year 2016 ..........115 Figure 4.48: Daily consumption in Holidays in the year 2016 before eliminating values ...........................................................................................................................................................................118 Figure 4.49: High probability of leakage detection during the holidays ...............................118 Figure 4.50: A web application created with ODS tools ..............................................................119 Figure 5.1: The architecture of SunRise platform ..........................................................................122 Figure 5.2: GIS Model of the water network ....................................................................................125 Figure 5.3 : Model-View-Controller pattern.....................................................................................126 Figure 5.4: Hierarchical-Model-View-Controller pattern (Source: inviqa.com) ................127 Figure 5.5: The list of the some existing sensors in the water network ...............................129 Figure 5.6: Comparison the water consumption between the buildings of Chemistry sector in a period of time .........................................................................................................................129 Figure 5.7 : Pop-up HTML configuration ...........................................................................................130 Figure 5.8: A flow chart for multi_statistics function ...................................................................131 Figure 5.9: A compression between the water consumption of three sensors in CHIMESTRY sector .....................................................................................................................................132 Figure 5.10 : WebGIS architecture .......................................................................................................133 Figure 5.11 : Geoserver admin panel ..................................................................................................134 Figure 5.12: Initializing SUB METERS layer .....................................................................................135 Figure 5.13 : Map initialization .............................................................................................................135 Figure 5.14: The users interface ...........................................................................................................136 Figure 5.15: An example of popup window .....................................................................................137 Figure 5.16: Dynamic data for the clicked sensor ..........................................................................137 Figure 5.17: Compression between multiple sensors in CHEMISTRY sector .....................138 Figure 5.18: Statistics for the sensors of the CHEMISTRY sector ............................................139. viii © 2018 Tous droits réservés.. lilliad.univ-lille.fr.
(12) Thèse de Shayar Ali, Université de Lille, 2018. List of Tables Table 2.1 : Architecture proposed by City (Al-Hader and Rodzi 2009). ................................ 38 Table 2.2 : Architecture proposed by (Anthopoulos and Fitsilis 2010). ................................. 39 Table 2.3: Architecture proposed by (Lee et al., 2011). ................................................................ 40 Table 2.4: Architecture proposed by (Zygriaris, 2013). ................................................................ 41 Table 2.5: Architecture proposed by (Komninos, 2006)............................................................... 43 Table 2.6: Architecture proposed by Santander Smart City. ....................................................... 43 Table 2.7: Architecture proposed by (Wenge et al., 2014)........................................................... 44 Table 2.8: Architecture proposed by (Rathore et al., 2016) ........................................................ 44 Table 2.9: Functional and non-functional requirements for Smart City platforms ............ 51 Table 4.1: PLUG-IN section ....................................................................................................................... 81 Table 4.2: SETTING section ...................................................................................................................... 82 Table 4.3: Water meters static data table ........................................................................................... 86 Table 4.4: TWCP with (α = 1) (values are given in m3) ................................................................. 99 Table 4.5: TWCP with (α = 2) (values are given in m3).................................................................. 99 Table 4.6: TWCP after eliminating with (α = 1) ..............................................................................104 Table 4.7: TWCP after eliminating with (α = 2) ..............................................................................104 Table 4.8: TWCP with (α = 1) (values are given in m3)................................................................116 Table 4.9: TWCP with (α = 2) (values are given in m3)................................................................116 Table 4.10: TWCP after eliminating with (α = 1) ...........................................................................117 Table 4.11: TWCP after eliminating with (α = 2) ...........................................................................117. ix © 2018 Tous droits réservés.. lilliad.univ-lille.fr.
(13) Thèse de Shayar Ali, Université de Lille, 2018. List of Abbreviations AWS API AF AMR BCN BRS BRT CSS EPC EPIC GIS GBM GPS GCE HMVC HTML PHP HTTP ICT IT IaaS CICC IES ITS IADB ISMP ICU ITU IT LTA LTE MEL MVC MIMO NEA ODS OGC OSM OFDM PSE PaaS PUB RFID. Amazon Web Services Application Programming Interface Asset Framework Automatic Meter Reader Barcelona Bus Rapid System Bus Rapid Transit Cascading Style Sheets Electronic Police Center European Platform for Intelligent Cities Geographic Information System Global Balance Method Global Positioning System Google Compute Engine Hierarchical Model-View-Controller Hypertext Markup Language Hypertext Preprocessor Hypertext Transfer Protocol Information and Communication Technologies Information Technologies Infrastructure as a Service Integrated Command and Control Center Intelligent Energy System Intelligent Transportation System Inter-American Development Bank Integrated Service Management Platform Interface Configuration Utility International Telecommunication Union Internet of Things Land Transport Authority Long-Term Evolution Metropole Europenne de Lille Model-View-Controller Multiple Input Multiple Output National Environment Agency Open Data Soft Open Geospatial Consortium OpenStreetMap Orthogonal Frequency Division Multiplex PI System Explorer Platform as a Service Public Utilities Board Radio Frequency Identification x. © 2018 Tous droits réservés.. lilliad.univ-lille.fr.
(14) Thèse de Shayar Ali, Université de Lille, 2018. RTDM REST ORC SCDF SPF SBS SaaS SQL TWCP TMB USN UN UFL WCS WFS WMS WSNs. Real Time Data Monitoring Representational State Transfer Rio Operations Center Singapore Civil Defense Force Singapore Police Force Smart Bus System Software as a Service Structured Query Language Threshold Water Consumption Profile Transports Metropolitans de Barcelona Ubiquitous Sensor Network United Nations Universal File and Stream Loading Web Coverage Service Web Feature Service Web Map Service Wireless Sensor Networks. xi © 2018 Tous droits réservés.. lilliad.univ-lille.fr.
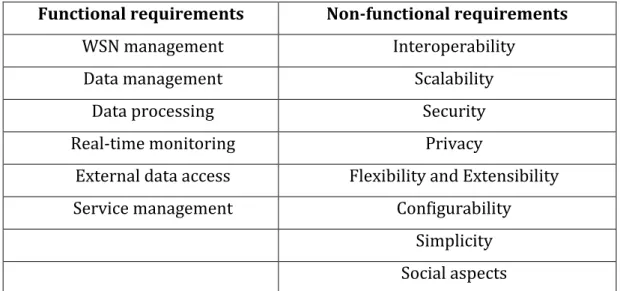
(15) Thèse de Shayar Ali, Université de Lille, 2018. General introduction Cities around the world already host around 50% of the world population – and by 2050 this proportion is expected to increase to 75%. The population is shifting from rural areas to cities in search of better life conditions. Due to rapid growth of the world’s population, cities are facing big challenges such as lack of natural resources, increase in energy and water consumption, increase in demand for social services and healthcare, and an increase in greenhouse gas emission, which is responsible for global warming and climate change. All of these challenges impact the quality of life in the City, which is a determinant factor in building a Happy City. Happiness in the city requires a high environmental quality (green space, public space, fresh air…), excellent urban services (mobility, education, health, culture, entertainment…) and involvement of citizens in the city governance. These challenges pushed cities to search for intelligent solutions to ensure a good quality of life for citizens. Fortunately, the Information and Communication technologies (ICT) could help cities to develop smart solutions, such as the Smart City solution, which uses both ICT and social innovations to achieve sustainability goals at optimal cost. Since this concept is new, cities need to learn more about it through large scale experimentations and pilot projects covering the various sides of the smart city such as (i) construction of urban information system including both assets and operating information of urban systems, (ii) smart monitoring of urban infrastructures, (iii) analysis of large amounts of data, including both historical and real-time data, (iv) optimal and secure management of urban infrastructures and (v) involvement of the city stakeholders in city governance. The management of urban infrastructures is crucial for the city development. It should ensure an optimal use of these urban and their interoperability. Infrastructures’ management requires a good knowledge of the infrastructures asset and operating performances. The concept of Smart City helps us to get this knowledge by attaching new technologies to the different networks in the infrastructure then building a comprehensive platform to manage both infrastructures asset and exploitation. This platform should meet functional requirements such as data management (collect, store, and analyze data) and real-time monitoring as well as non-functional requirements such as flexibility, scalability, security and privacy. The integration of the Geographic Information System (GIS) with the platform constitutes an excellent tool for an efficient management of the infrastructures. The construction of smart cities’ demonstrators and pilots is seen as a major element in the strategy of Smart Cities development around the world. In 2014, Singapore’s government established Smart Nation Vision that invented Singapore Smart City. The idea was to integrate ICT with the urban networks for better resource use and provide better life quality. The city developed then an integrated data sharing platform by finding rules and agreements for data integrating among different governmental agencies, which can access commonly shared information, collected from smart sensor networks. 1 © 2018 Tous droits réservés.. lilliad.univ-lille.fr.
(16) Thèse de Shayar Ali, Université de Lille, 2018. Other cities have lunched Smart City projects and platforms in the last few years such as SmartSantader project in Sanatander in Spain. The platform collects and processes data form 20,000 sensors including data about traffic conditions, CO2 emissions, etc. It helped to reduce the traffic jam and the gas emissions in the city. This research work aims firstly to implement professional management platforms for the management of SunRise Smart City project, which concerns the construction of a large scale demonstrator of the Smart City at the Scientific Campus of Lille University. The professional platforms PI system an OpenDataSoft were implemented and used. We will describe the implementation of these platforms and give a feedback about their use in this report. We have also developed a specific platform for the management of SunRise Smart City project. This platform meets the specific requirements of SunRise project, mainly simplicity and flexibility. This report presents the work conducted within my thesis. It includes five chapters. The first chapter includes a literature review. The review describes the city challenges and the concept of smart cities with its definitions and components. The final part of the chapter gives some examples of existing smart cities around the world and describes the services of each city. The second chapter describes the role of data in smart cities and the latest technologies used in data management. It describes also the existing architectures of smart cities. The final part of this chapter explains the existing smart city platforms and extracts the essential requirements for buildings a Smart City platform. The third chapter presents SunRise Smart City demonstrator. It describes the layers of the GIS model, which is created by the team of SunRise project. Chapter 4 presents the architecture of the two professional platforms PI System and OpenDataSoft as well as their implementation and use for the analysis of water consumption. Chapter 5 describes the architecture of the platform SunRise and details its layers. It presents also the stages of the platform development and implementation.. 2 © 2018 Tous droits réservés.. lilliad.univ-lille.fr.
(17) Thèse de Shayar Ali, Université de Lille, 2018. Chapter 1 Smart Cities: literature review. 3 © 2018 Tous droits réservés.. lilliad.univ-lille.fr.
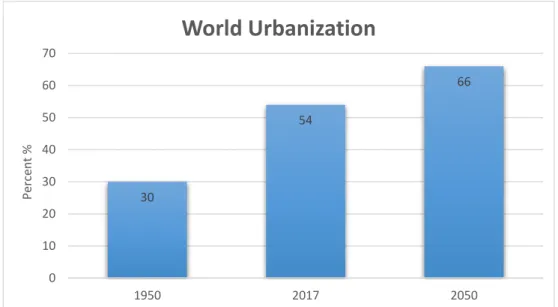
(18) Thèse de Shayar Ali, Université de Lille, 2018. Chapter 1 – Smart Cities state of the art This chapter presents the state-of-the-art concerning the Smart City. Big cities are facing challenges due to the rapid growth of population. There is lack of natural resources, increase in water consumption and air pollution. People need more services. Traditional solutions cannot handle these demands. Consequently, new intelligent solutions are needed to solve these problems. The first section presents the common challenges that facing cities. The second section presents the importance of finding smart solutions that raise the concept of smart cities. The third section presents case studies of smart cities.. 1.1 City Challenges The world’s population is increasing and it is estimated to be 8.6 billion by 2030 and will increase to 9.8 billion by 2050 and 11.2 billion by 2100 (Khatoun & Zeadally, 2016) Figure 1.1. In the 1950s, only 30% of the world’s population lived in cities; by 2014, the urbanization level had reached 54%. The United Nations predicts that by 2050, it will reach 66% Figure 1.2. People are shifting from rural areas to cities in search of better life. They want a high quality of life and optimal conditions for business creativity and professional development. They want efficient, sustainable transportation and energy systems that feed durable economic development. Since cities are not only hubs of human activity, but also the place where economic, environmental and societal demands are magnified. (United Nations & Department of Economic and Social Affairs, 2014).. World Population 13.2. 14 12 10.2. Billions. 10 8. 8.7 7.5. 6 4 2 0. 2017. 2030. 2050. 2100. Source : (United Nations and Department of Economic and Social Affairs, 2017). Figure 1.1: World's population estimation. The urbanization causes important economic, social and demographic transformations. The urbanization has greatly improved people’s standard of living, providing water supplies and sewerage systems, residential and office buildings, education and health services and convenient transportation networks (United Nations & Department of Economic and Social Affairs, 2014). 4 © 2018 Tous droits réservés.. lilliad.univ-lille.fr.
(19) Thèse de Shayar Ali, Université de Lille, 2018. But the rapid urban growth leads to complex challenges. Indeed, cities’ services and infrastructures are stretched to their limits in terms of scalability as they adapt to support the rapid population growth Figure 1.2. Traffic congestion, waste management, scarcity of resources, water and energy consumption, air pollution, human health concerns, and social problems are increasingly complex and intertwined (Khatoun & Zeadally, 2016).. World Urbanization 70 66. 60. Percent %. 50. 54. 40 30 30 20 10 0 1950. 2017. 2050. Source : (United Nations and Department of Economic and Social Affairs, 2017). Figure 1.2 : World's Urbanisation Estimation. 1.1.1. Transportation. The rapid urban growth over the last 50 years have placed a heavy load on cities transportation systems. Increasing population is leading to increase the number of vehicles, which increases traffic congestion and traditional roads construction is restricted by the land and cannot hold all these loads. Increasing traffic congestion not only delays the movement of people and delivery of goods but also contributes in exhaust emissions, and the deterioration of the air quality. In 2017, U.S. drivers wasted 46 hours in traffic, to be compared with 14 hours in 1982. The total amount of fuel wasted reached 3.9 billion gallons, which is equal to 130 days of flow in the Alaska Pipeline (IBM smarter city). In China, the average vehicle speed has been reduced to 20 km/h, even down to 7.5 km/h in some road sections (Xiong, Sheng, Rong, & Cooper, 2012).. 1.1.2. Waste Management. Solid waste management is one of the key challenges of the 21st century. It is one of the key responsibilities of a city government (United Nations Human Settlements Programme 2010). The rapid urban growth leads to large waste management problems for cities all over the world. Cities become centers of garbage production; the amount of created garbage is increasing faster than their population, according to a recent report from the World Bank. The management of waste is going through a critical phase, due to the 5 © 2018 Tous droits réservés.. lilliad.univ-lille.fr.
(20) Thèse de Shayar Ali, Université de Lille, 2018. unavailability of suitable facilities to treat and dispose of the larger amount of waste generated daily in metropolitan cities (Sharholy, Ahmad, Mahmood, & Trivedi, 2008). This is rapidly becoming an environmental and economic catastrophe for cities in many developing countries. Over the time, the waste generated by urban residents has nearly doubled, from 680 million tons per year to more than 1.3 billion tons per year and it’s expected to reach to 2.2 billion tons per year by 2025. This leads to high increase in the cost of waste management (Hoornweg & Bhada-Tata, 2012).. 1.1.3. Water and Energy Management. Water is fundamental for sustaining human life. Municipalities and local governments are facing serious crisis in the management of water: the consumption of water is increasing and the availability of fresh water is limited. Global water demand is projected to increase by 55%, due to growing demand from manufacturing (+400%), thermal electricity generation (+140%) and domestic use (+130%) (OECD 2012). As a result, city inhabitants and industries are increasingly competing with other water users for access to water resources. If not properly managed, this competition can have undesirable social, environmental and economic consequences. Cities are increasingly at risk of floods and droughts, especially because of increasing climate variability. Cities need to ensure the availability and quality of water for residents while also working to balance the needs of industry and agriculture. They need to address failing water infrastructure and manage overall complexity of water delivery and treatment. Water and energy are related to each other. In short, energy is needed to provide much of water people need, and water is needed to provide most of the energy we need and use (Cosgrove & Loucks, 2015). Limitations of either can constrain future economic and social development as well as negatively affect human and environmental health. Increasing the population leads to expansion increase in water and energy consumption. Buildings are among the biggest consumers of energy resources. They consume 42 percent of all electricity up to 50 percent of which is wasted. The U.S. Environmental Protection Agency (EPA) estimates the energy costs to 30% of the total operation costs. At the same time, buildings are the top contributors to global CO2 emissions.. 1.1.4. Human Services. One more big challenge for cities concerns the increase in demand for social services and healthcare, due to the significant growth of population. Citizens expect to find healthier environment for their families to live, access to the best healthcare services, more comfortable jobs, and more security. Cities are finding troubles to provide citizens with required environment and services. The demand of education, learning, and knowledge are increasing, schools and higher education systems have strained by the budget cuts. Cities need to provide citizens with comfortable jobs, while many jobs require updating 6 © 2018 Tous droits réservés.. lilliad.univ-lille.fr.
(21) Thèse de Shayar Ali, Université de Lille, 2018. of worker skills continually. Social services organizations are under more pressure than ever (Dirks, Gurdgiev, & Keeling, 2010). They need ways to integrate a huge amount of heterogeneous information, improve uniformity of services and reduce forgery, all while accommodating shrinking budgets.. 1.2 Need for Smart Solutions The current scenario requires cities to find ways to manage these challenges. Cities worldwide need new ways to sustain high service levels for citizens and businesses while improving efficiencies. They need to drive economic growth and create new opportunities while facilitating coordinated responses to crises, providing new transportation options, ensuring reliable delivery of energy and water, protecting residents from crime and improving the efficiency of buildings. At the same time, cities must educate residents for tomorrow’s challenges, help to sustain the health of citizens and achieve better outcomes for social services. Fortunately, city leaders today have capabilities that yesterday’s leaders could not have imagined. With the revolution of ICT, cities have the ability to collect, store and analyze data to improve the management and safety of their complex. They can understand the interaction between transportation, water and energy systems, and optimize their operations, individually or collectively. They can predict the impact of changes on the public safety system on adjacent systems, such as education, healthcare and social services. In doing so, they can make confident, informed decisions that will reduce costs and improve living conditions citywide. Many of the smart solutions related to urban services have been based on harnessing technologies, including ICT, helping to create what some call “Smart Cities” (Albino et al., 2015).. 1.2.1. Why Smart Cities?. Ensuring livable conditions within the context of such rapid urban population growth worldwide requires a deeper understanding of the Smart City concept. The urgency around these challenges that mentioned above are triggering many cities around the world to establish ingenious solutions to manage them using the Smart City concept (Chourabi et al. 2012). The concept of a Smart City is based on the use of technology to enhance performances, efficiency, and competitiveness by providing new ways of creating sustainable development and higher levels of life quality and better manage natural resources. Technology implemented in a Smart City can improve sustainability. It can provide an environmentally friendly transportation system in a city to reduce gas emissions; it can reduce energy consumption and increase its efficiency. While building, it leveraged Big Data, or ‘smart’ data, to reduce vibrations and noise, monitor cultural effects and resource consumption, reduce fuel costs and consumption, and distinguish the impact on air and 7 © 2018 Tous droits réservés.. lilliad.univ-lille.fr.
(22) Thèse de Shayar Ali, Université de Lille, 2018. water quality in nearby areas. A smart city could also do things such as measure water levels, average consumption and weather patterns — like a drought — to help its citizens better manage their supply. It could even track waste patterns to help citizens to optimize recycling and cut back on the amount of waste they use as a society. Both of these scenarios would require the Smart City to monitor activities and collect data.. 1.2.2. What is a Smart City?. Since several years, the concept of the “Smart City” has attracted world interest, including governments, companies, universities and institutes. Each organization has tried to understand and explain the Smart City concept from different viewpoints. The term “Smart City” appeared for the first time in the early 1990s (Albino, Berardi, & Dangelico, 2015). The concept of a ‘Smart City’ can seem elusive and vague. First of all because of the fact that there are many ways to be smart. Secondly, because there is a tendency to use the concept as a tool for self-promotion, rather than a strategy for actually becoming smarter. Indeed, it might prove easier to describe what the Smart City is not than coming up with an accurate definition of the concept. First, a city is not smart when there is too much of everything in it. An excess of cars, food, water, energy consumption etc. is the sign of an unsustainable city defined by inefficiency. Instead, the waste streams and the surplus of the city should be used as a valuable input in new production or as a source of energy. The waste of the city must be converted and used in sustainable ways. A Smart City turns its surplus into resources. Secondly, a city is not smart when the different networks are not able to communicate and function together. When the power grid, for instance, is not able to communicate with the electrical devices of the city, how can they know when it would be smartest to use electricity? Likewise, when the parking spaces of the city are not equipped with smart parking meters, how can car owners know where to go in order to find a parking space? Such a city has developed separate solutions to common problems. Thirdly, a city is not smart when the systems and networks, which it contains, are static and immobile. Having to wait in long lines of cars during rush hour is not smart. Instead, the mantra should be ‘fewer cars and more mobility’. Furthermore, a stagnant city is not just an inefficient city; its lack of flow impedes innovation and creativity among its many stakeholders. A Smart City is characterized by a high level of mobility allowing people, information, capital, and energy to flow together easily. Lastly, a city is not smart when it does not include all its stakeholders in the decision and planning process. Public authorities, private companies, knowledge institutions and the city’s inhabitants all possess valuable knowledge and information about the city. A city which does not make use of the vast amount of valuable data is made up of a number of disconnected ‘silos of knowledge’, which do not learn from and inspire one another. 8 © 2018 Tous droits réservés.. lilliad.univ-lille.fr.
(23) Thèse de Shayar Ali, Université de Lille, 2018. Instead, the Smart City is based on knowledge sharing and collaboration across all levels of society. It is an open source community, where the ideas of one actor can be borrowed, improved, and ultimately returned to the community by others. In the following section, we are going to present what is the difference between digital, intelligent, and smart city, then we are going through smart city definitions and components.. 1.2.3. Digital City, Intelligent City and Smart City. All different terms that have been invented refer to use of ICT to improve the performance of a city and its capabilities. Digital city, intelligent city and smart city are all slightly different concepts used to describe ICT-driven city. These differences reflects the evolution of strategy to improve the quality of city life (Yin et al. 2015). A digital city refers to the digitization of a city, involving networks, visualization and information technologies (IT) to access population, resource, environment, economic and social data (Li, Yao, Shao, & Wang, 2014). It combines communication and computing infrastructure to meet the needs of city services (Yovanof & Hazapis, 2009). The aim of a digital city is the sharing of information and networks (Ishida & Isbister, 2000). Chicago is a prime example of existing digital cities, which built its digital metropolis with large networks (Widmayer 1999). An intelligent city is defined as a city equipped with the infrastructure of ICTs. It can be considered to be a cross between a digital city and knowledge society (Moser 2001). An intelligent city is a city in which the systems are enhanced by digital collaboration spaces, interactive tools and embedded systems, the aim of an intelligent city is to transform the life of a city in significant and fundamental manners (Komninos 2012). From a technical perspective, a digital city describes the city’s characteristics; but from more complex viewpoint, a smart city includes the technology, human and governmental aspects, it can make intelligent response to different kinds of needs, including daily livelihood, public safety and city services, environmental protection, industrial and commercial activities. Therefore, a digital city is not necessarily smart, but a smart city must be digital first of all. A digital city is more focused on the technological basis and has clearer boundaries, whereas a smart city relates to both technology and sustainability (Yin et al. 2015). To summarize, the differences between the terms. A digital city is one whose procedures, communication and information have all been digitalized. An intelligent city is a digital city that has a layer of intelligence that can make high-level decisions based on a level of artificial intelligence. A smart city is an intelligent city where application is focused on practical use and user experience.. 9 © 2018 Tous droits réservés.. lilliad.univ-lille.fr.
(24) Thèse de Shayar Ali, Université de Lille, 2018. 1.2.4. Definitions of a Smart City. Various definitions have been given to the Smart City: “A city that monitors and integrates conditions of all of its critical infrastructures, including roads, bridges, tunnels, rails, subways, airports, seaports, communications, water, power, even major buildings, can better optimize its resources, plan its preventive maintenance activities, and monitor security aspects while maximizing services to its citizens”. (Hall et al. 2000) “A city well performing in a forward-looking way in economy, people, governance, mobility, environment, and living, built on the smart combination of endowments and activities of self-decisive, independent and aware citizens. Smart city generally refers to the search and identification of intelligent solutions which allow modern cities to enhance the quality of the services provided to citizens”. (Giffinger et al. 2007) “The Smart city is the use of Smart Computing technologies to make the critical infrastructure components and services of a city—which include city administration, education, healthcare, public safety, real estate, transportation, and utilities—more intelligent, interconnected, and efficient”. (Washburn et al. 2009) Smart city is defined by IBM as the use of information and communication technology to sense, analyze and integrate the key information of core systems in running cities. IBM 2010 “Smart cities will take advantage of communications and sensor capabilities sewn into the cities’ infrastructures to optimize electrical, transportation, and other logistical operations supporting daily life, thereby improving the quality of life for everyone”. (Chen 2010) “A city to be smart when investments in human and social capital and traditional (transport) and modern (ICT) communication infrastructure fuel sustainable economic growth and a high quality of life, with a wise management of natural resources, through participatory governance”. (Caragliu, Del Bo, and Nijkamp 2011) “[Smart Cities are about] leveraging interoperability within and across policy domains of the city (e.g. transportation, public safety, energy, education, healthcare and development). Smart City strategies require innovative ways of interacting with stakeholders, managing resources and providing services”. (Nam and Pardo 2011) “Smart city as a high-tech intensive and advanced city that connects people, information and city elements using new technologies in order to create a sustainable, greener city,. 10 © 2018 Tous droits réservés.. lilliad.univ-lille.fr.
(25) Thèse de Shayar Ali, Université de Lille, 2018. competitive and innovative commerce, and an increased life quality”. (Bakıcı, Almirall, and Wareham 2013) “A city which has certain smart ability to deal with a city’s problems and provides citizens with a better living environment through intelligent accumulation and analysis of different kinds of data from the city’s routine operation based on advanced information technologies”. (Wenge et al. 2014) “A smart City is a city where social and technological infrastructures and solutions facilitate and accelerate sustainable economic growth. This improves the quality of life in the city for everyone” (“Amsterdam Smart City”).. 1.2.5. Smart City Components. Smart infrastructure provides the foundation for all of the key themes related to a smart city, including smart people, smart mobility, smart economy, smart living, smart governance and smart environment. The core characteristic that underlies most of these components is that they are connected and that they generate data, which may be used intelligently to ensure the optimal use of resources and improve performance. This section introduces some key components of smart city infrastructure and concludes by highlighting the need for an integrated approach in dealing with such infrastructure Figure 1.3.. Figure 2.3 Smart city components. Figure 1.3 : Smart City components. 1.2.5.1. Smart Mobility. The best phrase, which describes methodologies that reduce traffic congestion, provide healthier and cheaper transportation options, and help to achieve sustainable mobility for 11 © 2018 Tous droits réservés.. lilliad.univ-lille.fr.
(26) Thèse de Shayar Ali, Université de Lille, 2018. society, is the Smart Mobility system. This smart system depends on ICT to collect data from various sources about transportation system in a city, in order to support the optimization of traffic stabilities (Benevolo, Dameri, and D’Auria 2016). Intelligent transport systems integrate the entire huge transit public and private mobility systems, that works together in order to improve the efficiency, effectiveness and environmental sustainability of cities. The Smart Mobility system includes all the initiatives carried out by companies or organizations supplying the local public transport service in the city. These initiatives normally involve a network of sensors, global positioning systemtracked public transportation, dynamic traffic lights, passenger information panels, automatic vehicle registration plate readers, closed-circuit television systems, navigation facilities, signaling systems, and most importantly, the capability of integrating live data from most of these sources. This can lead to improvements in safety, network management, traffic congestion, environmental performance, accessibility, convenience and public perception (UN 2016). They provide smart solutions such as the adoption of electric vehicles, which reduce gas emission, ridesharing (i.e., carpooling), which taps into an abundant yet underutilized resource: empty car seats. This option does not add any new vehicles to the system, and that is why it could help to reduce traffic congestion, that plagues most cities today. Bicycle commuting, which has been on the upswing in recent years, particularly in Europe and in cities with relatively flat terrain, miles of bike lanes, and other cycling infrastructure. For commutes of a few miles or less, biking is often the fastest way to get to work. Recently in Lille city, a new smart system of bike sharing is implemented, it is called “Gobee.bike”, the geo-location that allows each user to no longer be dependent on the "famous" terminals and thus have more flexibility to place the bicycle on a simple bicycle parking. Finish the usual twists and turns to find a terminal with available places. Gobee.bikes are available through a mobile app, allowing users to locate bikes nearby. Users will be able, once the choice made to unlock them via a unique QR Code. Once the journey has been made, the bicycles can be placed in a dedicated car park for this purpose and to officially terminate the lease the user will only have to manually lower a lock located on the rear wheel (Hamladji 2017). Car sharing, enabled by new technology that allows companies and individuals to rent cars by the minute or hour. On-demand ride services companies such as Uber and Lyft, which allow ordinary motorists to use their personal cars to offer planned transportation services. These services, enabled by mobile and GPS technologies, are making the taxi market more competitive (Viechnicki et al. 2015).. 1.2.5.2 Smart Environment One of the core concepts of smart cities is sustainability. Citizens will enjoy a quality of life, clean, green living environment. Smart environment can be achieved by implementing technologies in order to control natural resources, reduce waste and ensure an optimum usage of water, measure the consumption of energy, detect leakages, and increasing air quality (UN 2016). With embedded sensors, displays, and computing 12 © 2018 Tous droits réservés.. lilliad.univ-lille.fr.
(27) Thèse de Shayar Ali, Université de Lille, 2018. devices the awareness and habits of citizens can be changed. The European Parliament introduces two branches within Smart Environment. The first is related to urban utility networks “street lighting, waste management, drainage systems, and water resource systems that are monitored to evaluate the system, reduce pollution and improve water quality. The second is related to “renewables energy”, ICT enabled energy grids, metering, pollution control and monitoring, renovation of buildings and amenities, green buildings, green urban planning, resource use efficiency, reuse and resource substitution”. Smart Environment uses data from the utility networks, users and other city resources, in order to establish main areas of action in urban planning and city infrastructure planning as well as to inform urban services managers to achieve a more efficient and sustainable urban environment while improving the citizens’ quality of life (Monzon 2015).. 1.2.5.3 Smart Buildings People spend 80 to 90 percent of their lives in buildings, be it in homes, offices, recreation, retail, transport, or public service facilities (Honeywell 2015). A smart building integrates the different physical systems present in an intelligent way to ensure that all the systems act together in an optimized and efficient manner. It uses automated processes to automatically control the building’s operations including heating, ventilation, air conditioning, lighting, security and other systems. Smart building management systems can improve building energy efficiency, reduce waste and ensure an optimum usage of water, with operational effectiveness and occupant satisfaction. It is estimated that implementing smart building solutions could save as much as 30% of water usage and 40% of energy usage and reduce overall building maintenance costs by 10 to 30 percent.. 1.2.5.4. Smart Energy. Smart energy management systems use sensors, advanced meters, renewable energy sources, digital controls and analytic tools to automate, monitor and optimize energy distribution and usage. Such systems optimize grid operation and usage by balancing the needs of the different stockholders involved (consumers, producers and providers). There are a number of innovations in smart energy infrastructure, such as distributed renewable generation, micro grids, smart grid technologies, energy storage, automated demands response, virtual power plants and demand-side innovations such as electric vehicles and smart appliances. Such innovations provide extended network of intelligent energy devices across a city, with a detailed view of patterns of energy consumption, enabling community-based energy monitoring programs and improving the energy efficiency of buildings. A key component of smart energy infrastructure is smart grids. A smart gird may be defined as “electricity delivery system from point of generation to point of consumption integrated with ICT for enhanced grid operations, customer services and environmental benefits” (Mohanty, Choppali, and Kougianos 2016).. 13 © 2018 Tous droits réservés.. lilliad.univ-lille.fr.
(28) Thèse de Shayar Ali, Université de Lille, 2018. 1.2.5.5. Smart Water. A smart water management system uses digital technologies to save water, reduce costs and increase the reliability and transparency of water distribution. Physical pipe networks are overlaid the data and information networks. The system typically analyses available flow and pressure data to determine anomalies such as leakage in real time to better manage water flow. Customers may be provided real-time information on the water situation and relevant information to help conserve water, leading to lower water bills. For example, Mumbai, India, as part of improvements to the water supply system, has installed water meters that may be controlled remotely, leading to a 50 percent reduction in water leakage.(IBM 2011). 1.2.5.6. Smart Waste Management. Smart waste management includes monitoring, collection, transport, processing, recycling and disposal of waste. It reduces waste and categorizes type of waste at the source, and develop methods for the proper handling of waste. Such systems may be used to convert waste into a resource and create closed loop economies. Their primary benefits are in improvement efficiency of waste collection, pick up, separation, reuse and recycling. One of the primary inefficiencies of waste management is the inability to predict when waste is to be picked up; trucks are often sent to collect waste when bins are not full. Sensors, connectivity and the internet of things offer ways to mitigate additional costs arising from such inefficiency. Smart waste management enable movement of different kinds of waste to be monitored, and technology may be leveraged to better understand and manage the flow of waste from source to disposal (Hoornweg and Bhada-Tata 2012).. 1.2.5.7. Smart HealthCare. The health and well-being of urban residents are a particular concern with regards to the sustainability of urban areas and their supporting ecosystems. Smart cities can develop capacity to use technology such as Big Data to develop predictions or identify hotspots of population health. Smart healthcare management converts health-related data into clinical and business insights, which include digital health records, home health services and remote diagnoses, treatment and patient monitoring systems. It also facilitates the provision of healthcare using intelligent and networked technologies that help monitor the health conditions of citizens. It is enabling a shift in focus to prevention instead of cures, with a wider view of overall care, healthy living and wellness management. Smart health-care systems have a great potential in ageing societies, and may lessen inequality in healthcare between high and low-income groups. Examples of smart health approach include crowdsourcing to collect data on epidemics and predict epidemic outbreaks and take the necessary precautions, remotely collecting patient health vitals and data for diagnostic purposes and establishing automated alerts for patients with regards to medications and health check-ups. Telemedicine is a specific example of smart health 14 © 2018 Tous droits réservés.. lilliad.univ-lille.fr.
(29) Thèse de Shayar Ali, Université de Lille, 2018. care. Telemedicine can also be a subset of smart health care. Tele-medicine uses ICTs for providing clinical health care at a long distance or in remote locations. This approach is particularly useful for remote places in which health-care services are not easily accessible; telemedicine eliminates the distance barriers and improves access to medical care. Telemedicine is envisioned to provide critical care in emergency situations and can save lives in such critical situations. (Mohanty, Choppali, and Kougianos 2016).. 1.2.5.8. Smart Governance. Smart governance is about using technology to facilitate and support better planning and decision-making. The governance for smart cities must improve democratic processes, transparency in governance, citizen-centric development and political strategies for the cities. To achieve this, the government needs to gather information about citizens’ perceptions, demands, development priorities, grievances, and feedbacks about policies that are being developed or implemented. To involve the citizens in governance, governments should facilitate multiple ways to citizens to communicate. Social media platform empowers the citizens to use technology oriented common platform to communicate among themselves as well as with government. Smart cities call for new governance models. Effective smart city management needs to balance top-down and bottom-up governance approaches. On one hand, collating the information generated by smart sensors deployed in different smart infrastructures and taking policy actions, especially during emergencies, may require strong top-level leadership and top-down execution processes. On the other hand, bottom-up governance approaches, including citizen-driven innovations and co-creation, have been the defining the characteristic of much smart city infrastructure. Managing a good balance between these two approaches is therefore important. Achieving such a balance helps city governments harness the synergy between various participants such as universities, the private sector, civil society and local governments. Further, an efficient governance model for smart cities requires breaking down silos across different government departments. Information islands act as the greatest barrier to resource integration in the course of development, at both the technical and management level s of smart cities. Governance models need to be reformed in order that the data from smart infrastructure may be made available and used effectively in decision-making processes. City government administrators thus face the challenge of devising new forms of governance processes that adequately place citizen needs at the core of the governance process by adequately balancing top-down and bottom-up governance approaches (Nam and Pardo 2011).. 1.2.5.9. Smart Economy. In the European Parliament’s document “Mapping Smart Cities in the EU”, Smart Economy is understood as a mixture of “e-business and e-commerce, increased productivity, ICT15 © 2018 Tous droits réservés.. lilliad.univ-lille.fr.
Figure


+7


Documents relatifs
