Open Archive TOULOUSE Archive Ouverte (OATAO)
OATAO is an open access repository that collects the work of Toulouse researchers and makes it freely available over the web where possible.This is an author-deposited version published in : http://oatao.univ-toulouse.fr/ Eprints ID : 12647
Official URL: http://dx.doi.org/10.1007/978-3-642-40793-2_20
To cite this version : Martinie De Almeida, Celia and Palanque, Philippe and Pasquini, Alberto and Ragosta, Martina and Sujan, Mark-Alexander and Navarre, David Understanding functional resonance through a federation of models :
preliminary findings of an avionics case study. (2013) In: 32nd International
Conference on Computer Safety, Reliability and Security (SAFECOMP 2013), 24 September 2013 - 27 September 2013 (Toulouse, France).
Any correspondance concerning this service should be sent to the repository administrator: [email protected]
Understanding Functional Resonance
through a Federation of Models: Preliminary Findings
of an Avionics Case Study
Célia Martinie1, Philippe Palanque1, Martina Ragosta1,2, Mark Alexander Sujan3, David Navarre1, and Alberto Pasquini2
1 Institute of Research in Informatics of Toulouse (IRIT), University Paul Sabatier
118, route de Narbonne, 31062 Toulouse cedex 9, France
2
DeepBlue S.r.l Consulting and Research, Piazza Buenos Aires 20, 00198 Roma, Italy
3
Warwick Medical School, University of Warwick, Coventry CV4 7AL, UK {martinie,palanque,ragosta,navarre}@irit.fr, {martina.ragosta,alberto.pasquini}@dblue.it,
Abstract. FRAM has been proposed as a method for the analysis of complex socio-technical systems, which may be able to overcome the limitations of tra-ditional methods that focus on simple cause and effect relationships. FRAM on its own may be most useful for modeling the system at a high level of abstrac-tion. There is less evidence about its utility for modeling interactions at greater levels of detail. We applied different modeling approaches to investigate situa-tions that may give rise to functional resonance in an avionics case study. FRAM was used to model higher-level dependencies, HAMSTERS was used to provide a deeper understanding of human functions, and ICO-Petshop was used to model technical system functions. The paper describes preliminary results of the application of this federation of models, and highlights potential benefits as well as challenges that may have to be overcome.
Keywords: Modeling approaches, Avionics, Socio-technical systems.
1
Introduction
The causality of accidents in modern transportation systems may be difficult to determine. Investigations of past accidents and incidents have led to the development of improved system defences, which have significantly reduced the incidence of fatal accidents. When accidents occur they tend to exhibit complex causalities. Reason [1] referred to such accidents in modern well-defended systems as organizational accidents. These accidents are typically multi-faceted, and they may involve unexpected interactions or unforeseen propagation of failures [2].
In order to deal with the characteristics of modern transportation systems as well as other industrial safety-critical systems, paradigm changes to the existing safety engi-neering approaches have been proposed [3, 4]. Proponents of resilience engiengi-neering,
for example, have suggested regarding safety not simply as the absence of accidents, but rather as the ability to succeed under varying conditions [5].
The concept of functional resonance, developed within the resilience-engineering paradigm, describes accidents as the detectable “signal” that emerges from the unin-tended interaction of everyday variability. The Functional Resonance Analysis Me-thod (FRAM) [6] is a corresponding modeling approach that has been put forward as a novel way of modeling and understanding the behavior of complex systems. FRAM has been used in a number of contexts including air traffic management [7], railway traffic management [8], healthcare [9] and financial services [10].
The functional description used by FRAM may be particularly useful for describ-ing and analyzdescrib-ing systems at higher levels of abstraction. There is relatively little empirical evidence to demonstrate the application of FRAM to the detailed analysis of complex systems at different levels of abstraction. A possible strength of FRAM may be to make explicit the link between task-based and technical system descriptions, resulting in a federation of different modeling approaches.
The aim of this paper is to explore whether and how such a federation of different models can provide greater understanding of functional resonance in a real-world scenario. Section 2 provides a brief description of the avionics case study. Section 3 describes the learning generated through the application of FRAM. Sections 4 and 5, respectively, describe the learning generated from the application of a task-based modeling approach (HAMSTERS) and a petri-net based approach (ICO). Section 6 integrates and discusses the findings generated by this federation of models. Section 7 provides conclusions and suggestions for future research.
2
Weather Radar Interactive System
Weather radar (WXR) is an application currently deployed in many cockpits of commercial aircrafts. It provides support to pilots’ activities by increasing their awareness of meteorological phenomena during the flight journey, allowing them to determine if they may have to request a trajectory change, in order to avoid storms or precipitations for example. Annex 1 shows, on the cockpit of the Airbus A380, the distribution of various components dealing with weather radar.
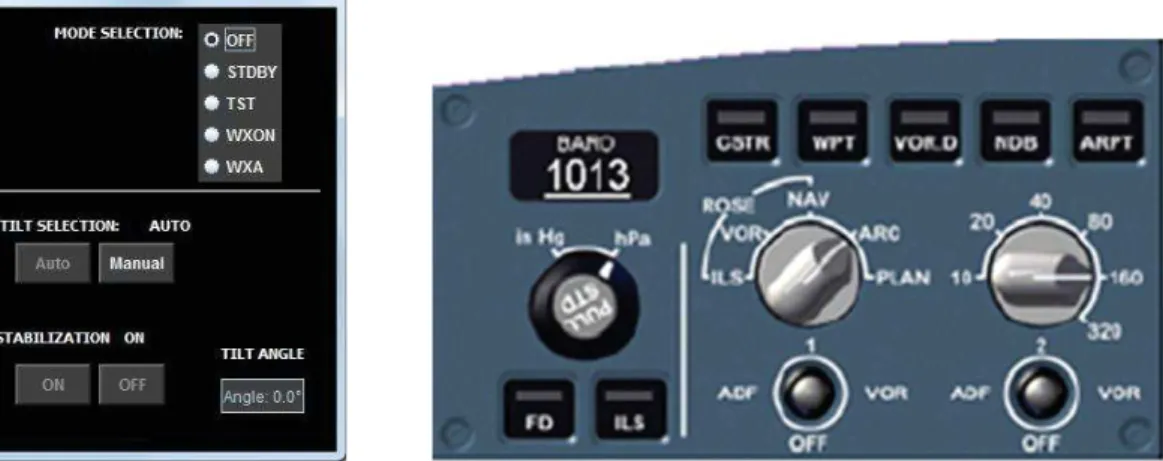
Fig. 1 presents a screenshot of the weather radar control panel, used to operate the weather radar application. This panel provides two functionalities to the crew. The first one is dedicated to the mode selection of weather radar and provides information about status of the radar, in order to ensure that the weather radar can be set up cor-rectly. The operation of changing from one mode to another can be performed in the upper part of the panel.
The second functionality, available in the lower part of the window, is dedicated to the adjustment of the weather radar orientation (Tilt angle). This can be done in an automatic way or manually (Auto/manual buttons). Additionally, a stabilization func-tion aims to keep the radar beam stable even in case of turbulences. The right-hand part of Fig. 1 presents an image of the controls used to configure radar display, partic-ularly to set up the range scale (right-hand side knob with ranges 20, 40, … nautical miles).
Fig. 1. Image of a) the weather radar control panel b) of the radar display manipulation
Fig. 2. Screenshot of weather radar displays
Fig. 2 shows screenshots of weather radar displays according to two different range scales (40 NM for the left display and 80 NM for the right display). Spots in the mid-dle of the images show the current position, importance and size of the clouds.
The next three sections describe the learning for safety analysis generated by using complementary modeling approaches combined as a federation of models.
3
Functional Representation - FRAM
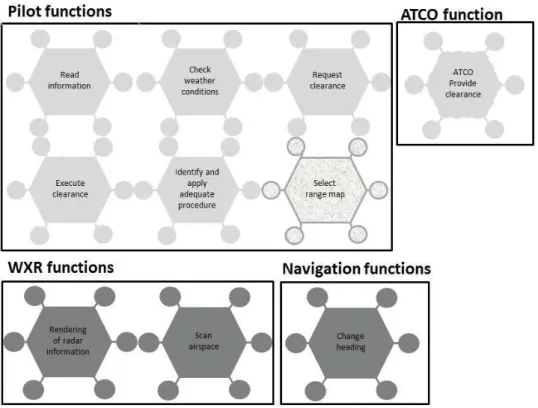
The safety analysis using FRAM is based on a functional representation of the system. Each function is described using six aspects - TROPIC (Time, Resource, Output, Precondition, Input, Control). The analysis using FRAM aims to investigate how the variability of the output of functions may propagate through the system, and how this propagation of variability may contribute to situations of functional resonance.
Fig. 3 graphically illustrates the functions identified for this case study. FRAM does not explicitly differentiate between the actors that perform a function. In the figure we have included an explicit representation of actors through the use of differ-ent levels of grey. Human functions are represdiffer-ented in light grey (continuous line for pilot functions while dotted for the air traffic controller). Functions performed by technical systems are represented in dark grey. Interactive functions are represented in medium grey. The functional description is hierarchical, so that functions can be
represented at higher levels of abstraction or with greater detail as required. For example, in Fig. 3 and Fig. 4 there is a function “Check weather conditions”, which is an abstraction of several lower-level functions (not represented in Fig. 3 above due to space constraints). This “macro” function includes system, human and interactive functions. Such an abstraction provides support for the representation of a larger number of functions while keeping the graphical model representation understandable.
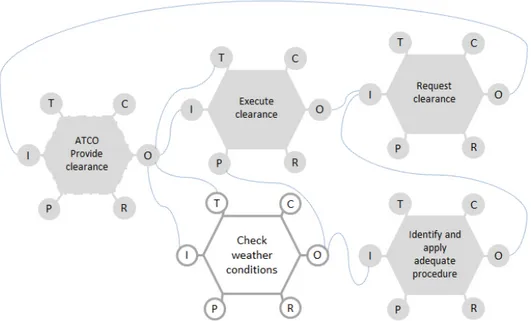
Fig. 3. Excerpt of FRAM functions for the weather radar socio-technical system The FRAM instantiation shown in Fig. 4 describes a scenario where the pilot rece-ives a clearance from the ATCO to change heading. The pilot checks the current weather situation and realizes that weather perturbations require a different route. Subsequently, the pilot requests a new clearance, which is eventually provided by the ATCO (who has to handle the impact of the refusal to implement the clearance on potential conflicts). In this scenario, the provision of the clearance also defines the timing parameter for executing the clearance, including checking the weather situa-tion. Prior to executing a clearance the crew should check the weather conditions hence the latter function is a precondition for the former.
This simplified FRAM representation allows us to reason about the propagation of variability. For example, the provision of the clearance could vary in terms of its timing aspect, i.e. it could be provided late (for instance according to complex con-flicts in the sector). In this case, there is less than adequate time available to execute the clearance. In such a situation, there may be a trade-off between efficiency and thoroughness in such a way that the weather check may be omitted (i.e. the precondi-tion between execute clearance and check weather condiprecondi-tions) in order to save time.
This would lead to an execution of the clearance, rather than to the more appropriate request for a new clearance.
The functions provide clearance and request clearance use a shared resource, i.e. the communication link, which typically has limited bandwidth. A variation in the availability of this resource will again have implications for the timing of the func-tions. So, the assessment based on the FRAM representation suggests that variability due to timing and resource aspects may lead to potentially hazardous situations. The limitation of this approach is that without further models of human and technological systems behaviors, it is very difficult to explore and explain this potentially hazardous situation further. The next two sections will describe examples of such complementa-ry modeling approaches that together may provide greater analytical power especially exhibiting quantitative information.
Fig. 4. FRAM instantiation (change heading clearance not feasible due to weather conditions)
4
Representing Operators’ Tasks Using HAMSTERS
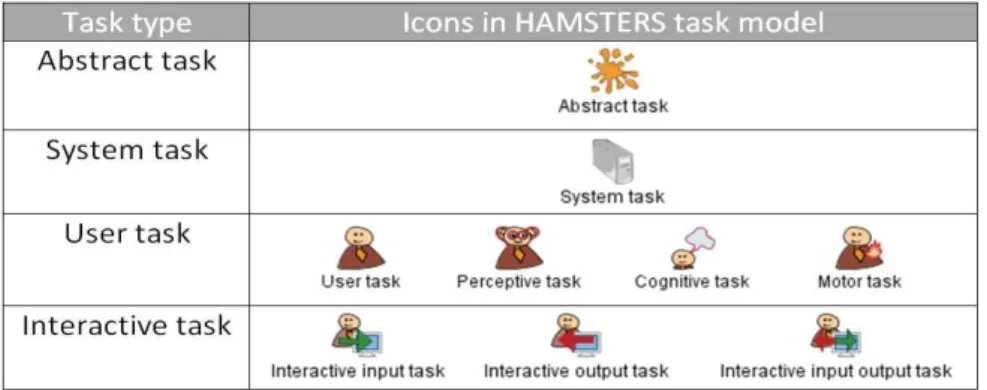
HAMSTERS1 is a tool-supported graphical task-modeling notation aiming at representing human activities in a hierarchical and ordered way. Goals can be decom-posed into sub-goals, which can in turn be decomdecom-posed into activities, and the output of this decomposition is a graphical tree of nodes. Nodes can be tasks or temporal operators.
Tasks can be of several types (as illustrated in Fig. 5) and contain information such as a name, information details, critical level… Only the high-level task type are pre-sented here (due to space constraints) but they are further refined (for instance the cognitive tasks can be refined in Analysis and Decision tasks [1]).
1
Fig. 5. High-level task types in HAMSTERS
Temporal operators are used to represent temporal relationships between sub-goals and between activities. Some of them are represented in the task models below. Main ones are >> for sequence, ||| for concurrent, [> for interruptions and [] for exclusive choice.
Tasks can also be tagged by temporal properties to indicate whether or not they are iterative, optional or both [1]. Composition and structuration mechanisms have been introduced in order to provide support for description of complex activities [11]. One main element of these mechanisms is subroutine. A subroutine is a group of activities that a user performs several times possibly in different contexts and which might ex-hibit different types of information flows. A subroutine can be represented as a task model and a task model can use a subroutine to refer to a set of activities. This ele-ment of notation enables the distribution of large amount of tasks across different task models and factorization of the number of tasks.
HAMSTERS also provides support for representing how particular objects (data, information, knowledge ...) are related to particular tasks.
Fig. 6 illustrates the three relationships (input, output or input/output) between ob-jects and tasks that can be expressed with HAMSTERS notation. Obob-jects may be needed as an input to accomplish a particular task (as illustrated in Fig. 6a) by the incoming arrow). Particular tasks may generate an object or modify it (as illustrated in Fig. 6b and 6c)). According to the case study, the pilot has two main goals: “Keep awareness of weather situation” which includes the sub-goal “Checking weather conditions” (Fig. 7) and “Change heading” (not detailed here but involved in the execution of the considered clearance).
The task model in Fig. 7 represents crew activities performed in order to check weather conditions. At the higher level of the tree, there is an iterative activity (circular arrow symbol) to “detect weather targets” that is interrupted (operator [>) by a cognitive task “mental model of current weather map is built”.
a) b) c)
Fig. 7. HAMSTERS task model of the “Check weather conditions” goal
Other human tasks include perception (task “Perceive image”) and motor (task “Turn knob”). Connection between crew’s activities and cockpit functions is made through interactive tasks (as input “Turn knob” and output “Rendering of radar infor-mation”). The time required for performing the latter heavily depends on the radar type. Such behavioral aspects of systems can be modeled using ICO notation and Pet-Shop tool as detailed in section 5. The task “Manage weather radar” is a subroutine task detailed in Fig. 8 and is performed after selecting a range and before analyzing the image produced by the weather radar. This task model corresponds to the manipulation of the user interface presented in Fig. 1 a). From these models we can see that the tasks to be performed in order to check weather conditions in a given direction are rather complex. The time required to perform them depends on 3 elements: the operator’s performance in terms of motor movements, perception and cognitive processing. Hu-man perforHu-mance models such as the one proposed in [12] can be used to assess diffi-culties and delays but the overall performance of the socio-technical system involves interaction and system execution times. Next section proposes a modeling approach for representing these two aspects while performance issues are presented in section 6.
5
Representing Technical Systems Using ICO Models
ICO [13] is used in this case study to model behavioral aspects of the system subpart of the interactive cockpit applications dealing with the weather radar. The following sections detail two models representing the interaction for controlling the weather radar parameters.
Mode Selection and Tilt Angle Setting
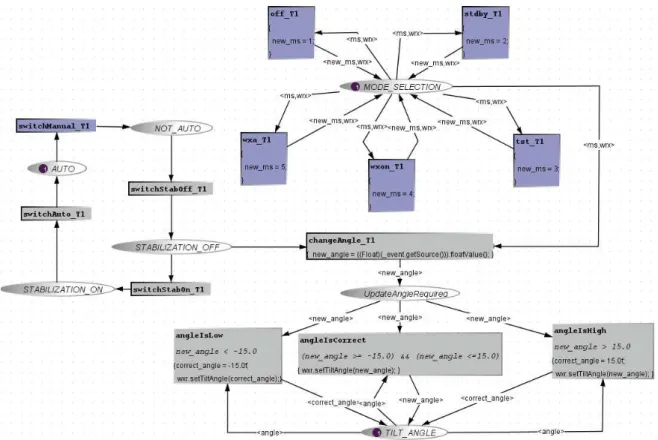
The first model presented here describes how it is possible to handle the weather radar configuration of both its mode and its tilt angle. Fig. 1 shows the interactive means provided to the user to:
• Switch between the five available modes (upper part of the figure) using radio buttons (the five modes being WXON to activate the weather radar detection, OFF to switch it off, TST to trigger a hardware checkup, STDBY to switch it on for test only and WXA to focus detection on alerts).
• Select the tilt angle control mode (lower part of the figure) amongst three modes (fully automatic, manual with automatic stabilization and manual selection of the tilt angle).
Fig. 9 presents the description of the behavior of this part of the interactive cockpit
using the ICO formal description technique and may be divided into two parts.
• The Petri net in the upper part handles events received from the 5 radio buttons. The current selection (an integer value from 1 to 5) is carried by the token stored in MODE_SELECTION place and corresponds to one the possible radio buttons (OFF, STDBY, TST, WXON, WXA). The token is modified by the transitions (new_ms = 3 for instance) using variables on the incoming and outgoing arcs as formal parame-ters of the transitions. Each time the mode value is changed, the equipment part (represented by the variable wxr within the token) is set up accordingly.
•
The Petri net in the lower part handles events from the four buttons and the textFig. 9. Behavior of the WRX mode selection and tilt angle setting
application. In the current state, this part of the application is in the state fully au-tomatic (a token is in AUTO place). To reach the state where the text field is avail-able for the angle modification, it is necessary to bring the token to the place STABILIZATION_OFF by successively fire the two transitions switchManual_T1 and switchStabOff_T1 (by using the two buttons MANUAL and OFF represented by Fig. 1), making transition change_Angle_T1 available. The selected angle must belong to the correct range (-15 to 15), controlled by the three transitions angleIs-Low, angleIsCorrect and angleIsHigh. When checked, the wxr equipment tilt angle is modified, represented by the method called wxr.setTiltangle.
Range Selection
The setting of the range detection of the weather radar is done using a FCU physical knob (see Fig. 1b) by switching between 6 values (from 1 to 6). Each time the value is set an event is raised (holding this value) by the knob and received by a dedicated part of the
cockpit application. This part of the application is represented by the model of Fig. 10 that maps the value (form 1 to 6) into a range value that is sent to the WRX equipment.
The event is received and the selected value is extracted by one of the two transitions called valueChanged_T1 and valueChanged_T2. The place RangeMapping contains the mapping between a value and the corresponding range (for instance 1 corresponds to range 10, 2 to 20…). Finally, the wxr equipment range is set with the selected range by the firing of transition mapIndexToRange.
6
Time and Performance Aspects
To allow performance assessment we have to address timing issues at three levels: the operator side using the task models presented in section 4, the system side exploiting the ICO behavior models in section 5, the interaction side related to the graphical interface described also in ICOs in section 5.
Operators’ Performance from Task Models
To qualitatively evaluate the performance of the weather radar graphical interface, we first restricted the study to the interaction with the weather radar control panel (see Fig. 1a), which is handled using a trackball (the other part being handled using the knob). One of the evaluation approaches used in human factors domain is based on Fitts’s law [14] which is suitable for assessing motor movements. Fitts’s law is pre-sented in Formula (1) representing an index of difficulty for reaching a target (of a given size) from a given distance. Movement time for a user to access a target depends on width of the target (W) and the distance between the start point of the pointer and the center of target (A).
MT = a + b log2(1+2A/W) (1)
For predicting movement time on the systems under consideration constants are set as follows: a=0 and b=100ms (mean value for users).
Fig. 11 presents the set of interactive widgets used within the weather radar control panel. For each widget, it provides a short name used for the following tables and the size used as the width for the Fitts’s law (we use the minimum value between the width and the height to provide the assessment of the maximum difficulty to reach the considered widget).
Fig. 12 provides the distances from the center to each widget and between each widget. These distances are used to apply the Fitts’s law when reaching a widget with a start point that can be the center of the control panel or any widget.
radio button off radio button stdby radio button tst radio button wxon radio button wxa button Auto button Manual button ON button OFF text field angle short name r1 r2 r3 r4 r5 b1 b2 b3 b4 t1 min size 18 18 18 18 18 31 31 31 31 26
Fig. 11. Interactive widgets width used for the Fitts’s law application
r1 r2 r3 r4 r5 b1 b2 b3 b4 t1 c 104 130 115 100 87 77 17 128 104 132 b)
r1 r2 r3 r4 r5 b1 b2 b3 b4 t1 c 110 119 114 108 103 77 32 97 89 105
Fig. 12. Distance from the control panel center a) Temporal values (in ms) for user interaction using Fitts’s b)
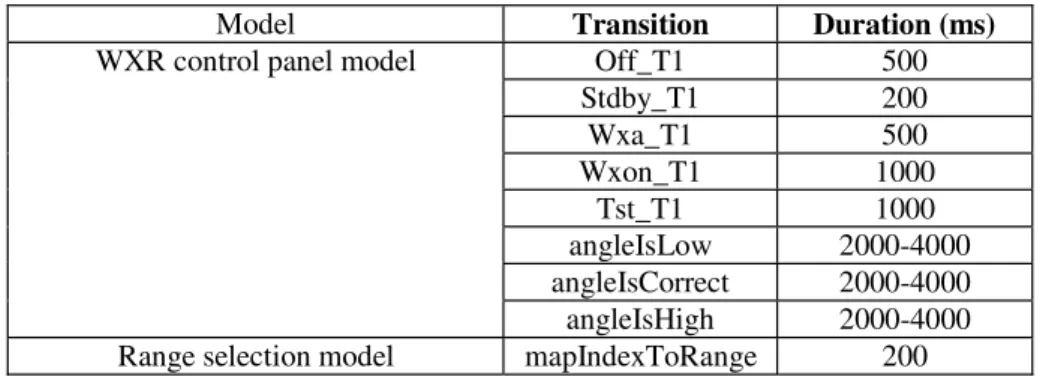
Model Transition Duration (ms)
WXR control panel model Off_T1 500
Stdby_T1 200 Wxa_T1 500 Wxon_T1 1000 Tst_T1 1000 angleIsLow 2000-4000 angleIsCorrect 2000-4000 angleIsHigh 2000-4000 Range selection model mapIndexToRange 200
Fig. 13. Delays introduced by interaction
In addition to these motor values cognitive and perceptive values have to be used in order to cover all the elements of the task models. From [12] we know that the mean time for performing a comparison at the cognitive level is 100ms (ranging from 25ms to 170ms) while eye perception mean is 100mn too (ranging from 50ms to 200ms).
Weather Radar System Time (Associated to ICO Models)
In the ICO Petri net dialect, time is directly related to transition, which invokes ser-vices from the weather radar system (this is the case for transition off_T1 on Fig. 9 which switches off the equipment). The duration of each invocation is presented on Fig 13 (each value is coarse grain and depends on the type of weather radar). The 2000-4000ms value corresponds to the time required by the weather radar to scan the airspace in front of the aircraft (two or three scans are needed to get a reliable image).
Using the task models in Fig. 7 and Fig. 8 and the values above we can estimate the overall performance of the crew to perform the “check weather condition” task. The over-all time cannot be less than 30 seconds provided that several ranges have to be checked in turn. Going back to FRAM model presented on Fig. 4 the function “check weather condi-tion” is a strong bottleneck and influences the entire socio technical system.
7
Conclusion
The paper outlined how a federation of three complementary modeling paradigms could be a useful approach in order to explore situations of functional resonance within socio-technical systems. FRAM provided a high-level view of possible dependencies in the system under consideration. These dependencies were then further explored using HAMSTERS for human activities, and ICO-Petshop for technical systems covering both interaction techniques on the user interfaces and the underlying hardware and software systems. The analysis presented in this paper represents a first step and the results are preliminary. A possible limitation of the approach is that there is no clear algorithm for how the three models can interact. At present, this relies on the skill of the analyst. This may pose problems in the analysis of large systems, where a greater level of tool support may be required for the analysis but it is important to note that most of the modeling activities are supported by tools and that performance evaluation techniques are partially available as for ICOs with Petri nets theory [15] and HAMSTERS with dedicated tools presented in [11]. Future research should investigate the generalizability of this case study to larger systems. The possibility of formalizing the interaction between the models at the different levels of analysis should be explored further. Lastly, variability and resonance
can also occur through system failure occurs or operators errors. We aim at integrating previous work we have done in the area of systems reconfiguration [16] and systematic account for human error using task models [17] to address variability for all the components of the socio-technical system.
Acknowledgements. This work is partly funded by Eurocontrol research network
HALA! on Higher Automation Levels in Aviation and SPAD project (System Performance under Automation Degradation).
References
1. Reason, J.: Managing the risks of organizational accidents. Ashgate (1997) 2. Perrow, C.: Normal Accidents. Basic Books (1984)
3. Leveson, N.: Engineering a safer world. MIT Press (2011)
4. Hollnagel, E., Woods, D.D., Leveson, N.: Resilience Engineering: Concepts and Precepts. Ashgate (2006)
5. Hollnagel, E.: Prologue: The Scope of Resilience Engineering. In: Hollnagel, E., et al. (eds.) Resilience Engineering in Practice. Ashgate (2010)
6. Hollnagel, E.: FRAM: The functional resonance analysis method for modelling complex socio-technical systems. Ashgate, Farnham (2012)
7. Herrera, I.A., Woltjer, R.: Comparing a multi-linear (STEP) and systemic (FRAM) method for accident analysis. Reliability Engineering & System Safety 95, 1269–1275 (2010) 8. Belmonte, F., Schön, W., Heurley, L., et al.: Interdisciplinary safety analysis of complex
so-cio-technical systems based on the functional resonance accident model: an application to railway traffic supervision. Reliability Engineering & System Safety 96, 237–249 (2011) 9. Sujan, M.-A., Felici, M.: Combining Failure Mode and Functional Resonance Analyses in
Healthcare Settings. In: Ortmeier, F., Lipaczewski, M. (eds.) SAFECOMP 2012. LNCS, vol. 7612, pp. 364–375. Springer, Heidelberg (2012)
10. Sundström, G.A., Hollnagel, E.: Governance and control of financial systems. A resilience engineering approach. Ashgate, Aldershot (2011)
11. Martinie, C., Palanque, P., Winckler, M.: Structuring and Composition Mechanisms to Address Scalability Issues in Task Models. In: Campos, P., Graham, N., Jorge, J., Nunes, N., Palanque, P., Winckler, M. (eds.) INTERACT 2011, Part III. LNCS, vol. 6948, pp. 589–609. Springer, Heidelberg (2011)
12. Card, S., Moran, T., Newell, A.: The Model Human Processor: An Engineering Model of Human Performance. In: Handbook of Perception and Human Performance, pp. 1–35 (1986) 13. Navarre, D., Palanque, P., Ladry, J.-F., Barboni, E.: ICOs: A model-based user interface
description technique dedicated to interactive systems addressing usability, reliability and scalability. ACM Trans. Comput.-Hum. Interact. 16(4), , Article 18, 56 pages (2009) 14. Fitts, P.M.: The information capacity of the human motor system in controlling the
ampli-tude of movement. Journal of Experimental Psychology 47, 381–391 (1954)
15. Ajmone Marsan, M., Balbo, G., Conte, C., Donatelli, S., Franceschinis, G.: Modelling with generalized stochastic Petri nets. Wiley (1995)
16. Navarre, D., Palanque, P., Basnyat, S.: A Formal Approach for User Interaction Reconfi-guration of Safety Critical Interactive Systems. In: Harrison, M.D., Sujan, M.-A. (eds.) SAFECOMP 2008. LNCS, vol. 5219, pp. 373–386. Springer, Heidelberg (2008)
17. Palanque, P., Basnyat, S.: Task Patterns for taking into account in an efficient and syste-matic way both standard and erroneous user behaviours. In: HESSD 2004 6th Int. Working Conference on Human Error, Safety and System Development, pp. 109–130 (2004)