Proceedings of the “Sixth European Symposium on Stratospheric Ozone”, Göteborg, Sweden, September 2-6, 2002, EUR 20650, ISBN 92-894-5484-9, pp. 309-312, 2003.
309
Tropospheric and Stratospheric Carbonyl Sulfide (OCS): Long-term
Trends and Seasonal Cycles above the Jungfraujoch Station.
E. Mahieu1, C.P. Rinsland2, R. Zander1, P. Duchatelet1, C. Servais1, 3 and M. De Mazière3.
1. Institute of Astrophysics and Geophysics of the University of Liège, B-4000 Liège, Belgium. 2. NASA-Langley Research Center (LaRC), Hampton, VA, USA.
3. Belgian Institute for Space Aeronomy (BIRA-IASB), B-1180, Belgium.
Introduction
Carbonyl sulfide is the most abundant sulfur bearing gas in the background troposphere with an average mixing ratio of about 500 pptv. It is released to the atmosphere by both natural and anthropogenic processes whose secular changes remain uncertain. Its atmospheric lifetime of 4 to 5 years allows it to reach the stratosphere where it is ultimately converted to sulfate particles (aerosol layer), which affect both the ozone depletion as well as the atmospheric radiation budget. It is therefore important to assess the evolution of OCS, not only in the troposphere but also in the stratosphere.
Long-term monitoring of the atmospheric composition conducted at the primary NDSC (Network for Detection of Stratospheric Change; see http://www.ndsc.ws) site of the international scientific station of the Jungfraujoch (ISSJ; 46.5ºN, 8.0ºE, 3580m asl) with Fourier transform infra-red (FTIR) spectrometers has allowed to record several thousand high-resolution solar spectra during nearly two decades. A reanalysis of such observations encompassing 3 spectral intervals suitable for OCS retrievals has been undertaken here, to characterize the burden and temporal evolution of that constituent in both the troposphere and the stratosphere.
Database and analysis method
4000 spectra recorded at ISSJ from 1988 to present have been considered in this investigation. Contrarily to previous studies that used the SFIT-1 algorithm to retrieve total column abundances [1, 2], calculations have been performed here with the SFIT-2 (version 3.7) code which allows to derive information on the vertical distribution of many atmospheric gases observable by FTIR instruments operated from the ground [3, 4]. It has been co-developed at the NASA-Langley Research Center (Hampton, VA, USA) and at the National Institute of Water and Atmospheric Research (Lauder, NZ) and is based on a semi-empirical implementation of the optimal estimation method of Rodgers [5].
SFIT-2 further allows to simultaneously fit several microwindows. We have adopted the 3 same spectral intervals (see Figure 1) as used in the recent analysis of the Kitt Peak time series [6]. The quality of the fits to the Jungfraujoch spectra can be appraised by looking at the residuals plotted above each microwindow.
Inputs to the fittings include: (i) spectroscopic parameters taken from the recent HITRAN 2000 database, with water vapor line parameter updates available from http://www.hitran.com; (ii) daily P,T-model atmospheres obtained from the National Centers for Environmental Prediction (NOAA, Washington D.C., USA); (iii) an a priori OCS vertical distribution calculated from ATMOS/ATLAS-3 Version 3 occultation measurements performed in the (46.5±5)ºN latitudinal band in November 1994 [7]; (iv) most realistic vertical distributions for interfering gases taken either from the so-called "refmod99" set distributed with SFIT, or from the ATMOS
Version 3 database (individual occultation measurements publicly available from
http://remus.jpl.nasa.gov/atmosversion3/atmosversion3.html).
Averaging kernels have been calculated taking into account the retrieval settings, instrumental performances, and assuming a signal-to-noise ratio of 250, over the 3.58-11 km and 11-100 km merged layers. They are similar to those displayed in Figure 1 of Rinsland et al. [6], showing maximum sensitivity around 7 and 20 km, thus allowing to distinguish between the tropospheric and stratospheric OCS contributions.
Proceedings of the “Sixth European Symposium on Stratospheric Ozone”, Göteborg, Sweden, September 2-6, 2002, EUR 20650, ISBN 92-894-5484-9, pp. 309-312, 2003.
310
Figure 1. Fitting example of the three selected OCS microwindows used in the present analysis. Target and
interfering gas absorptions are identified by arrows. Residuals (observed minus calculated signals) are displayed above each interval.
Main results and comparison with other recent findings
Figure 2 displays the OCS monthly mean time series derived from this analysis for the total, tropospheric and stratospheric column sets. In all cases, error bars correspond to standard deviations around the monthly means. By considering modeled layers ranging from 3.58 to 11 km, mean tropospheric OCS volume mixing ratios (vmr) have been calculated from the retrieved vertical distributions. A mean value of (520±15) pptv is found over the time period reported here.
Non parametric least square (NPLS) fits with sampling proportion of 20% and Gaussian weighting function have been calculated for each set; they are reproduced by thick black curves. They allow characterizing long- and mid-term evolutions of OCS above the site, with a larger decrease in the troposphere than in the stratosphere, and total columns being dominated by the tropospheric contributions. In order to determine the seasonal variation affecting OCS, the data sets have been further fitted using a function combining a sinusoidal and a third order polynomial component. Resulting curves are displayed in gray.
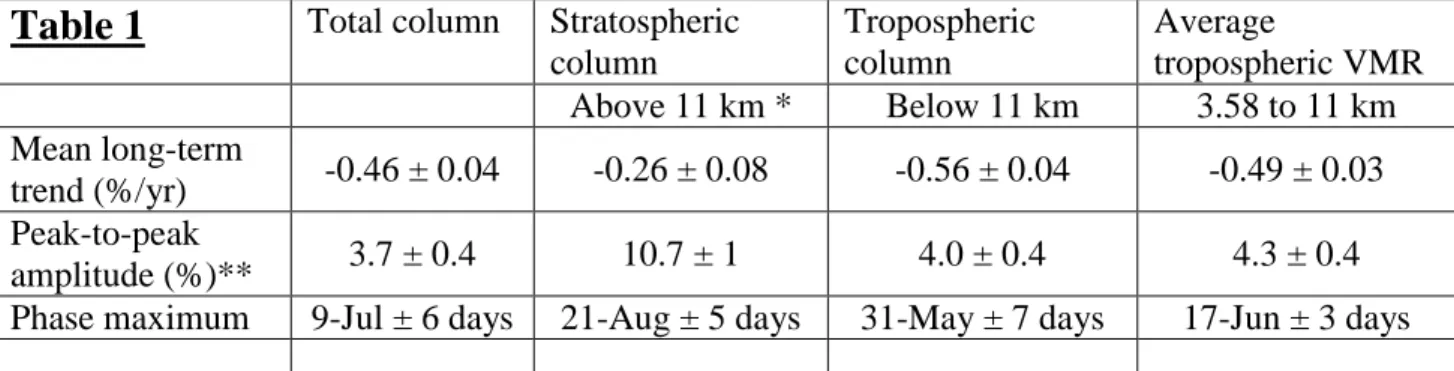
Table 1 summarizes relevant results derived from these fits, along with their associated 1-σ
uncertainties; it also gives the retrieved average long-term trends for the total, the stratospheric and the tropospheric columns of OCS, as well as its mean vmrs in the troposphere.
As already mentioned, all retrieved trends reported here show a slight but statistically significant decrease of OCS above the site, consistent with other recent findings. Rinsland et al. [6] have deduced a mean tropospheric trend of (-0.25 ± 0.04)%/yr from the analysis of solar absorption
Proceedings of the “Sixth European Symposium on Stratospheric Ozone”, Göteborg, Sweden, September 2-6, 2002, EUR 20650, ISBN 92-894-5484-9, pp. 309-312, 2003.
311
spectra recorded at Kitt Peak (AZ, USA; 31.9ºN) over 24 years. Long-term firn air measurements in the Arctic [8] also indicate a slow rate of decline of OCS equal to (-8±5)% over the 1990s.
Figure 2. From bottom to top: OCS monthly mean total, tropospheric and stratospheric partial column time
series. See text for a description of the functions used to characterize the various sets.
Literature also indicates that seasonal cycles of tropospheric OCS burden are characterized by peak-to-peak amplitudes ranging from 2.5% above Kitt Peak [6] to 18% above Wollongong (Australia, 34.5ºS) [9]. Intermediate values of about 4 to 6% are found at mid-latitudes, e.g., for the Jungfraujoch and Lauder (45.0ºS) [9]. In all cases, tropospheric burden maxima occur in summer while the amplitude of their seasonal cycle probably results mostly from the influence of local sources or sinks (vegetation, ocean, soils).
Proceedings of the “Sixth European Symposium on Stratospheric Ozone”, Göteborg, Sweden, September 2-6, 2002, EUR 20650, ISBN 92-894-5484-9, pp. 309-312, 2003.
312
Table 1
Total column Stratosphericcolumn Tropospheric column Average tropospheric VMR Above 11 km * Below 11 km 3.58 to 11 km Mean long-term trend (%/yr) -0.46 ± 0.04 -0.26 ± 0.08 -0.56 ± 0.04 -0.49 ± 0.03 Peak-to-peak amplitude (%)** 3.7 ± 0.4 10.7 ± 1 4.0 ± 0.4 4.3 ± 0.4
Phase maximum 9-Jul ± 6 days 21-Aug ± 5 days 31-May ± 7 days 17-Jun ± 3 days
* the 11 km altitude is close to the mean tropopause height above the Jungfraujoch (i.e. 11.35 km over the last decade)
** with respect to the 1990.0 column or VMR
Future work includes: (i) extension of the time series back to the first available high-resolution observations in 1984; (ii) better discrimination between the tropospheric and stratospheric components by using daily tropopause heights instead of a mean value, (iii) identification of the source(s)/sink(s) responsible for the OCS variations found in the present and other studies, with the help of model calculations/simulations.
Acknowledgment
Research performed at the University of Liège and at BIRA-IASB has been funded primarily through Belgian federal programs coordinated by the Office for Scientific, Technical and Cultural Affairs (OSTC) and by various projects supported by the EC-Research Directorate, both in Brussels. We thank all colleagues who have performed observations at the station and further acknowledge the Jungfraujoch Stiftungsrat for hosting the Liège laboratory.
[1] Rinsland, C. P., R. Zander, E. Mahieu, P. Demoulin, A. Goldman, D. H. Ehhalt, and J. Rudolph, Ground-based infrared measurements of carbonyl sulfide total column abundances: long-term trends and variability, J. Geophys. Res., 97, 5995-6002, 1992
[2] Mahieu E., R. Zander, L. Delbouille, P. Demoulin, G. Roland, and C. Servais, Observed Trends in Total Vertical Column Abundances of Atmospheric Gases from IR Solar Spectra Recorded at the Jungfraujoch, J. Atmos. Chem., 28, 227-243, 1997.
[3] Rinsland, C. P., N. B. Jones, B. J. Connor, J. A. Logan, N. S. Pougatchev, A. Goldman, F. J. Murcray, T. M. Stephen, A. S. Pine, R. Zander, E. Mahieu, and P. Demoulin, Northern and southern hemisphere ground-based infrared spectroscopic measurements of tropospheric carbon monoxide and ethane, J.
Geophys. Res., 103, 28,197-28,217, 1998.
[4] Duchatelet P., E. Mahieu, R. Zander, P. Demoulin, B. Barret and C.P. Rinsland, Updating the Jungfraujoch FTIR databases: current status, this volume.
[5] Rodgers, C. D., Characterization and error analysis of profiles retrieved from remote sounding measurements, J. Geophys. Res., 95, 5587-5595, 1990.
[6] Rinsland, C. P., A. Goldman, E. Mahieu, R. Zander, J. Notholt, N. B. Jones, D. W. T. Griffith, T. M. Stephen, and L. S. Chiou, Ground-Based Infrared Spectroscopic Measurements of Carbonyl Sulfide: Tropospheric Trends from a 24-Year Time Series of Solar Absorption Measurements, accepted for publication in J. Geophys. Res., 2002.
[7] Irion, F. W., M. R. Gunson, G. C. Toon, L. R. Brown, A. Y. Chang, A. Eldering, E. Mahieu, G. L. Manney, H. A. Michelsen, E. J. Moyer, M. J. Newchurch, G. B. Osterman, C. P. Rinsland, R. J. Salawitch, B. Sen, Y. L. Yun, and R. Zander, The Atmospheric Trace Molecule Spectroscopy Experiment (ATMOS) version 3 data retrievals, accepted for publication in Appl. Opt., 2002.
[8] Sturges, W. T., S. A. Penkett, J.-M. Barnola, J. Chappelaz, E. Atlas, and V. Stroud, A long-term measurement record of carbonyl sulfide (OCS) in two hemispheres from firn air measurements, Geophys.
Res. Lett., 28, 4095-4098, 2001.
[9] Griffith, D. W. T., N. B. Jones, and W. A. Matthews, Interhemispheric ratio and annual cycle of carbonyl sulfide (OCS) total column from ground-based solar FTIR spectra, J.Geophys.Res., 103, 8447-8454, 1998.