UNCORRECTED
PROOF
Science of the Total Environment xxx (2017) xxx-xxx
Contents lists available at ScienceDirect
Science of the Total Environment
journal homepage: www.elsevier.com
Annual cycle of dimethylsulfoniopropionate (DMSP) and dimethylsulfoxide
(DMSO) related to phytoplankton succession in the Southern North Sea
Gaëlle Speeckaert
a, b, Alberto V. Borges
b, Willy Champenois
b, Colin Royer
a, b, Nathalie Gypens
a,⁎ aÉcologie des Systèmes Aquatiques, Université Libre de Bruxelles, BelgiumbUnité d'Océanographie Chimique, Université de Liège, Belgium
A R T I C L E I N F O
Article history:
Received 10 October 2017
Received in revised form 30 November 2017 Accepted 30 November 2017 Available online xxx Editor: D. Barcelo Keywords: Dimethyl sulfide Dimethylsulfoniopropionate Dimethylsulfoxide Phytoplankton Phaeocystis North Sea A B S T R A C T
The influence of abiotic and biotic variables on the concentration of dimethyl sulfide (DMS), dimethylsulfo-niopropionate (DMSP), and dimethylsulfoxide (DMSO), were investigated during an annual cycle in 2016 in the Belgian Coastal Zone (BCZ, North Sea). We reported strong seasonal variations in the concentration of these compounds linked to the phytoplankton succession with high DMS(P,O) producers (mainly
Phaeocys-tis globosa) occurring in spring and low DMS(P,O) producers (various diatoms species) occurring in early
spring and autumn. Spatial gradients of DMS and DMSP were related to those of phytoplankton biomass itself related to the inputs of nutrients from the Scheldt estuary. However, the use of a relationship with Chloro-phyll-a (Chl-a) concentration is not sufficient to predict DMSP. Accounting for the phytoplankton composi-tion, two different DMSP versus Chl-a correlations could be established, one for diatoms and another one for
Phaeocystis colonies. We also reported high nearshore DMSO concentrations uncoupled to Chl-a and DMSP
concentrations but linked to high suspended particulate matter (SPM) presumably coming from the Scheldt estuary as indicated by the positive relationship between annual average SPM and salinity.
© 2017.
1. Introduction
Dimethylsulfoniopropionate (DMSP) and dimethylsulfoxide (DMSO) are sulfur (S) containing organic molecules produced by some species of phytoplankton, macroalgae and angiosperms (Keller et al., 1989; Hatton and Wilson, 2007; Borges and Champenois, 2017) and the primary precursors of dimethylsulfide (DMS). DMS emissions from the oceans play an important role in the global S cycle, con-tributing to approximately 40% of the biogenic S emissions (Wang et al., 2015) and could act on climate through the formation of at-mospheric aerosols and the modification of cloud albedo (Charlson et al., 1987). However, the significance of this feedback on climate re-mains uncertain (Quinn and Bates, 2011; Green and Hatton, 2014). DMS emissions depend directly on surface water DMS concentration which is regulated by marine microorganisms and abiotic processes such as photo-oxidation. When released in the water through exu-dation, lysis of senescent cells, grazing or viral attack, DMSP and DMSO are involved in a complex chain of phytoplanktonic and bac-terial processes leading, among others, to their transformation into DMS (Stefels et al., 2007). Although DMSP and DMSO are pro-duced by phytoplankton, correlating DMS production with phyto-plankton biomass (generally expressed in term of Chlorophyll a) is challenging (Kettle et al., 1999) because DMSP and DMSO produc-tion are species-specific and vary with environmental condiproduc-tions (e.g. Stefels et al., 2007). Therefore, DMS concentration in seawater is
⁎Corresponding author.
Email address: ngypens@ulb.ac.be (N. Gypens)
controlled mainly by phytoplankton composition rather than by algal biomass or production (Masotti et al., 2010).
Since the compilation of DMSP content by 123 phytoplankton species by Keller et al. (1989), we know that Dinophyceae and Hap-tophyceae are the major DMSP producers and diatoms lower DMSP producers with a few exceptions. Similarly, the biogenic production of DMSO is specific and generally correlated to DMSP production (Hatton and Wilson, 2007). There are different sources of specific variability in DMSP and DMSO production including growth stage, salinity, temperature, nutrient limitation and light related to several potential physiological functions of these molecules as osmoregulator (Vairavamurthy et al., 1985), cryoprotectant (Kirst et al., 1991), an-tioxidant (Sunda et al., 2002), methyl donor (Kiene et al., 2000), graz-ing deterrent (Wolfe et al., 1997) and overflow mechanism in nitro-gen-limiting conditions (Stefels, 2000). DMSP is also a source of car-bon (C) and S for heterotrophic organisms (Kiene and Linn, 2000a) and acts as a chemical cue for higher trophic level organisms (Steinke et al., 2002). These physiological functions are not necessarily exclu-sive (Harada and Kiene, 2011) and phytoplankton cells may use sev-eral of them.
In the Belgian Coastal Zone (BCZ) of the North Sea, the phyto-plankton succession is characterized by a first diatom bloom in late February-early March, followed by a huge biomass peak of
Phaeocys-tis globosa in April–May before summer and autumn diatom blooms
(Lancelot et al., 2005) The prymnesiophyte Phaeocystis globosa (re-ferred hereafter as Phaeocystis) forms extensive blooms represent-ing 95% of the phytoplankton sprrepresent-ing community biomass (Rousseau et al., 1990, 2000) and their colonies are estimated as responsible for around 80% of the total annual DMSP production in
https://doi.org/10.1016/j.scitotenv.2017.11.359 0048-9697/© 2017.
UNCORRECTED
PROOF
this zone (Gypens et al., 2014). The area is a permanently well-mixedand eutrophied coastal zone under the influence of the Scheldt and the Rhine rivers. The modification of C and nutrient river loads to the BCZ observed since the 1950's led to important changes of primary production, phytoplankton dominance, and CO2, CH4and DMS
con-centrations and emissions (Gypens et al., 2009; Gypens and Borges, 2014; Borges et al., 2017).
Seasonal variations DMSP and DMS have been previously stud-ied in the Southern North Sea (SNS) based on field measurements and model applications (Turner et al., 1988; Kwint and Kramer, 1996; van den Berg et al., 1996; Stefels et al., 1995; van Duyl et al., 1998; Archer et al., 2002; Gypens et al., 2014). All of these studies re-ported a marked seasonal cycle in DMS(P) with a maximum in spring (April–May) corresponding to the Phaeocystis bloom followed by a decrease to low winter values. Generally, particulate DMSP (DMSPp) (the intracellular DMSP) represents the main part of the total DMSP (DMSPt) measured in the field, the dissolved DMSP (DMSPd) being quickly consumed or transformed into DMS, DMSO or others degra-dation products. In the Wadden Sea, van Duyl et al. (1998) measured concentration of DMSPp of about 1650 nmol L− 1, and found a sig-nificant correlation between DMSPp and the abundance of
Phaeocys-tis cells. Turner et al. (1996) reported maximal values of DMSPp and
DMS in the SNS of respectively 450 nmol L− 1 and 25 nmol L− 1in May with large concentration gradients over short distances. In the SNS, Liss et al. (1994) have also reported DMS concentrations be-tween 3 and 49 nmol L− 1during the Phaeocystis bloom. In the BCZ,
the maximal DMSPp, DMSPd and DMS concentrations simulated by Gypens et al. (2014) respectively reached 580, 210 and 28 nmol L− 1 during the Phaeocystis bloom. DMS fluxes follow the patterns of DMS concentrations and are highest closest to the coast and between May and July (Turner et al., 1996; Gypens et al., 2014).
Only a few studies focused on DMSO concentrations in the North Sea because of the later evidence of the existence of particulate DMSO (DMSOp) until recent years (Simó et al., 1998) and its impor-tance for the S cycle (Hatton et al., 2004; Green and Hatton, 2014). Unlike DMS and DMSP that are usually restricted to the euphotic zone, DMSO is ubiquitous and dominant throughout the water col-umn (Hatton et al., 2004). As DMSOp production is also taxon-spe-cific and limited to the same taxons that produce DMSPp (Simó and Vila-Costa, 2006), DMSOp peaks are concomitant or follow those of DMSPp (Hatton and Wilson, 2007). Similarly, a strong relation-ship exists between DMS and DMSO in surface waters (Hatton et al., 1996, 2004) but no correlation has been found between DMSOp and DMSOd (Hatton and Wilson, 2007); the latter being often greater than DMSOp and DMSPd, because it passively diffuses across cel-lular membranes unlike DMSP. DMSOd also originates from photo-chemical and microbial oxidation of DMS (Hatton, 2002).
The current study presents the annual cycle of DMSP, DMSO and DMS concentrations measured in the BCZ on a regular grid of fixed stations during the year 2016. The study site is characterized by a high variability in abiotic parameters (salinity, temperature and light), and primary production throughout the year and by a similar phytoplank-ton taxonomic succession from one year to another (Rousseau et al., 2002). In order to improve understanding of biotic and abiotic con-trols on DMS(P,O) distribution in the area, the present study aims to: (1) determine the extent and patterns of spatial and seasonal varia-tions in DMSP, DMSO and DMS concentravaria-tions related to changing physico-chemical environmental conditions; (2) determine how these concentrations vary in function of phytoplankton abundance and di-versity; and (3) compare DMSP cellular content measured in seawa
ter and in laboratory cultures for key-species of the studied phyto-plankton succession.
2. Material and methods
2.1. Field sampling
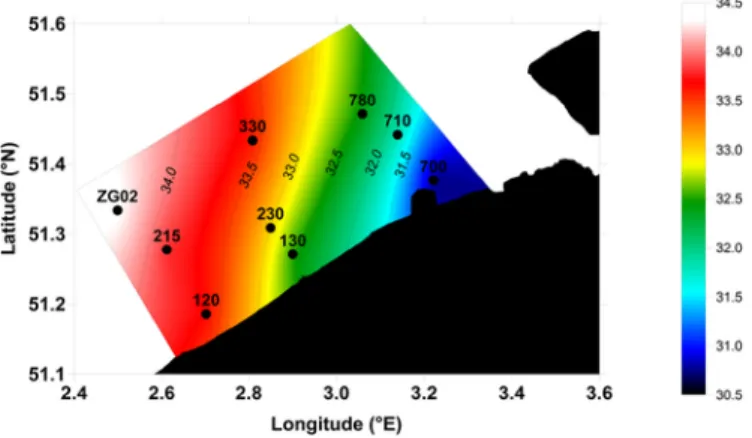
Annual monitoring of a range of physical, chemical and biologi-cal parameters was carried out at nine fixed stations regularly sampled as part of national water quality monitoring programs by the VLIZ (Vlaams Instituut voor de Zee) and located along three nearshore-off-shore transects covering the BCZ (Fig. 1). Samples were collected be-tween January and December 2016, bi-monthly during spring-sum-mer phytoplankton blooms (mid-February to end of June) and monthly during the rest of the year on the RV Simon Stevin. Single sam-ples were carried out at 3 m depth with a 4 L Niskin bottle con-nected to a conductivity-temperature-depth (CTD) probe (Sea-bird SBE25) for further analysis of phytoplankton diversity and abun-dance, Chlorophyll a (Chl-a) and DMS(P,O) concentrations. Salinity, temperature and nutrient data were retrieved from the data collected at the same stations and during the same cruises by the VLIZ in the frame of the LifeWatch sampling campaigns (http://rshiny.lifewatch. be/Station%20data/) (VLIZ, 2017). The surface incident Photosyn-thetic Active Radiation (PAR) was calculated from the daily global solar radiation data collected at the Oostende station of the Royal Me-teorological Institute of Belgium.
2.2. Phytoplankton laboratory cultures
Eight phytoplankton species (Asterionella glacialis, Chaetoceros
debilis, Chaetoceros socialis, Nitzschia closterium, Rhizosolenia del-icatula, Thalassiosira rotula, Skeletonema costatum and the
prymne-siophyte Phaeocystis globosa) isolated from seawater samples taken during summer 2013 in the BCZ were put in batch culture under con-trolled laboratory conditions. All species were grown in 1 or 2 L batch cultures maintained at 12 °C on a 12:12 dark:light cycle, at a pho-ton flux density of 100 μmol quanta m− 2s− 1supplied by cool-white fluorescent lights. Irradiances were determined with a Heinz Walz US-SQS/A light sensor. The seawater was filtered through a 0.2 μm Whatman cellulose acetate filter and sterilized by autoclaving to pre-vent bacterial contamination. All culture transfers and inoculations were performed in a Clean Air laminar flow hood using standard sterile techniques to maintain axenicity. Culture medium was pre-pared with filtered seawater enriched with nitrate, ammonium and phosphate concentrations of respectively 50, 25 and 5 μmol L− 1
UNCORRECTED
PROOF
(Rousseau et al., 1990) or using K medium (A. glacialis, R. delicatulaand T. rotula) (Keller et al., 1987). Cultures were monitored daily by measuring cell density and Chl-a-relative in vivo fluorescence (with a Turner Aquafluor handheld fluorometer). Samples were then col-lected in mid-exponential growth phase and stored for further analysis of Chl-a, cell density and DMS(P,O) concentration.
2.3. Phytoplankton composition and biomass
Samples for Chl-a measurement (100 to 1400 mL) were gently fil-tered onto glass-fiber filters (GF/F) and extracted in 90% acetone, be-fore applying the fluorometric method of Holm-Hansen et al. (1965) with a Kontron SFM25 fluorimeter. Samples were also fixed with a lu-gol-glutaraldehyde (1% vol–vol final concentration) and stored at 4 °C for species identification and cell density measurements by inverted microscopy. Cell density was measured using the Utermöhl method (Hasle, 1978). For Phaeocystis samples, colonies were broken by agi-tation prior to cell counting. We measured cells linear dimensions for each species identified and assigned it a geometric shape (Hillebrand et al., 1999), from which we calculated specific biovolumes. We con-verted these biovolumes into specific C biomass using the equations from Menden-Deuer and Lessard (2000).
2.4. DMS(P,O) analysis
Particulate, dissolved and total DMSP were measured for both field and culture samples. Total DMSO was measured for five stations of field sampling (stations 700, 130, 230, 330 and ZG02 on Fig. 1). Samples for DMSP and DMSO were stabilized in acid-cleaned and muffled borosilicate vials by addition of H2SO4(50%) for later
analy-sis with a gas chromatograph (GC). DMSPd analyses were done on filtered samples, DMSPp analyses on muffled 25 mm GF/F filters and total DMSP and DMSO on unfiltered samples. We adopted the small volume gravity drip filtration procedure recommended by Kiene and Slezak (2006). Gentle filtration of maximum 20 ml was used, only the first 10 ml of filtrate were collected. Additionally, samples for DMS (30 ml) were taken during field sampling and immediately stored in a cold room in acid-cleaned and muffled borosilicate vials sealed with gas tight polytetrafluoroethylene (PTFE) coated silicone septa.
DMSP concentrations were analyzed by GC coupled with a purge-and-trap after alkaline hydrolysis to DMS (Stefels, 2009). Prior to the addition of NaOH, samples were sparged with compressed air, to remove residual dissolved DMS. Concentrations of total DMSO (DMSOt) were analyzed after total DMSP (DMSPt) in the same field samples after acidification and reduction of DMSO into DMS using the TiCl3method (Kiene and Gerard, 1994).
We used an Agilent 7890B GC equipped with a Flame Ionization Detector (FID) and a Flame Photomultiplier Detector (FPD). The car-rier gas (He, 2 ml min− 1) was split between the two detectors (~ 30% for FID, ~ 70% for FPD). The FID was kept at 325 °C with a H2flow
of 57 ml min− 1, a synthetic air flow of 500 ml min− 1and a makeup (N2) flow of 5 ml min− 1. The FPD was kept at 350 °C with a H2flow
of 72 ml min− 1, a synthetic air flow of 72 ml min− 1 and a makeup (N2) flow of 20 ml min− 1. The capillary column was kept at 60 °C.
A primary DMSP stock solution with a concentration in the range of 10− 3mol L− 1was prepared from a pure DMSP standard (Research Plus) and working solutions with concentrations in the range of 10− 6 or 10− 7mol L− 1were prepared successively by dilution in Milli-Q
water. The same procedure was applied for DMSO and DMS from a 99.9% pure stock solution (Merck) to obtain working solutions of 10− 7–10− 8mol L− 1and 10− 5–10− 7mol L− 1respectively. Six stan
dards for DMSP, DMSO and DMS were made from these working so-lutions with concentrations from 0.5 to 300 nmol L− 1for the FPD and
from 200 nmol L− 1to 9000 nmol L− 1for the FID in 20 ml serum vials sealed with gas tight PTFE coated silicone septa. Calibration curves were made weekly for the two detectors (or only one depending on ex-pected sample concentrations) by fitting a polynomial curve or a lin-ear regression line for the FPD or FID, respectively. As for samples, standards were analyzed for DMSP prior to DMSO in the same vials. The coefficient of variation was < 10% between standards. NaOH pel-lets were added the day before DMSP analysis in standards and sam-ples (at least 12 h prior to analysis). Immediately after DMSP analy-sis, standards and samples were acidified by addition of 2 ml of fum-ing HCl and 1 ml of TiCl3was added before 48 h of DMSO reduction
at room temperature. Before DMSO analysis, standards and samples were neutralized by addition of 1 ml of NaOH 12 M in order to avoid injecting acid fumes into the GC.
2.5. Statistical analyses
We performed multiple linear regression analyses to assess the ef-fect of biotic and abiotic variables on DMSP and DMSO concen-trations. Sea surface salinity (SSS), sea surface temperature (SST), Chl-a, suspended particulate matter (SPM) and phosphate (PO4) were
tested as predictor variables. A set of 55 data (for which all predic-tor variables data were available) from the nine monipredic-toring sites cov-ering the whole year was used. A multi-collinearity test was carried out giving Variance Inflation Factor of maximum 2.5, under the stan-dard limit value of 10 (Miles, 2014). A Breusch-Pagan test was per-formed that confirm the homoscedasticity of residuals (LM < LM-crit; p-value = 0.133; alpha = 0.05). However, we had to reject the null hypothesis that the residuals are normally distributed according to Shapiro-Wilk (W < Wcrit; p < 0.0001; alpha = 0.05) and Lilliefors tests (D < Dcrit; p = 0.009; alpha = 0.05). As our variables contain > 40 data points (Pallant, 2007), we assumed that our regression was still robust despite this violation from the assumptions (Elliott and Woodward, 2007).
3. Results and discussion
3.1. Seasonal and spatial evolution of abiotic parameters
Daily averaged PAR showed typical seasonal variability with win-ter values around 70 μE m− 2s− 1 and maximal values around 710 μE m− 2s− 1in summer (Fig. 2a). SST averaged for the nine sam-pled stations in the BCZ showed a clear seasonal pattern with values varying between 6.9 °C in winter and 19.8 °C in summer with low spatial variability (Fig. 2b). Average SSS for the nine sampled sta-tions varied between 31.3 and 33.9 along the seasonal cycle with max-imal values in winter and minmax-imal values in late spring-early sum-mer (Fig. 2c). Spatial distribution of SSS was characterized by a gen-eral increase from near-shore to offshore stations with annual aver-aged salinity varying from 30.7 in most coastal station (700) and 34.9 in most offshore station (ZG02) (Fig. 1).
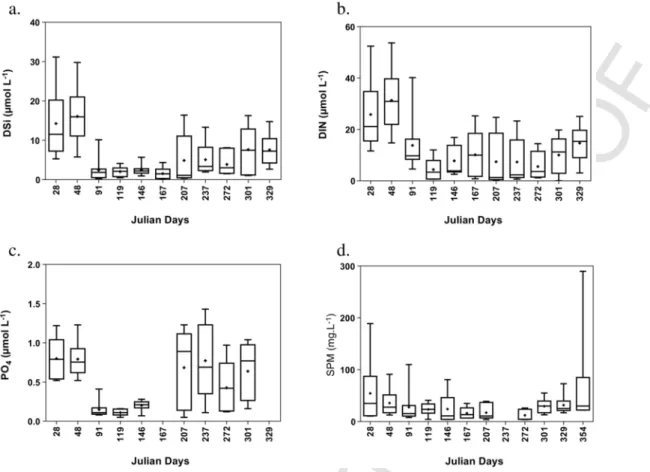
Nutrients and SPM varied broadly over space and time (Fig. 3). Spatially averaged dissolved silica (DSi) (Fig. 3a) and dissolved inor-ganic nitrogen (DIN) (Fig. 3b) reached their highest concentrations in winter (mid-February) and lowest values in spring due to phytoplank-ton uptake (Rousseau et al., 2006). Spatial variability of DIN and DSi concentration was particularly marked in winter with the highest dif-ferences between minimal and maximal values (Fig. 3a, b). In sum-mer, nutrient concentrations showed different patterns depending on the location, with a strong divergence between median and average
UNCORRECTED
PROOF
Fig. 2. Seasonal evolution of (a) daily-averaged Photosynthetic Active Radiation
(PAR), (b) sea surface temperature (SST) and (c) salinity averaged for the nine stations (refer to Fig. 1) sampled in the Belgian Coastal Zone in 2016.
values. The seasonal evolution of spatially averaged PO4showed
sim-ilar patterns with maximal concentration in winter and minimal con-centration in spring (Fig. 3c). Summer PO4values were similar to the
winter ones but showed larger spatial variability as indicated by the min-max difference (Fig. 3c). Average SPM varied from highest val-ues in winter and lowest valval-ues in summer (Fig. 3d). In winter, the spatial gradients of SPM were stronger as indicated by the high range of min-max values (Fig. 3d). The highest SPM concentrations were observed in January (190 mg L− 1) and December 2016 (290 mg L− 1)
at station 700.
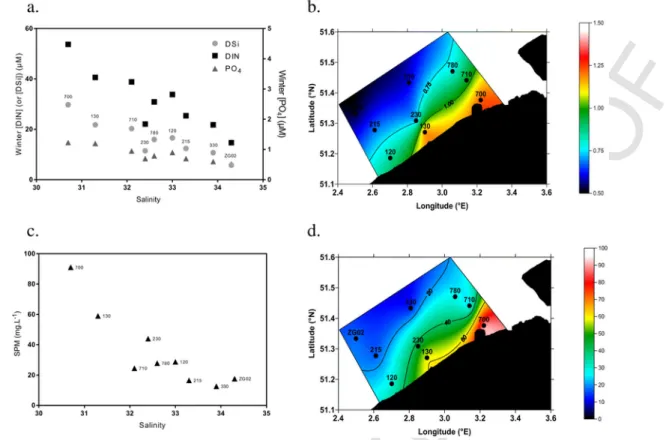
For each nutrient, winter concentrations decreased from near-shore stations (e.g. 700, 710) to offshore stations (e.g. ZG02) with maxi-mum concentrations at station 700 because of its proximity with the Scheldt estuary (Fig. 4a, b). Winter concentration of DIN, DSi and PO4decreased from respectively 40–55, 20–30 and 1 μmol L− 1at
sta-tion 700 to 15, 6 and 0.5 μmol L− 1 at the station farthest from the
mouth of the Scheldt estuary (ZG02) (Fig. 4a, b). SPM also decreased from near-shore to off-shore stations (Fig. 4c, d).
3.2. Seasonal evolution of Chl-a and DMS(P,O) concentration
As previously described (e.g. Lancelot et al., 2007), seasonal evo-lution of phytoplankton bloom in the area is characterized by a suc-cession of three blooms (early spring diatoms in February,
Phaeocys-tis colony bloom in April–May and summer diatom from July/August
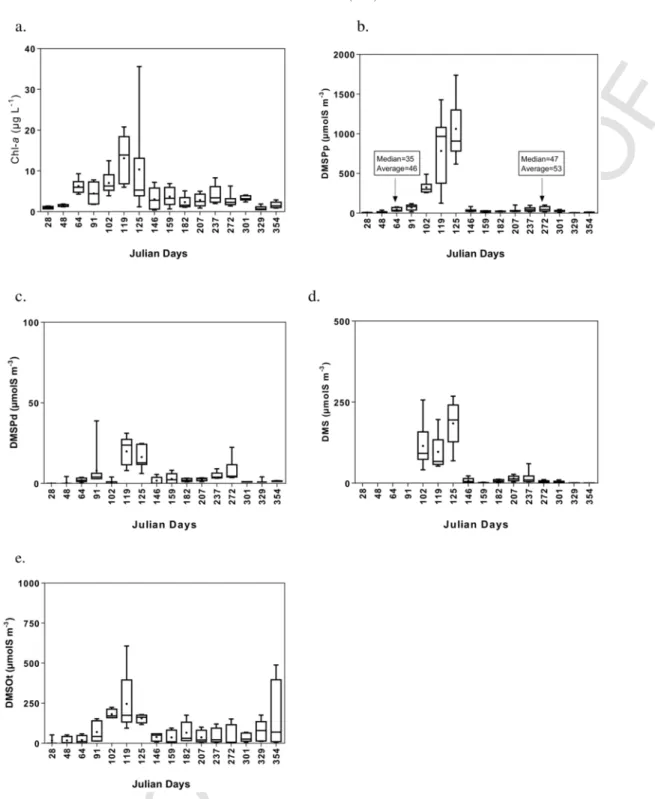
to end of September) with Chl-a maximal concentration of 36 μg L− 1 for the different sampled stations in spring (Fig. 5a). Seasonal evo-lution of DMSPp (Fig. 5b) followed the same seasonal pattern than Chl-a concentration and was then characterized by a huge peak with concentration up to 1740 nmol L− 1in April–May during
Phaeocys-tis bloom and two relatively low peaks with average DMSPp
concen-tration around 45 and 50 nmol L− 1in early spring and summer (Fig.
5b) associated to diatom blooms. Higher spatial variability was mea-sured in April–May with marked differences between minimal and maximal values and average and median values (Fig. 5b). DMSPd showed a similar seasonal pattern but with concentrations lower than 50 nmol L− 1around the year (Fig. 5c). In 1989, in the SNS, Turner et al. (1996) reported averaged concentrations of around 200 nmol L− 1 for both DMSPp and DMSPd in May with local maxima of 450 and 600 nmol L− 1for DMSPp and DMSPd, respectively. Our DMSP
con-centrations are generally higher than those of Turner et al. (1996) and the relative importance of DMSPp and DMSPd were opposite with a larger part of DMSPp than DMSPd in our measurements. This dif-ference could result from the filtration procedure, that, in the past, tented to overestimate DMSPd and underestimate DMSPp (Kiene and Slezak, 2006). The total quantity of DMSP (DMSPp + DMSPd) will also largely vary depending on the location of the sampling station and the magnitude of the phytoplankton bloom, in particular the
Phaeo-cystis bloom (Figs. 5; 6). The Turner et al. (1996) data were collected
about 75 km from the BCZ coastline, while our sampling stations were within 20 km of the coastline. Breton et al. (2006) pointed out a signif-icant interannual variability in the magnitude of Phaeocystis blooms in the BCZ due to the combined effects of hydro-climatic variability and human activities via the Scheldt nutrient loads. The DMSP values we report were also higher than those reported in the deeper and season-ally stratified northern North Sea, with maximum DMSPp values of 70 nmol L− 1reported during a bloom of coccolithophores (Archer et al., 2002). However, the maximum DMSP values we report converge with those reported by van Duyl et al. (1998) in the Wadden Sea (max-imum DMSPp of 1650 nmol L− 1). Overall, these results confirm that
shallow productive near-shore coastal areas where high DMSP pro-ducing taxa such Phaeocystis occur can show DMS(P) values an order of magnitude higher than more open oceanic deeper and less produc-tive waters, even within a given continental shelf system such as the North Sea.
DMS (Fig. 5d) followed the same pattern than DMSP with spa-tially averaged concentration of 180 nmol L− 1 in May (with local maximum up to 250 nmol L− 1). The timing of the DMS peak was
closely linked to the DMSP peak suggesting that DMS was formed from the transformation (cleavage) of DMSP (mainly during the
Phaeocystis bloom), a typical interpretation of seasonal DMS(P)
cy-cles (Kwint and Kramer, 1996), in line with the general understand-ing of DMSP-DMS dynamics (Stefels et al., 2007), based for instance
UNCORRECTED
PROOF
Fig. 3. Box and whisker plots of (a) dissolved silica (DSi), (b) dissolved inorganic nitrogen (DIN), (c) phosphate (PO4) and (d) suspended particulate matter (SPM) measured at the
nine stations (refer to Fig. 1) sampled in the Belgian Coastal Zone in 2016. Data for the nine stations sampled were grouped for each sampling data. The horizontal line corresponds to the median, the cross to the arithmetic average, the box to the interquartile range, error bars to the minimal and maximal values.
on the study of sulfur isotopes of DMSP and DMS (Kiene and Linn, 2000b). Phaeocystis is known for its high DMSP production (Keller et al., 1989) and DMSP-lyase activity (Stefels et al., 1996) than can cleave DMSP into DMS. Turner et al. (1996) reported a maximum monthly and spatially averaged surface DMS concentration of 55 nmol L− 1in May 1989 in the SNS due to an extensive bloom of
Phaeocystis. Our maximum spatially averaged DMS concentration of
129 nmol L− 1also occurred in May, and was higher because our
sta-tions were more in-shore than those of Turner et al. (1996). Turner et al. (1996) found locally concentrations up to 311 nmol L− 1 dur-ing that same month, which is in good agreement with our maximum of 268 nmol L− 1 at station 120 in early May. As previously shown
by van Duyl et al. (1998), the DMS peak coincided with the
Phaeo-cystis bloom and DMSP maxima rather than following it, as a
re-sult of the fast growth of DMS-consuming bacteria after the bloom, and emission to the atmosphere preventing accumulation of DMS in water. The maximum DMS concentrations we report (255 nmol L− 1) were similar to maximum values reported by other studies in coastal near-shore areas of the North Sea (Kwint and Kramer, 1996; van Duyl et al., 1998) and were higher than those reported in the deeper and seasonally stratified northern North Sea, with maximum DMS values of 5 nmol L− 1 reported during a bloom of coccolithophores (Archer et al., 2002). Overall, the DMS maximum concentrations in the near-shore coastal areas of the North Sea are one to two orders of magnitude higher than the seasonal maxima typical of open oceanic waters, as compiled and reviewed by Lana et al. (2011).
As a general pattern, DMSOt showed a similar seasonal evolution than Chl-a and DMSP with maximal averaged value of 250 nmol L− 1
(and local maximum up to 600 nmol L− 1) associated to the spring
bloom of Phaeocystis (Fig. 5e). However, DMSOt slightly increased at the end of the year but not associated to similar increase of DMSPp or DMSPd (Fig. 5b, c). For DMSO, the highest spatial variability was measured in December with marked differences between minimal and maximal values (Fig. 5e). Based on these measurements, average DM-SPt:DMSOt ratio varied between 0.7 and 2.5 during (spring and sum-mer) diatom blooms and increased up 7 during the Phaeocystis bloom. Values computed during diatom blooms were lower than the ratio gen-erally measured for particulate fractions in phytoplankton pure cul-ture (between 1.1 and 12.1 for diatoms; Hatton and Wilson, 2007). We can thus expect than most of the DMSO measured in the area was in dissolved phase (excepted during the Phaeocystis bloom) in particular in winter when DMSO can reach high values (Fig. 5e) and Chl-a and DMSPp were low (Fig. 5a, b). The relative importance of particulate and dissolved fractions varies between DMSP and DMSO and seasonally. Generally, DMSPd is very low compared to DMSPp while DMSOd dominates DMSO pool and can exceed concentration of both DMS and DMSPd in euphotic waters (Hatton and Wilson, 2007). Simó et al. (1998) reported DMSOp and DMSOd concentra-tions for North Sea samples containing Phaeocystis (UK coast, in June) of respectively 16 and 25 nmol L− 1. This is lower than our con-centrations but their samples were probably taken at the end of
Phaeo-cystis bloom, while our samples covered the whole bloom period. For
August in the same area, they reported DMSOp and DMSOd con-centrations of respectively 2.7 and 2.3 nmol L− 1for seawater samples containing diatoms and dinoflagellates. Hatton et al. (1996) reported DMSOd concentrations ranging between 0.5 and 17.5 nmol L− 1 for
UNCORRECTED
PROOF
Fig. 4. Winter (February) (a) dissolved silica (DSi), dissolved inorganic nitrogen (DIN), and phosphate (PO4) concentrations and (c) suspended particulate matter (SPM) measured at
the nine stations sampled in the Belgian Coastal Zone in 2016 as function of salinity. Spatial plots of winter (b) PO4(μM) and (d) SPM (mg L− 1) concentration.
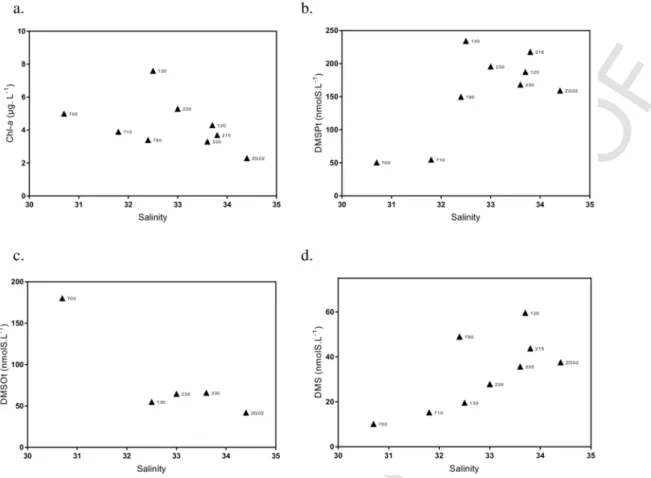
3.3. Spatial variations of Chl-a and DMS(P,O) concentrations
Annual averaged concentrations of Chl-a computed for each sam-pling station decreased with increasing salinity (and decreasing nutri-ent concnutri-entrations) (Fig. 6a). However, two decreasing patterns can be observed (Fig. 6a) with stations (700, 710, 780) under the direct influ-ence of the Scheldt (and high SPM; Fig. 4b) characterized by lower Chl-a concentration than the other two transects at similar or lower salinity values (and higher nutrient concentrations; Fig. 4a). Maximum Chl-a concentrations were measured at station 130 and lower concen-tration at station ZG02. Total DMSP showed a similar pattern with low values in particular for the station 700 and 710. The evolution of DMSPt as a function of salinity for the other stations was less clear than for Chl-a (Fig. 6b). Total DMSO concentrations were similar for most of the stations, except for station 700 that was characterized by a concentration three times higher (Fig. 6c). This very high DMSO con-centration could be related to the high SPM concon-centration measured at this station (Fig. 4b, d) suggesting that in very near-shore stations, part of the DMSO measured could be linked to the resuspension of sedi-ment. DMS spatial variability seemed to follow the DMSP concentra-tion (Fig. 6d).
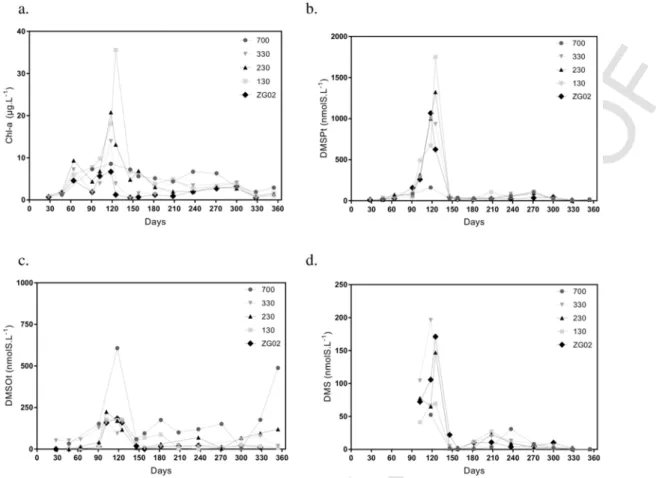
Seasonal evolution of Chl-a and DMS(P,O) (Fig. 7) measured at five stations chosen to cover both near-offshore gradient and a lon-gitudinal gradient from station 700 (close to the Scheldt estuary), to the most “marine” station (ZG02) reveals an important spatial vari-ability mainly during the spring bloom in April–May. Most of the sta-tions were characterized by a marked seasonal variability of Chl-a with maximal concentration measured in spring varying from 7 to 35 μg L− 1 along a coastal-offshore gradient (Fig. 7a). On the con-trary, Chl-a concentration measured at station 700 stayed approxi
mately constant throughout the year. In response to Chl-a concentra-tion, DMSP also showed marked seasonal and spatial variability with spring maximal value varying from 160 to 1750 nmol L− 1(Fig. 7b).
Apart from station 700, other stations were not clearly differentiated in terms of DMSOt concentrations (Fig. 7c). Station 700 had high concentrations of DMSOt, probably because of an accumulation of DMS in the suspended organic matter where it could be oxidized into DMSO (Hatton, 2002). This is particularly noticeable in December when SPM (Fig. 3d) and DMSOt (Fig. 7c) are very high (290 mg L− 1 and 500 nmol L− 1, respectively). DMS concentration (Fig. 7d) is not exactly related to DMSP but stations characterized by high DMSP val-ues are also characterized by high DMS concentration and lowest con-centrations are measured at station 700 as for DMSP (Fig. 7a).
3.4. Drivers of DMS(P,O) variability in the SNS
To investigate whether the observed variation in DMS(P, O) could be explained by the effect of the measured abiotic and biotic vari-ables, multiple-regression analyses were performed (Table 1). DMSP was strongly correlated to Chl-a (coef = 62.29, t = 11.07, p≪ 0.001) (Table 1). The other variables tested were not significantly correlated to DMSP concentration (Table 1). DMSO was not significantly related to any abiotic or biotic factors tested (not shown).
We compared DMSP computed for the whole data set from the linear regression with Chl-a (DMSPp (nmol L− 1) = 48.34∗ Chl-a (μg L− 1), r2= 0.74, p≪ 0.001) with the initial DMSP data. The re-gression model tends to overestimate DMSP except during the
Phaeo-cystis bloom (Fig. 8a). The relationship deduced from field
mea-surements is highly influenced by the Phaeocystis bloom and is not adapted to estimate neither DMSP linked to spring and summer
UNCORRECTED
PROOF
Fig. 5. Box and whisker plots of (a) Chlorophyll-a (Chl-a); (b) particulate and (c) dissolved dimethylsulfoniopropionate (DMSP) (DMSPp and DMSPd); (d) dimethylsulfide (DMS)
averaged for the nine stations (refer to Fig. 1) sampled per cruise in the Belgian Coastal Zone in 2016 and (e) total dimethylsulfoxide (DMSOt) (average of only 5 stations). The horizontal line corresponds to the median, the cross to the arithmetic average, the box to the interquartile range, error bars to the minimal and maximal values.
diatom blooms nor winter DMSP values. The magnitude of the mod-elled DMSP peak linked to the Phaeocystis bloom is generally un-derestimated compared to measurements (Fig. 8a). Despite the impor-tance of phytoplankton biomass (captured by Chl-a) for the DMSP concentration, this kind of simple relationship between DMSP and Chl-a is not sufficiently robust to correctly describe seasonal and spa-tial variability of DMSP and, by extension, to estimate DMS emis-sions, as also shown by Gypens et al. (2014).
3.5. Phytoplankton composition and DMSP concentration
Phytoplankton biomass and composition at station 330 (Fig. 9) were similar to previous studies at the same station (Rousseau et al., 2002), with a recurrent pattern of blooms of three diatom communi-ties and Phaeocystis. The first diatom community (February–March, day 60 to 90; community 1) is mainly composed of colonial diatoms (including Skeletonema costatum, Thalassiosira spp., Thalassionema
UNCORRECTED
PROOF
Fig. 6. Annual averaged (a) Chlorophyll-a (Chl-a); (b) total dimethylsulfoniopropionate (DMSPt); (c) total dimethylsulfoxide (DMSOt) and (d) dimethylsulfide (DMS)
concentra-tions measured at the nine staconcentra-tions (refer to Fig. 1) sampled in the Belgian Coastal Zone in 2016 as function of salinity.
nitzschioides, Asterionella spp., Biddulphia spp., Nitzschia spp.) and Ditylum brightwellii in 2016 (Fig. 9a). In term of biomass, Ditylum brightwellii is dominant in February–March in 2016 (Fig. 9b). Some
of these species co-occurred with the second diatom community of
Chaetoceros spp. (day 102; Fig. 9a). The onset of Phaeocystis is
asso-ciated to the Chaetoceros community in early March–mid April (day 102 to 125; Fig. 9c; Rousseau et al., 2002). Pseudo-Nitzschia
deli-catissima cells are frequent on the surface of Phaeocystis colonies and
is one of the only diatom observed during the Phaeocystis bloom in 2016 (Fig. 9a). The third diatom community composed of large-sized diatoms (Rousseau et al., 2002) as Guinardia spp. appeared at the end of the Phaeocystis bloom and dominates the phytoplankton biomass in June–July (day 180 to 207; Fig. 9c) after a short period of very clear water in end of May–early June. From August to October species from community 1 were blooming again in addition of some new species like Eucampia zodiacus. Some dinoflagellates were also observed in July (day 237; Fig. 9c).
Carbon to Chl-a ratio (C:Chl-a) ranged between 10 (late October) and 388 at the end of the Phaeocystis bloom in May (not shown). This ratio could be comprised between 10 and 300 (Cloern and Jassby, 1995); it is taxon-dependent and varies seasonally with nutrient deple-tion and limitadeple-tion. Spring diatoms have low C:Chl-a (20–40) com-pared to summer diatoms when nutrients are exhausted (Steele and Baird, 1962; Welschmeyer and Lorenzen, 1984). Dinoflagellates and
Phaeocystis spp. have high C:Chl-a (Eppley et al., 1977; Verity et al.,
1991).
Following the phytoplankton composition changes, DMSPp:Chl-a and DMSPp:C ratios varied along the seasonal cycle (Fig. 10).
Higher values are associated to the Phaeocystis bloom and this was particularly marked for the DMSPp:Chl-a ratio at the end of the bloom (Fig. 10). DMSPp:Chl-a and DMSPp:C ratios were lower for diatom blooms, particularly in summer during the bloom of Guinardia (day 210; Figs. 9c, 10). An increased ratio was observed in association with dinoflagellates in summer (day 240; Figs. 9c, 10). These results ware in accordance with measurements made on a few key-species of the studied area in batch cultures and with the data compiled by Keller et al. (1989) and Stefels et al. (2007) (Table 2). As a general pattern, diatoms were on average characterized by a DMSPp:Chl-a around 4 ± 6 mmolS gChl-a− 1(Table 2; Stefels et al., 2007).
How-ever, some species such as Skeletonema costatum blooming in early spring in the area has a higher DMSP quota. DMSP quota by
Guinar-dia spp. was very low in pure cultures (Table 2) and can explain the
low DMSPp:Chl-a and DMSPp:C ratios observed in the area in sum-mer (Fig. 10).
Two different DMSPp versus Chl-a correlations could be dis-criminated, one for all diatoms and another one for only
Phaeocys-tis colonies. These correlations depict the taxon-dependency of
DM-SPp production with a high production by Phaeocystis blooming in April–May (DMSPp (nmol L− 1) = 58.17∗ Chl-a (μg L− 1), r2= 0.78,
p≪ 0.001) and a low DMSP production by diatoms (DMSPp (nmol L− 1) = 9.47∗ Chl-a (μg L− 1), r2= 0.69, p≪ 0.001). The use of
these specific DMSPpChl-a relationships allows a better fit of mod-elled DMSP compared to observations (Fig. 8b). Consequently, em-pirical relationship used in global models to estimate DMSP based on Chl-a should, at least, consider two separate DMSP-Chl-a relation-ships for diatoms and non-diatoms.
UNCORRECTED
PROOF
Fig. 7. Seasonal evolution of (a) Chlorophyll-a (Chl-a); (b) total dimethylsulfoniopropionate (DMSPt); (c) total dimethylsulfoxide (DMSOt) and (d) dimethylsulfide (DMS) at five
stations in the Belgian Coastal Zone in 2016.
Table 1
Multiple-regression analysis of effects of sea surface salinity (SSS), sea surface temper-ature (SST, °C), Chl-a (μg L− 1), Suspended particulate matter (SPM, mg L− 1) and PO
4
(μmol L− 1) on the dependent variable DMSP (nmol L− 1). Only data for which all
mea-surements were available were used (n = 55).
Parameter estimates t p Intercept − 1201.38 − 1.38 0.17 SSS 36.97 1.48 0.14 SST − 8.65 − 1.79 0.08 Chl-a 62.29 11.07 6.10− 15 SPM − 1.79 − 1.28 0.21 PO4 41.19 0.59 0.59 4. Conclusions
In the BCZ, DMS(P,O) dynamics were particularly marked by a strong seasonality driven by the phytoplankton succession, dur-ing which low DMS(P,O) producers (diatoms) alternated with high DMS(P,O) producers (Phaeocystis globosa and dinoflagellates). In addition, very marked spatial variability of DMS(P,O) was also ob-served at very small scale as the stations were < 20 km apart. This is due to the presence of the Scheldt estuary influencing both DMSP and DMSO concentrations, because of the influence on phytoplank-ton biomass of the estuarine inputs of inorganic nutrients and total
suspended matter. Overall, maximum DMSPtand DMS values
associ-ated to the Phaeocystis bloom in this near-shore shallow and very pro-ductive coastal environment (1740 and 250 nmol L− 1, respectively)
were one to two orders of magnitude higher than those typically en-countered in open oceanic waters, as well as those in the deeper strati-fied northern North Sea even during blooms of high DMSP producing coccolithophorids.
Uncited reference Wolfe et al., 2002 Acknowledgements
We are grateful to the crew of the RV Simon Stevin for assistance during the cruises, to André Cattrijsse and Jonas Mortelmans (VLIZ) for organizing the schedule of cruises, and to two anonymous review-ers for constructive comments on a previous vreview-ersion of the manu-script. The GC was acquired with funds from the Fonds National de la Recherche Scientifique (FNRS) (2.4.637.10). NG received financial support from the Fonds David et Alice Van Buuren. GS and CR have a PhD grant from the FRIA (Fund for Research Training in Industry and Agriculture, FNRS). AVB is a senior research associate at the FNRS.
UNCORRECTED
PROOF
Fig. 8. Seasonal evolution of particulate dimethylsulfoniopropionate (DMSPp) measured (in black) and estimated based on Chlorophyll-a (Chl-a) using (a) one relationship for all
phytoplankton species [DMSPp (nmol L− 1) = 48.34∗ Chl-a (μg L− 1)] or (b) one relationship for diatoms [DMSPp (nmol L− 1) = 9.47∗ Chl-a (μg L− 1)] and another one for
non-di-atoms [DMSPp (nmol L− 1) = 58.17∗ Chl-a (μg L− 1)].
Fig. 9. Seasonal variation of phytoplankton cell density (103L− 1) (a, b) and biomass (μg L− 1) (c, d) at station 330 during the year 2016 with (b, d) and without (a, c) taking account
UNCORRECTED
PROOF
Fig. 10. Seasonal evolution of particulate dimethylsulfoniopropionate to Carbon
(DM-SPp/C) and DMSPp to Chlorophyll-a (Chl-a) (DMSPp/Chl-a) ratios measured at the station 330 in 2016.
Table 2
DMSPp:Chl-a data from batch cultures and literature review. DMSPp:Chl-a ratio from Keller et al. (1989) were re-calculated from DMSP:C ratio assuming an average C:Chl-a of 60 (g:g) for all species.
Species group
DMSPp:Chla
(mmol:g) Data from Diatoms
Community 1 Diatoms (n = 22) 4 ± 6 Stefels et al. (2007)
Skeletonema costatum
35.3 ± 6 Laboratory culture, this study
Nitzschia closterium
13.8 Laboratory culture, this study
Nitzschia closterium
24.8 Keller et al. (1989)
Thalassiosira spp. 2.6 Keller et al. (1989)
Thalassiosira
rotulaa 10.5 Laboratory culture, thisstudy
Asterionella glacialis
5.7 Laboratory culture, this study Asterionella glacialis N.D. Keller et al. (1989) Ditylum brightwellii 6.0 Keller et al. (1989) Community 2 Chaetoceros
socialis N.D. Laboratory culture, thisstudy
Chaetoceros
debilisa 0.8 Laboratory culture, thisstudy
Community 3 Guinardia
delicatulaa 1.9 Laboratory culture, thisstudy
Haptophytes Haptophytes (n = 32) 52 ± 37 Stefels et al. (2007) Phaeocystis globosa
95.25 Laboratory culture, this study Phaeocystis globosa 67.0 Keller et al. (1989) Dinoflagellates Dinoflagellates (n = 32) 111 ± 168 Stefels et al. (2007)
aIndicates cultures growing in K-medium instead of F/2 North Sea-medium.
References
Archer, S.D., Gilbert, F.J., Nightingale, P.D., Zubkov, M.V., Taylor, A.H., Smith, G.C., Burkill, P.H., 2002. Transformation of dimethylsulphoniopropionate to di-methyl sulphide during summer in the North Sea with an examination of key processes via a modelling approach. Deep-Sea Res. II 49, 3067–3101.
van den Berg, A.J., Turner, S.M., van Duyl, F.C., Ruardij, P., 1996. Model structure and analysis of dimethylsulphide (DMS) production in the Southern North Sea, considering phytoplankton dimethylsulphoniopropionate-(DMSP) lyase and eu-trophication effects. Mar. Ecol. Prog. Ser. 145, 233–244.
Borges, A.V., Champenois, W., 2017. Preservation protocol for dimethylsulfoniopropi-onate and dimethylsulfoxide analysis in plant material of the Mediterranean sea-grass Posidonia oceanica, and re-evaluation of dimethylsulfoniopropionate leaf content. Aquat. Bot. 143C, 8–10.
Borges, A.V., Speeckaert, G., Champenois, W., Scranton, M.I., Gypens, N., 2017. Pro-ductivity and temperature as drivers of seasonal and spatial variations of dissolved methane in the Southern Bight of the North Sea. Ecosystems https://doi.org/10. 1007/s10021-017-0171-7.
Breton, E., Rousseau, V., Parent, J.Y., Ozer, J., Lancelot, C., 2006. Hydroclimatic modulation of diatom/Phaeocystis blooms in the nutrient-enriched Belgian coastal waters (North Sea). Limnol. Oceanogr. 51 (3), 1401–1409.
Charlson, R.J., Lovelock, J.E., Andreae, M.O., Warren, S.G., 1987. Oceanic phyto-plankton, atmospheric sulfur, cloud albedo and climate. Nature 326, 655–661. Cloern, J.E., Jassby, A.D., 1995. Year-to-year fluctuation of the spring phytoplankton
bloom in South San Francisco Bay: an example of ecological variability at the land-sea interface. In: Ecological Time Series Springer, pp. 139–149 http://link. springer.com/chapter/10.1007/978-1-4615-1769-6_10.
van Duyl, F.C., Gieskes, W.W.C., Kop, A.J., Lewis, W.E., 1998. Biological control of short-term variations in the concentration of DMSP and DMS during a Phaeocystis spring bloom. J. Sea Res. 40, 221–231.
Elliott, A.C., Woodward, W.A., 2007. Statistical Analysis Quick Reference Guidebook With SPSS Examples, 1st ed. Sage Publications, London.
Eppley, R.W., Harrison, W.G., Chisholm, S.W., Stewart, E., 1977. Particulate organic matter in surface waters off Southern California and its relationship to phytoplank-ton. J. Mar. Res. 35, 671–696.
Green, T.K., Hatton, A.D., 2014. The claw hypothesis: a new perspective on the role of biogenic sulphur in the regulation of global climate. Oceanogr. Mar. Biol. Annu. Rev. 52, 315–336.
Gypens, N., Borges, A.V., 2014. Increase in dimethylsulfide (DMS) emissions due to eutrophication of coastal waters offsets their reduction due to ocean acidification. Front. Mar. Sci. Mar. Ecosyst. Ecol. 1, 4. https://doi.org/10.3389/fmars.2014. 00004.
Gypens, N., Borges, A.V., Lancelot, C., 2009. Effect of eutrophication on air–sea CO2
fluxes in the coastal Southern North Sea: a model study of the past 50 years. Glob. Chang. Biol. 15 (4), 1040–1056.
Gypens, N., Borges, A.V., Speeckaert, G., Lancelot, C., 2014. The dimethylsulfide cy-cle in the eutrophied Southern North Sea: a model study integrating phytoplankton and bacterial processes. PLoS One 9 (1), e85862.
Harada, H., Kiene, R.P., 2011. Assessment and characteristics of DMSP lyase activity in seawater and phytoplankton cultures. In: http://repository.kulib.kyoto-u.ac.jp/ dspace/handle/2433/159487.
Hasle, G.R., 1978. The inverted microscope method. In: Phytoplankton Manual. UN-ESCO, Paris, pp. 88–96.
Hatton, A.D., 2002. DMSP removal and DMSO production in sedimenting particulate matter in the Northern North Sea. Deep-Sea Res. II Top. Stud. Oceanogr. 49 (15), 3053–3065.
Hatton, A.D., Wilson, S.T., 2007. Particulate dimethylsulphoxide and dimethylsulpho-niopropionate in phytoplankton cultures and Scottish coastal waters. Aquat. Sci. 69 (3), 330–340.
Hatton, A.D., Malin, G., Turner, S.M., Liss, P.S., 1996. DMSO. In: Biological and En-vironmental Chemistry of DMSP and Related Sulfonium Compounds. Springer, pp. 405–412 http://link.springer.com/chapter/10.1007/978-1-4613-0377-0_35. Hatton, A.D., Darroch, L., Malin, G., 2004. The role of dimethylsulphoxide in the
ma-rine biogeochemical cycle of dimethylsulphide. Oceanogr. Mar. Biol. Annu. Rev. 42, 29–55.
Hillebrand, H., Dürselen, C.-D., Kirschtel, D., Pollingher, U., Zohary, T., 1999. Bio-volume calculation for pelagic and benthic microalgae. J. Phycol. 35 (2), 403–424. Holm-Hansen, O., Lorenzen, C.J., Holmes, R.W., Strickland, J.D.H., 1965. Fluoromet-ric determination of chlorophyll. J. Conseil. 30 (1), 3–15. https://doi.org/10.1093/ icesjms/30.1.3.
Keller, M.D., Selvin, R.C., Claus, W., Guillard, R.R.L., 1987. Media for the culture of oceanic ultraphytoplankton. J. Phycol. 23, 633–638.
Keller, M.D., Bellows, W.K., Guillard, R.R.L., 1989. Dimethyl sulfide production in marine phytoplankton. In: Saltzman, E.S., Cooper, W.J. (Eds.), Biogenic Sulfur in the Environment. American Chemical Society, Washington DC, pp. 167–182. Kettle, A.J., Andreae, M.O., Amouroux, D., Andreae, T.W., Bates, T.S., Berresheim,
H., Bingemer, H., et al., 1999. A global database of sea surface dimethylsulfide (DMS) measurements and a procedure to predict sea surface DMS as a function of latitude, longitude, and month. Glob. Biogeochem. Cycles 13 (2), 399–444. Kiene, R.P., Gerard, G., 1994. Determination of trace levels of dimethylsulfoxide
(DMSO) in seawater and rainwater. Mar. Chem. 47 (1), 1–12.
Kiene, R.P., Linn, L.J., 2000. On the fate of DMSP-sulfur in seawater: tracer studies with dissolved 35S-DMSP. Geochim. Cosmochim. Acta 64, 2797–2810.
UNCORRECTED
PROOF
Kiene, R.P., Linn, L.J., 2000. Distribution and turnover of dissolved DMSP and its re-lationship with bacterial production and dimethylsulfide in the Gulf of Mexico. Limnol. Oceanogr. 45, 848–861.
Kiene, R.P., Slezak, D., et al., 2006. Low dissolved DMSP concentrations in seawater revealed by small-volume gravity filtration and dialysis sampling. Limnol. Oceanogr. Methods 4, 80–95.
Kiene, R.P., Linn, L.J., Bruton, J.A., 2000. New and important roles for DMSP in ma-rine microbial communities. J. Sea Res. 43 (3), 209–224.
Kirst, G.O., Thiel, C., Wolff, H., Nothnagel, J., Wanzek, M., Ulmke, R., 1991. Di-methylsulfoniopropionate (DMSP) in ice-algae and its possible biological role. Mar. Chem. 35, 381–388.
Kwint, R.L.J., Kramer, K.J.M., 1996. Annual cycle of the production and fate of DMS and DMSP in a marine coastal system. Mar. Ecol. Prog. Ser. 134, 217–224. Lana, A., Bell, T.G., Simó, R., Vallina, S.M., Ballabrera-Poy, J., Kettle, A.J., et al.,
2011. An updated climatology of surface dimethlysulfide concentrations and emis-sion fluxes in the global ocean. Glob. Biogeochem. Cycles 25, GB1004https://doi. org/10.1029/2010GB003850.
Lancelot, C., Spitz, Y., Gypens, N., Ruddick, K., Becquevort, S., et al., 2005. Model-ling diatom and Phaeocystis blooms and nutrient cycles in the Southern Bight of the North Sea: the MIRO model. Mar. Ecol. Prog. Ser. 289, 63–78.
Lancelot, C., Gypens, N., Billen, G., Garnier, J., Roubeix, V., 2007. Testing an inte-grated river–ocean mathematical tool for linking marine eutrophication to land use: the Phaeocystis-dominated Belgian coastal zone (Southern North Sea) over the past 50 years. J. Mar. Syst. 64 (14), 216–228.
Liss, P.S., Malin, G., Turner, S.M., Holligan, P.M., 1994. Dimethyl sulfide and Phaeo-cystis - a review. J. Mar. Syst. 5, 41–53.
Masotti, I., Belviso, S., Alvain, S., Johnson, J.E., Bates, T.S., Tortell, P.D., Kasamatsu, N., Mongin, M., Marandino, C.A., Saltzman, E.S., Moulin, C., 2010. Spatial and temporal variability of the dimethylsulfide to chlorophyll ratio in the surface ocean: an assessment in the light of phytoplankton composition determined from space. Biogeosci. Discuss. 7 (3), 3605–3650.
Menden-Deuer, S., Lessard, E.J., 2000. Carbon to volume relationships for dinoflagel-lates, diatoms, and other protist plankton. Limnol. Oceanogr. 45 (3), 569–579. Miles, J., 2014. Tolerance and variance inflation factor. In: Wiley Stats Ref: Statistics
Reference Online. John Wiley & Sons, Ltd. https://doi.org/10.1002/ 9781118445112.stat06593.
Pallant, J., 2007. SPSS Survival Manual, a Step by Step Guide to Data Analysis Using SPSS for Windows, 3 ed. McGraw Hill, Sydney, 179–200.
Quinn, P.K., Bates, T.S., 2011. The case against climate regulation via oceanic phyto-plankton sulphur emissions. Nature 480 (7375), 51–56. https://doi.org/10.1038/ nature10580.
Rousseau, V., Mathot, S., Lancelot, C., 1990. Calculating carbon biomass of Phaeocys-tis sp. from microscopic observations. Mar. Biol. 107, 305–314.
Rousseau, V., Becquevort, S., Parent, J.Y., Gasparini, S., Daro, M.H., Tackx, M., Lancelot, C., 2000. Trophic efficiency of the planktonic food web in a coastal ecosystem dominated by Phaeocystis colonies. J. Sea Res. 43, 357–372. Rousseau, V., Leynaert, A., Daoud, N., Lancelot, C., 2002. Diatom succession,
silicifi-cation and silicic acid availability in Belgian coastal waters (Southern Bight of the North Sea). Mar. Ecol. Prog. Ser. 236, 61–73.
Rousseau, V., Park, Y., Ruddick, K., Vyverman, W., Parent, J.P., Lancelot, C., Cox, D., 2006. Phytoplankton blooms in response to nutrient enrichment. In: Current Status of Eutrophication in the Belgian Coastal Zone. pp. 45–59.
Simó, R., Vila-Costa, M., 2006. Ubiquity of algal dimethylsulfoxide in the surface ocean: geographic and temporal distribution patterns. Mar. Chem. 100 (1–2), 136–146. https://doi.org/10.1016/j.marchem.2005.11.006.
Simó, R., Hatton, A.D., Malin, G., Liss, P.S., 1998. Particulate dimethyl sulphoxide in seawater: production by microplankton. Mar. Ecol. Prog. Ser. 167, 291–296. Steele, J.H., Baird, I.E., 1962. Further relations between primary production,
chloro-phyll, and particulate carbon. Limnol. Oceanogr. 7 (1), 42–44.
Stefels, J., 2000. Physiological aspects of the production and conversion of DMSP in marine algae and higher plants. J. Sea Res. 43, 183–197.
Stefels, J., 2009. Determination of DMS, DMSP, and DMSO in seawater. In: Practical Guidelines for the Analysis of Seawater. p. 223.
Stefels, J., Dijkhuizen, L., Gieskes, W.W.C., 1995. DMSP-lyase activity in a spring phytoplankton bloom off the Dutch coast, related to Phaeocystis sp. abundance. Mar. Ecol. Prog. Ser. 123, 235–243.
Stefels, J., Gieskes, W.C., Dijkhuizen, L., 1996. Intriguing functionality of the produc-tion and conversion of DMSP in Phaeocystis sp.. In: Biological and Environmental Chemistry of DMSP and Related Sulfonium Compounds. Springer, pp. 305–315. https://doi.org/10.1007/978-1-4613-0377-0_26.
Stefels, J., Steinke, M., Turner, S., Malin, G., Belviso, S., 2007. Environmental con-straints on the production and removal of the climatically active gas dimethylsul-phide (DMS) and implications for ecosystem modelling. Biogeochemistry 83 (1–3), 245–275. https://doi.org/10.1007/s10533-007-9091-5.
Steinke, M., Malin, G., Liss, P.S., 2002. Trophic interactions in the sea: an ecological role for climate relevant volatiles?. J. Phycol. ISSN: 0022-3646, 38 (4), 630–638. Sunda, W.K.D.J., Kieber, D.J., Kiene, R.P., Huntsman, S., 2002. An antioxidant
func-tion for DMSP and DMS in marine algae. Nature 418 (6895), 317–320. Turner, S.M., Malin, G., Liss, P.S., Harbour, D.S., Holligan, P.M., 1988. The seasonal
variation of dimethyl sulphide and DMSP concentrations in nearshore waters. Limnol. Oceanogr. 33, 364–375.
Turner, S.M., Malin, G., Nightingale, P.D., Liss, P.S., 1996. Seasonal variation of di-methyl sulphide in the North Sea and an assessment of fluxes to the atmosphere. Mar. Chem. 54, 245–262.
Vairavamurthy, A., Andreae, M.O., Iverson, R.L., 1985. Biosynthesis of dimethylsul-fide and dimethylpropiothetin by Hymenomonas carterae in relation to sulfur source and salinity variations. Limnol. Oceanogr. 30, 59–70.
Verity, P.G., Smayda, T.J., Sakshaug, E., 1991. Photosynthesis, excretion, and growth rates of Phaeocystis colonies and solitary cells. Polar Res. 10 (1), 117–128. VLIZ, 2017. Flanders Marine Institute (VLIZ), Belgium (2017): LifeWatch
Observa-tory Data: Nutrient, Pigment, Suspended Matter and Secchi Measurements in the Belgian Part of the North Sea. https://doi.org/10.14284/301.
Wang, S., Elliott, S., Maltrud, M., Cameron-Smith, P., 2015. Influence of explicit Phaeocystis parameterizations on the global distribution of marine dimethyl sul-fide. J. Geophys. Res. 2158–2177.
Welschmeyer, N.A., Lorenzen, C.J., 1984. Carbon-14 labeling of phytoplankton car-bon and chlorophyll a carcar-bon: determination of specific growth rates. Limnol. Oceanogr. 29 (1), 135–145.
Wolfe, G.V., Steinke, M., Kirst, G.O., 1997. Grazing-activated chemical defence in a unicellular marine alga. Nature 387, 894–897.
Wolfe, G.V., Strom, S.L., Holmes, J.L., et al., 2002. Dimethylsulfoniopropionate cleavage by marine phytoplankton in response to mechanical, chemical, or dark stress. J. Phycol. 38, 948–960.