Status: Postprint (Author’s version)
The vacuum UV photoabsorption spectrum of methyl bromide (CH
3Br) and
its perdeuterated isotopomer CD
3Br: a Rydberg series analysis
R. Locht a, B. Leyh a, H.W. Jochims b, H. Baumgärtel b
a
Laboratoire de Dynamique Moléculaire, Département de Chimie, Institut de Chimie, Bât. B6c, Université de Liège, Sart-Tilman par B-4000 Liège 1, Belgium
b
Institut für Physikalische und Theoretische Chemie, Freie Universität Berlin, Takustraβe 3, D-14195 Berlin, Germany
Abstract
The vacuum UV photoabsorption spectrum of CH3Br has been recorded between 6 and 25 eV. A large
number of vibronic bands are observed. They were partly ascribed to vibrationless Rydberg transitions. In the high photon energy range of 12-25 eV, very weak diffuse bands are mostly assigned to transitions from the 3a1,
le and (2a1 + la1) to 3s orbitals. In the 6-12 eV photon energy range, numerous weak to strong bands are
observed. The sharpness is very variable over the entire spectral region. In a first step, the interpretation of the spectrum and the assignment of the Rydberg transitions is based on the simple Rydberg formula. The observed features are classified in two groups of four series, each converging to one of the two spin-orbit components of the X~2E state of CH3Br+. Rydberg series of nsa1, npa1, npe, nd and possibly nf characters are observed. The
same measurements have been made for the first time on CD3Br in the 6-12 eV photon energy range. The
observed features are classified into the same Rydberg series characterized by nearly the same δ values. Ionization energies for CD3BrX
~2
E3/2 at 10.565 eV andX
~2
E1/2 at 10.902 eV are deduced. In a second step, we
fitted the experimental data to an energy expression taking into account both the exchange interaction and the spin-orbit coupling. Already states with n = 6 are found to correspond to Hund's case (c). Constant values of the quantum defects are deduced.
Keywords: Photoabsorption; Rydberg series; CH3Br; CD3Br; Exchange interaction; Spin-orbit coupling
1. Introduction
The still topical and acute problem of the detrimental effects of the atmospheric pollutants is a main reason for the investigation of the organic halogenated compounds and particularly the various halogenated methanes.
Though bromine is a minor constituent in the Earth's atmosphere, its ozone depleting efficiency is estimated to be about 50-fold larger than that of chlorine [1]. Furthermore, bromocarbons have a high global warming potential [1, 2].
Methyl bromide, the largest reservoir of atmospheric bromine, is likely to contribute at least 50% of the organic bromine budget to the atmosphere [2]. It has both natural and anthropogenic sources. Since halons are being phased-out, methyl bromide has gained importance. However, the atmospheric lifetime of CH3Br is
estimated to be less than one year. Cessation of its emission would produce prompt results. These facts are strong incentives for the study of this compound.
In previous publications we extensively examined the vacuum UV spectroscopy, the photoelectron spectroscopy (TPES and He-I) and the mass spectrometric photoionization and electroionization of the halogenated derivatives of methane [3-9] and ethylene [10-17]. In many cases, the major importance of the localization and identification of neutral molecular states embedded in the ionization continua has been demonstrated [3-5, 9-11,13-17].
The polyhalogenated derivatives of methane have abundantly been studied in the last fifteen years [18-21] using almost all available spectroscopic techniques. The monosubstituted species received much less attention, and among them particularly CH3Br. Its photoabsorption spectrum has been reported a few times, in
Status: Postprint (Author’s version)
best of our knowledge, the photoabsorption spectroscopy of the perdeuterated isotopomer CD3Br has been
reported only once in the 185-158 nm wavelength region (54 000-63 300 cm-1) [22].
The vacuum UV photoabsorption spectrum of CH3Br was first reported by Price [23] in the wavelength
region of 100-200 nm (6.2-12.4 eV) using a grazing incidence monochromator and the Lyman continuum as excitation source. The intensity is mainly confined to two types of electronic transitions, classified into two Rydberg series converging to the first two ionization limits at 10.49 and 10.80 eV, respectively. Two weaker series start at 66 020 and 68 680 cm-1.
Hochmann et al. [24] and Felps et al. [22] studied the Rydberg transitions in the methyl halides CH3Cl,
CH3Br and CH3I. In the former work the authors analyzed the spectra on the basis of a linear correlation between
the energy of the Rydberg transitions and the ionization energies. In the latter publication the authors restricted their study to the lowest s-type Rydberg transition in both the hydrogenated and perdeuterated methyl halides and presented vibrational assignments. In a later work, Felps et al. [25] reported the electronic spectra of the methyl and cyanogen halides without any detailed analysis of the methyl halides.
Causley and Russell [26] investigated the bromo-methanes in the 40 000-90 000 cm-1 region. By correlating Rydberg series in methyl bromide with corresponding series in Krypton the authors assigned transitions to 4d and 4f Rydberg orbitals. An analysis of the vibrational progressions in the 3s and 3p Rydberg states was also presented.
Despite a lower resolution in this energy range, the electron energy loss spectroscopy provides very useful information on molecular structure. The most recent well resolved (0.05 eV FWHM) dipole (e,e) measurements on CH3Br were reported by Olney et al. [27] between 6 and 25 eV. They also derived the
oscillator strength (related to the cross section and the extinction coefficient) for absorption of CH3Br between 6
and 450 eV at low resolution (1 eV FWHM).
In the present contribution, we report on the photo-absorption spectrum of CH3Br measured in the 6-25
eV photon energy range using synchrotron radiation. To the best of our knowledge, the photoabsorption spectrum of CD3Br as observed between 6 and 12 eV photon energy, is reported for the first time. The aim of
this paper is to reinvestigate in detail the vibrationless Rydberg transitions in CH3Br and CD3Br. An extensive
vibrational analysis is presented in the companion paper. 2. Experimental
2.1. Experimental setup
The experimental setup used in this work has already been described in detail elsewhere [14]. Only the most salient features will be reported here.
Synchrotron radiation available from the BESSY I facility (Berlin, Germany) is dispersed with a modified vacuum UV normal incidence 225 McPherson monochromator with a focal length of 1.5 m, instead of 1 m in the commercial version (lm-NIM-2 beamline). A laminar Zeiss grating is used for the efficient reduction of the second spectral order. It is gold coated with 12001/mm and its transmission breaks down above 26 eV (210 000 cm-1 or 47 nm). The width of the entrance and exit slits of 100 µm ensures a 0.1 nm wavelength resolution corresponding to a resolving power of about 1200 at 10 eV.
Recently, the 3m-NIM-2 beamline at the BESSY II facility (Berlin, Germany) has been started [28]. This monochromator is equipped with a platinum grating of 2400 1/mm and its transmission is optimal between 10 and 40 eV (124-31 nm). The entrance and exit slits were adjusted between 25 and 50 µm leading to a resolving power of 25 000-12 600 at 10 eV (124 nm) photon energy. This monochromator was used for recording well defined restricted photon energy regions at high resolution.
In both setups, the light passes through a 1 mm thick stainless steel microchannel plate necessary to maintain a differential pressure of 1:1000 before entering a 30 cm long stainless steel absorption cell. Most spectra are recorded without filter on the light path. However, in some cases a LiF filter (cutoff at 11.8eV or 95 000 cm-1 or 105 nm) is used, which can be inserted in the light beam without vacuum breakdown. The vapor pressure in the cell is measured by a Balzers capacitor manometer. The light is detected by a sodium salicylate sensitized photomultiplier located at the end of the absorption cell and in front of the absorption cell entrance slit. Output pulses are recorded by a 100 MHz counter. The recording of an absorption spectrum requires one scan with gas in the absorption cell and onewith the empty cell. The stability of the synchrotron radiation and of the pressure in the cell ensured reliable absorption data. When necessary, the spectra presented in the following
Status: Postprint (Author’s version)
sections are corrected for any pressure drift. The commercially available CH3Br, purchased from Praxair and of
99.5% purity, was used without further purification. CD3Br, purchased from Merck, Sharp and Dohme, is
certified at 99 at.% purity. No noticeable impurity was observed by mass spectrometry at 21.2 eV photon energy. Therefore, the sample was used without further purification.
2.2. Data handling and error estimation
As will be mentioned in the next section, in the high photon energy part of the absorption spectrum weak and diffuse structures are superimposed on an intense continuum. To make the characterization of these features easier, a continuum subtraction procedure has been applied. This has already been used successfully in previous spectral analysis [6,29]. For this purpose, the experimental curve is severely smoothed to simulate the underlying continuum which is then subtracted from the original photoabsorption spectrum. The smoothing procedure consists in filtering the experimental curve by fast Fourier transform. The weak features emerge then from a remaining strongly attenuated background.
The wavelength calibration of the 1.5m-NIM mono-chromator has been performed by using the Ar+ absorption spectrum between the 2P3/2 and the
2
P1/2 ionic states. The accuracy of this calibration is better than 2
meV. In the measurements between 6 and 25 eV photon energy, the photoabsorption spectrum has been recorded with an energy interval of about 10 meV. The error on the energy position of a feature is estimated to be 15meV. In the photoabsorption spectra between 6 and 12 eV, an energy increment of 1.5 meV has been adopted. The error on the energy position of a feature is estimated to be of the order of 4 meV. This evaluation is confirmed by the reproducibility of energy positions measured in four different spectra recorded in a two year interval. For high resolution spectra recorded with the 3m-NIM monochromator 50-200 meV photon energy ranges were scanned with 50-200 µeV energy intervals.
3. Experimental results
3.1. The CH3Br photoabsorption spectrum
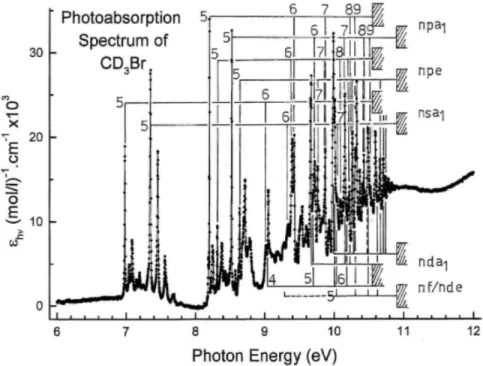
The photoabsorption spectrum of CH3Br has been measured between 6 and 25 eV photon energy. A
typical coarse recording (with energy interval of 10 meV) is reproduced in Fig. 1(a) where the molar extinction coefficient εhv is plotted as a function of the photon energy. Particular attention has been devoted to the energy
range of 11-25 eV where the subtraction procedure (see Section 2.2) has been applied to enhance the weak bands. The result is shown in Fig. 1(b). To help visualizing the structures, a FFT-smoothed curve has been drawn through the data points. The energy positions of these weak bands are listed in Table 1 together with the proposed assignments.
Energy positions estimated from the dipole (e,e) cross section curve as reported by Olney et al. [27] are inserted in this table. The convergence limits listed in this table are those reported by Olney et al. [27], Karlsson et al. [30], Von Niessen et al. [31] and those measured in our laboratory [32] by synchrotron radiation [33] and by fixed wavelength He(I) and He(II) photoelectron spectroscopy, respectively.
The fine structure energy region, recorded between 6 and 12eV with the 1.5m-NIM monochromator, and with energy increments of 1.5meV, is shown in Fig. 2.
In the same figure the assignment of the main features to series of vibrationless Rydberg transitions has been inserted. The convergence limits are the ionization energy values determined by Karlsson et al. [30] using He(I) photoelectron spectroscopy.
3.2. The CD3Br photoabsorption spectrum
The photoabsorption spectrum of CD3Br has been recorded between 6 and 12 eV photon energy (Fig.
3). The assignments of the vibrationless Rydberg transitions are inserted in this figure with convergence limits from an ongoing photoelectron spectroscopic work [32].
4. Discussion of the experimental data
For clarity in the following discussion, let us remind that the molecular orbital configuration of CH3Br in the C3v
Status: Postprint (Author’s version) Br(ls22s22p6)C(ls2)Br(3s23p63d10), (la1) 2 (2a1) 2 (le)4(3a1) 2 (2e)4: X~1A1,
where the first atomic-like orbitals correspond to the inner-shell orbitals which are localized on the Br and C atoms. The la1 and 2a1 are inner-valence molecular orbitals whereas the le, 3a1 and 2e molecular orbitals have
outer-valence character. The most accurate and well-resolved He(I) photoelectron spectrum [30] provides the adiabatic ionization energies at 10.543 ± 0.006 eV (2e-1), 13.0 eV (3a1
-1
) and at 14.5 eV (1e-1) successively. The lowest ionic state shows a 2E3/2
-2
E1/2 spin-orbit splitting of 319 ± 12meV (2573 ± 96 cm -1
) [30]. It has to be pointed out here that the spin-orbit interaction energy in the free Br atom is 0.457 eV (3685 cm-1) [36].
Fig. 1. (a) Vacuum UV photoabsorption spectrum of CH3Br in the 6-25 eV photon energy range. The successive
ionization continua are indicated, (b) Intensity difference ∆ between the photoabsorption spectrum (PAS) and the strongly smoothed photoabsorption spectrum (SSPA) plotted as a function of the photon energy in the 12-24 eV range. The continuous curve is the result of a FFT smoothing. The assignments of the structures and ionization continua are indicated by vertical bars.
Higher lying vertical ionization energies are located at 13.5 eV (3a1 -1
) and 15.0-15.7 eV (1e-1) [30]. With the He(II) resonance line at 30.4 nm, vertical ionization energies are measured at 21.2 eV (2a1
-1
) and at 22.0 eV (1a1-1) [31]. Olney et al. [27] measured vertical ionization energies at 21.3, 22.0, 23.6, 24.9 and at 27.8
eV and above 30 eV in the photoelectron spectra recorded with 34 and 70 eV photons produced by synchrotron radiation. These ionization energies were assigned to many body ion states resulting from the (2a1 + 1a1)
-1
and the 1a1-1 ionizations [27, 33].
4.1. The Rydberg series analysis
As clearly appears from the photoabsorption spectrum of CH3Br reproduced in Fig. 1, two distinct parts
Status: Postprint (Author’s version)
energy part spread over the 12-25 eV photon energy range, made of weak and broader bands. For the assignment of the features observed in this spectrum, their energy positions ERyd were first fitted to the Rydberg formula
Fig. 2. Vacuum UV photoabsorption spectrum of CH3Br in the 6-12 eV photon energy range. The main
vibrationless Rydberg transitions and their respective convergence limit are indicated by vertical bars.
Fig. 3. Vacuum UV photoabsorption spectrum of CD3Br in the 6-12 eV photon energy range. The main
Status: Postprint (Author’s version)
Table 1: Energy positions (eV) of the Rydberg transitions in the CH3Br photoabsorption spectrum as defined by
their band maxima in the 11-25 eV photon energy range
Band maxima Conversion limit (eV) Assignment
This work [27]a [27,30-32]b n* - Rydb. trans.
12.1 12.12 13.5/13.5/13.5 - 3a1-1 3.117 - 3a1 → 6s 15.0/15.4/15.1 - 1e3/2 -1 2.166 - le3/2 → 5s 13.1 13.10 13.5/13.5/13.5 - 3a1 -1 2.030-5.832 - 3a1 → 9s 15.0/15.4/15.1 - 1e3/2 -1 2.675 - le3/2 → 5p 14.2 14.0 15.0/15.4/15.1 - 1e3/2 -1 2.432-3.890 - le3/2 → 7s 3.235 - le3/2 → 6s 15.7/15.7/15.7 - 1e1/2-1 2.916- le1/2→5s 15.3 15.2 15.7/15.7/15.7 - 1e1/2 -1 5.216- le1/2→8s 16.1-16.9 15.6-17.1 (17.9-19.7) ?→5s 18.2 17.9 21.3/21.2-(2a1 + la1)-1 2.046 - 2a1 + la1 → 5s 19.0 18.6 22.1/22.0-(2a1 + la1) -1 2.459 - 2a1 + la1 → 5p 2.265 - 2a1 + la1 → 5s 20.2 20.6 22.1/22.0 -(2a1 + la1) -1 2.712-2a1 +la1 → 5p 3.063 - 2a1 + la1 → 6s 21.6 - 22.1/22.0-(2a1 + la1)-1 5.498 - 2a1 + la1 → 8p 23.6-(2a1 + la1)-1 2.608 - 2a1 + la1 → 5p
23.1 23.6-(2a1 + la1)-1 5.216-2a1 +la1 → 8s
24.9 -(2a1 + la1)-1 2.749 - 2a1 + la1 → 5p
27.8 -(2a1 + la1)-1 -
>30 - la1-1 -
Convergence limits data refer to the vertical ionization energy (IEV) values (eV). a
For explanation, see text. b
In many body ion states the dominant character of the configuration is given by a bold case.
where the Rydberg constant it R = 13.60569 eV [34], δ is the quantum defect, n* is the effective principal quantum number and I.E. is the convergence limit of the Rydberg series. When the principal quantum number is mentioned, e.g. in Table 1, its lowest value is conventionally taken to be n = 5 as in Kr.
A more appropriate formula taking into account both exchange (singlet-triplet splitting) and spin-orbit coupling will be used in a second step of our analysis for the Rydberg series converging to the (2e)-1 continuum.
The 2e → nℓ excitation provides among others 3E and 1E Rydberg states. Additionally, both states undergo the Jahn-Teller splitting. This latter effect is evaluated in the companion paper and is shown to be small (36 meV stabilization energy).
4.2. The high energy region
As far as the high energy part of the photoabsorption spectrum of CH3Br is concerned, the data obtained
in the present work are listed in Table 1 together with the only available literature data [27]. These data were obtained by also handling the dipole (e,e) oscillator strength spectrum of CH3Br [27] using the subtraction
procedure described in Section 2.2. A reasonable agreement is found between both experiments. However, no assignments have been proposed in the literature. Tentative assignments are proposed in the third column of Table 1 together with associated effective principal quantum numbers.
The broad band extending over the 16-17 eV region is observed in both experiments. It could correspond to a 5s Rydberg state, characterized by n* = 2.00, if a convergence limit at 19.9 eV is assumed. No such ionic state of CH3Br
+
has been mentioned in the literature. We recently investigated the threshold photoelectron spectrum (TPES) of this molecule between 10 and 30 eV photon energy by using synchrotron radiation as a tunable excitation source [35]. Weak TPES-bands are detected at 17.9, 18.8, 19.7 and 21.32 eV. Their intensity ratio with respect to the 21.3 eV band is 0.3/0.26/0.14/ 1.00, respectively. A shoulder, not resolved in the dipole (e,e) work [27], is observed at 20.4 eV. Transitions to doubly excited ion states could account for the weakness of these bands in the TPES. The weak and broad signals present in the photoabsorption spectrum could be involved in the autoionization of Rydberg states to (nearly) resonant ionic states. The Rydberg
Status: Postprint (Author’s version)
states at 16-17 eV could also be able to play a role in resonant dissociative autoionization as it is the case for the CH3
+
ion production from CH3F [5], CH3Cl [9] andfor the C2H3 +
fragment from C2H3Br [15]. This investigation
is still in progress.
4.3. The low energy region: Analysis using the Rydberg equation (1)
The vibrationless Rydberg series observed for CH3Br between 6 and 12 eV are shown in Fig. 2 and
their energy positions and assignments are listed in Table 2. In a first step the transitions have been classified according to the nature of the involved Rydberg orbital and by gathering both 2E3/2 and
2
E1/2 spin-orbital
components. This classification is based upon the value of the effective principal quantum numbers n*. Energy levels corresponding to several possible assignments are listed in square brackets. Two previous data sets [24,26] have been included for comparison with the assignments proposed by these authors. As mentioned earlier, the estimated error on the present measurements is about 4meV or 30 cm-1. No error estimation being provided by the latter authors, any further critical comparison is made difficult. However, as shown in Table 2, for most of the levels, the correspondence between the three measurements is univocal.
Obviously, the best agreement is found between the present measurements and the data published by Caus-ley and Russell [26]. For the assignments deduced in the present work, and listed in Table 2, the most accurate abiabatic ionization energies (IEad) of CH3Br as reported by Karlsson et al. [30], i.e. IEad(X
~2
E3/2) =
10.543 ± 0.006 eV and IEad(X~2E1/2) = 10.862 ± 0.006 eV, have been used.
Concerning the 2e → nsa1 Rydberg series, for both spin-orbit components average quantum defects of
respectively, δ = 1.067 and 1.032 have been determined with a standard deviation of 0.045. However, the quantum defect varies slowly with the principal quantum number n because of the relative evolution of the exchange versus spin-orbit interactions with n. This will be dealt with later in this paper. Though n* values agree well with each other within the standard deviation, a propensity of differentiation of the (2E3/2)-nsa1 and the
(2E1/2)-nsa1 Rydberg states seems to arise. Within one series the variation of δ is rather random. For CH3C1 [7] a
more monotonic δ variation with n was observed.
The corresponding assignments basically agree with those proposed by Hochmann et al. [24] and Causley and Russell [26]. These authors used 10.541 and 10.856 eV [24] and 10.540 and 10.859 eV [26] for both adiabatic ionization IEad, respectively. In Table 2 several energy levels listed in square brackets correspond
to alternative possible assignments. Particularly in the (2E1/2)-nsa1 series the assignment of the transitions
observed at 85 329, 85 833 and 86 253 cm-1 are less obvious. Furthermore, as shown in Table 2, the 75 643 cm-1 [24] or 74 684 cm-1 [26] bands are not de tected in the present work. These were both assigned to a 2e → 6sa1
transition, Rydberg series converging to the 2E1/2 ionic state [24,26]. In this region the signal is close to
background in our spectrum where, however, bands are observed at 9.372 eV (75 590 cm-1) and 9.405 eV (75 856 cm-1) (see Table 2). Their corresponding effective quantum numbers n* deduced from Eq. (1) are not compatible with ns-type Rydberg transitions.
As observed for CH3Cl [7], the CH3Br photoabsorption spectrum is dominated by np-type Rydberg
transitions. Due to the non-spherical character of the molecular field, the three p orbitals are split into one a1 and
one e orbital. These Rydberg orbitals are respectively aligned along and perpendicularly to the C3v symmetry
axis of the molecule. This distinction has not been mentioned earlier [24,26], though both transitions behave quite differently, with quantum defects equal to δ = 0.588 (0.579) and 0.543 (0.533) for the 2e → npa1 and the 2e
→ npe transitions, respectively. Values in parenthesis correspond to the series converging to X~2E1/2· This
explains discrepancies between Causley and Russell's [26] assignments and those proposed in this work.
Except for the energy levels at 10.416 and 10.454 eV (see Table 2) the 2e → npa1 series converging to the 2E3/2 and 2E1/2 ionic states could be characterized by an average quantum defect δ = 0.588 ± 0.034 and 0.579
± 0.030 using the simplified Eq. (1). This classification agrees well with the assignments proposed in both previous works [24, 26]. The authors also mentioned the remarkably constant value of 0.55 of the quantum defect [24]. To support their assignments both authors used correlations between Rydberg transition energies in the CH3Br molecule and the Kr atom.
Hochmann et al. [24] correlated 2e → nsa1 and 2e → npa1 transitions to series converging to the 2
E3/2 and 2
E1/2 ionic states based on the constancy of (i) the energy difference, i.e. nearly the 2
E3/2 -2
E1/2 spin-orbit splitting,
and (ii) the difference between the effective principal quantum number values ∆n* ≈ 1.
Causley and Russell [26] correlated the term values Tn of ns and np series in CH3Br and Kr. They
measured the ∆Tn and observed a remarkable convergence of ∆Tn→ 0 between CH3Br and Kr for high n values.
Status: Postprint (Author’s version)
Table 2 : Vibrationless Rydberg transitions as observed for CH3Br in the present work and in previous reports
[24] and [26] for both spin-orbit components: parts (a) and (b) converge to the 2E3/2 and 2
E1/2 ionic states,
respectively
This work Literature Data
ERyd (eV) ERyd(cm
-1 ) n* EFit (eV) [24] [26] 1. 2e → nsa1 Part (a) 6.944 56 010 1.944 6.943 56 062 56 023 8.974 72 383 2.945 8.980 73 035 72 152 9.667 77 969 3.941 9.672 77 985 77 871 9.990 80 575 4.960 9.988 80 548 80 511 10.152 81 881 5.899 10.159 81927 81 879 10.261 82 761 6.946 10.262 - 82 715 [10.328]a 83 301 7.955 10.328 - 83 266 - - - 83 621 10.404 83 914 9.858 10.406 - - 10.430 84 124 10.973 10.430 - - Part (b) 7.332 59 137 1.963 7.331 59 207 59 158 - - - - 75 643 74 684 9.997 80 634 3.967 9.992 80 548 80 427 10.312 83 472 4.974 10.308 83 070 82 997 10.480 84 527 5.968 10.478 84 459 84 405 [10.579]a 85 329 6.934 10.581 - 85 268 [10.642]a 85 833 7.864 10.647 - 85 832 [10.694]a 86 253 8.999 10.692 - 86 209 10.725 86 503 9.963 10.725 - - 10.751 86 713 11.071 10.749 - - 2. 2e → npa1 Part (a) 8.179 65 972 2.399 8.181 66 058 66 730 9.372 75 590 3.409 9.367 75 872 75 702 9.846 79 413 4.418 9.841 79 554 79 470 10.077 81276 5.403 10.077 81 300 81 317 10.210 82 349 6.392 10.211 - 82 374 [10.296]a 83 043 7.422 10.295 - 83 035 [10.391]a 83 809 9.461 10.389 - - [10.416]a 84 010 10.350 10.417 - - 10.454 84 317 12.364 10.454 - - [10.468]a 84 430 13.467 10.467 - - 10.478 84 511 14.468 10.477 - - Part (b) 8.508 68 621 2.404 8.508 68 719 69 306 9.685 78 115 3.400 9.687 78 431 78 368 [10.165]a 81986 4.418 10.160 82 102 82 046 [10.391]a 83 809 5.375 10.396 83 977 83 893 [10.528]a 84 914 6.382 10.530 - 84 950 10.616 85 624 7.437 10.614 - - 10.709 86 374 9.430 10.708 - - 3. 2e → npe Part (a) 8.335 67 226 2.482 8.329 67 304c 67 246c 9.405 75 856 3.458 9.423 9.857 79 502 4.454 9.867 10.083 81 325 5.439 10.091 10.218 82 414 6.470 10.220 [10.296]a 83 043 7.421 10.300 10.358 83 543 8.553 10.357
Status: Postprint (Author’s version)
Table 2 (continued)
This work Literature Data
ERyd (eV) ERyd (cm
-1 ) n* £Fil (eV) [24] [26] [10.391]a 83 809 9.461 10.392 [10.416]a 84 011 10.350 10.419 10.438 84 188 11.383 10.440 [10.468]a 84 430 13.467 10.468 Part (b) 8.684 70 041 2.499 8.680 70 161c 70 083c 9.744 78 591 3.488 9.746 - - - - - - - - - - - - 10.623 85 680 7.545 10.619 10.675 86 100 8.530 10.673 10.711 86 390 9.492 10.711 10.738 86 608 10.475 10.738 10.758 86 769 11.438 10.759 10.777 86 922 12.652 10.775 4. 2e → nd(a1) Part (a) (8.947)b 72 162 2.920 8.942 67 304 70 083 9.659 77 905 3.923 9.656 9.980 80 494 4.916 9.980 10.139 81776 5.803 10.145 10.250 82 672 6.814 10.248 [10.328]a 83 300 7.955 10.326 Part (b) [9.256]a 74 655 2.917 9.261 70 161 72 957 9.975 80 454 3.916 9.975 10.311/314 83 164/188 4.969 10.312 10.470 84 445 5.891 10.473 [10.579]a 85 325 6.934 10.578 [10.642]a 85 833 7.864 10.645 5. 2e → nf(nde) Part (a) 9.038 72 896 3.006 9.040 72 957c 9.706 78 195 4.022 9.697 78 157 10.000 80 658 5.007 10.002 [10.165]a 81986 5.999 10.167 - - - - - - - - 10.380 83 720 9.136 10.376 10.408 83 946 10.039 10.407 (10.435)b 84 164 11.224 10.431 Part (b) [9.352] [75 429] [3.002] 10.018 80 801 4.015 10.018 80 758 10.319 83 228 5.006 10.321 [10.579] 85 398 7.047 10.585
Assignments, effective quantum numbers and energies EFit resulting from the fit to Eq. (5) are included. For the error estimated on the present
data, see text. (1 eV = 8065.545 cm-1 [34]).
a Data in square brackets: at least two possible assignments. For explanation see text. b Data in parentheses correspond to very weak signals.
c
Status: Postprint (Author’s version)
. Fig. 4(a) and (b) show the correlation of ln Tn as a function of ln(n) for the 2e → nsa1 and the 2e → npa1
transitions in CH3Br and Kr. For the atomic states we chose the ( 2
P3/2)nℓ and the ( 2
P1/2)nℓ' Rydberg states.
Within the manifold thus obtained the term value closest to that measured in CH3Br is selected. J is no longer a
good quantum number. By this way, most of the data overlap and this observation is a good support for the assignments proposed in the present work.
Table 2 reports 2e → npe transitions for Rydberg series converging to the 2E3/2 and 2
E1/2 ionic states.
They start at 8.335 eV (67 226 cm-1) and 8.684 eV (70 041 cm-1), respectively. These type of transitions were not considered in both reports of Hochmann et al. [24] and Causley and Russell [26]. In the latter work two transitions, i.e. at 8.337 eV (67 246 cm-1) and 8.689 eV (70 083 cm-1), were assigned to a vibronic transition (noticed by v2') in the (
2
E3/2)5p Rydberg state and to a 2e → 5d transition, respectively.
Like for the npa1 series, both series could nearly be characterized by a single average quantum defect δ
= 0.543 ± 0.024 and 0.533 ± 0.028 when Eq. (1) is used to fit the data. The 70 161 cm-1 [24] and the 70 083 cm-1 [26] transitions (shown in brackets in Table 2) fit in these series whereas the transition at 67 304 cm-1 [24] is compatible with the line observed at 67 226 cm-1 in the present work and assigned to 2e → 5pe converging to
2
E3/2.
Fig. 4. Correlation diagrams of ln(Tn) as a function of ln(n) for s- (a), p- (b), d- (c) and f-type (d) transitions in
Kr and CH3Br.
At this point it has to be stressed that (i) the variation of δ with n is as random as observed for the nsa1
Rydberg series and (ii) the averaged quantum defects of the npa1 and npe Rydberg states in CH3Br, i.e. δ ≈ 0.58
and δ ≈ 0.54, respectively, are much closer than in the case of CH3Cl where the corresponding values are δ =
0.67 and δ = 0.43 [7]. This indicates that the quantum defect associated with these orbitals both converge to the typical value δ ≈ 0.5 for np-type Rydberg orbitals. These become less discernible as the atomic number of the heteroatom increases, converging to a nearly "atomic" situation.
Hochmann et al. [24] and Causley and Russell [26] identified 2e → nd and 2e → nd' transitions to Rydberg states converging to the 2E3/2 and
2
E1/2 ionic states as already mentioned and shown in Table 2.
Status: Postprint (Author’s version)
the other hand, the latter tentatively assigned the 70 083 cm-1 and the 72 957 cm-1 lines to nd and nd' transitions. They argued by the near equality of the term values associated with these transitions and those measured in the Kr atom.
In the present work twelve transitions starting at 8.947 eV (72 162 cm-1) and at 9.256 eV (74 655 cm-1) could be associated with low quantum defect values equal on average to δ — 0.076 ± 0.018 and 0.085 ± 0.035. A reasonable interpretation is to assign them to nd series converging to the 2E3/2 and
2
E1/2 ionicstates. For these
same transitions, Fig. 4(c) shows a fairly good correlation between ln Tn for the 2e → nd transitions and the
corresponding transitions in the Kr atom.
Furthermore, a number of lines could be characterized by a very low value of the quantum defect, i.e. δ ≤ 0.00, and clearly distinct from the nd series identified previously. They can be assigned to 2e → nf Rydberg transitions on the basis of (i) the low and even negative δ value and (ii) the good correlation between the present results and those related to Kr in the ln Tn diagram shown in Fig. 4(d).
However, an alternative interpretation is possible for one or both series. As for the p series, the non-sphericity of the ionic core induces a splitting of the d series into one a1 series and two e series. The series
corresponding to a very low quantum defect could be assigned to one of these d series.
Only Causley and Russell [26] assigned the 78 157 cm-1 band on the basis of its term value. This line is assigned to a 2e → 5f transition measured at 78 195 cm-1 in the present work and corresponding to a 2e → 6f transition. The nf series should indeed start at 9.038 eV (72 896 cm-1) which agrees fairly well with the line reported at 72 957 cm-1 [26] and which is assigned to a 2e → 5d transition by these authors. Finally, a short Rydberg series starting at 10.018 eV (80 801 cm-1) has been assigned to 2e → nf transitions to Rydberg states converging to the 2E1/2 ionic state. This energy is in good agreement with the line reported earlier at 80 758 cm
-1
[26].
To find a support to this interpretation of the CH3Br photoabsorption spectrum, we measured the
corresponding data for CD3Br whose spectrum is reproduced in Fig. 3 between 6 and 12 eV photon energy. The
transition energies are listed in Table 3.
Before any assignment can be made by using the Rydberg formula (1), the values of the ionization limits and those of the quantum defects are required. The former quantity has been measured by photo-electron spectroscopy. The He(I) photoelectron spectrum of CD3Br
+
(X~2E) band has been recorded with 1 meV increments over 1024 channels. A mixture of Ar/Kr/Xe is introduced simultaneously for electron energy scale calibration. The lowest ionization energies, i.e. IEad(X~2E3/2) = 10.565 ±0.004 eV and IEad(X~2E1/2) = 10.902 ±
0.004 eV have been determined with respect to the three rare gas ions doublets [32]. These two values of the convergence limits will be used throughout for the analysis of the CD3Br photoabsorption spectrum.
A long Rydberg series is observed for the 2e → nsai transitions, where the principal quantum number n — 5-16 is observed for both series converging respectively to X~2E3/2 [part (a) in Table 3] and X~2E1/2 [part (b) in
Table 3]. For both components the quantum defects δ = 1.077 and δ = 1.070 are determined, as averaged over about 11 transitions.
The only known UV spectroscopic work on CD3Br has been reported by Felps et al. [22], but this study
was limited to the 151-180 nm (55 550-66 220 cm-1) spectral region. In this range two vibrationless Rydberg transitions take place, i.e. at 56 285 and 59 255 cm-1 [22] which have to be compared with 56 305 and 59 282 cm-1 measured in this work (see Table 3). The comparison between the data for the non-deuterated and the deuter-ated species provides us with stronger support for the proposed assignments in CH3Br.
As is the case of CH3Br, the photoabsorption spectrum of CD3Br shows long 2e → npa1 and 2e → npe
series converging to both 2E3/2 and 2E1/2 spin-orbit components of the ground ionic state. For the npa1 series,
transitions are partially observed between n = 5-22. The 2e → npe is shorter and is detected up to n = 13. Averaged quantum defects δ = 0.58 and δ = 0.62, compared to 0.59 and 0.58 in CH3Br, are observed for the npa1
series. For the npe series the corresponding values are δ = 0.50 and δ = 0.53 (compared to 0.54 and 0.53 for CH3Br).
Contrarily to the CH3Br spectrum, the 2e → nd transitions in CD3Br give rise to longer and better
defined Rydberg series characterized by average quantum defects δ = 0.080 and δ = 0.147. The corresponding quantities in CH3Br were found to be δ = 0.076 and 0.085. The fairly good agreement between these values tends
to support the classification and assignments suggested for the Rydberg lines in the spectrum of CH3Br (see
Status: Postprint (Author’s version)
Table 3 : Vibrationless Rydberg transitions as observed in CD3Br in the present work for both spin-orbit
components: parts (a) and (b) converge to the 2E3/2 and 2
E1/2 ionic states, respectively
ERyd (eV) EKyd (cm-1) n* Efit(eV)
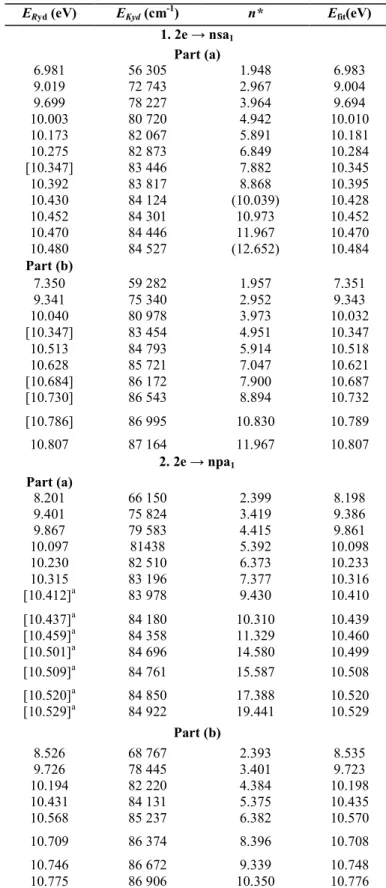
1. 2e → nsa1 Part (a) 6.981 56 305 1.948 6.983 9.019 72 743 2.967 9.004 9.699 78 227 3.964 9.694 10.003 80 720 4.942 10.010 10.173 82 067 5.891 10.181 10.275 82 873 6.849 10.284 [10.347] 83 446 7.882 10.345 10.392 83 817 8.868 10.395 10.430 84 124 (10.039) 10.428 10.452 84 301 10.973 10.452 10.470 84 446 11.967 10.470 10.480 84 527 (12.652) 10.484 Part (b) 7.350 59 282 1.957 7.351 9.341 75 340 2.952 9.343 10.040 80 978 3.973 10.032 [10.347] 83 454 4.951 10.347 10.513 84 793 5.914 10.518 10.628 85 721 7.047 10.621 [10.684] 86 172 7.900 10.687 [10.730] 86 543 8.894 10.732 [10.786] 86 995 10.830 10.789 10.807 87 164 11.967 10.807 2. 2e → npa1 Part (a) 8.201 66 150 2.399 8.198 9.401 75 824 3.419 9.386 9.867 79 583 4.415 9.861 10.097 81438 5.392 10.098 10.230 82 510 6.373 10.233 10.315 83 196 7.377 10.316 [10.412]a 83 978 9.430 10.410 [10.437]a 84 180 10.310 10.439 [10.459]a 84 358 11.329 10.460 [10.501]a 84 696 14.580 10.499 [10.509]a 84 761 15.587 10.508 [10.520]a 84 850 17.388 10.520 [10.529]a 84 922 19.441 10.529 Part (b) 8.526 68 767 2.393 8.535 9.726 78 445 3.401 9.723 10.194 82 220 4.384 10.198 10.431 84 131 5.375 10.435 10.568 85 237 6.382 10.570 10.709 86 374 8.396 10.708 10.746 86 672 9.339 10.748 10.775 86 906 10.350 10.776
Status: Postprint (Author’s version) Table 3 (continued)
ERyd (eV) ERyd (cm-1) n* Efit(eV)
3. 2e → npe Part (a) 8.318 68 089 2.461 8.314 9.431 76 066 3.464 9.427 9.878 79 621 4.450 9.880 10.113 81 567 5.486 10.108 10.243 82 615 6.500 10.239 10.324 83 269 7.513 10.320 10.379 83 712 8.553 10.375 [10.412/.417]a 83 978 9.430 10.413 - - - - - - - - - - - - - - - - [10.501]a 84 696 14.580 10.500 [(10.509)]a,b 84 761 15.587 10.508 - - - - - - - - (10.529)b 84 922 19.441 10.529 Part (b) 8.643 69 711 2.454 8.651 9.770 78 800 3.467 9.764 10.215 82 390 4.450 10.217 10.574 85 285 6.440 10.576 10.716 86 430 8.552 10.715 10.750 86 705 9.461 10.750 10.777 86 922 10.433 10.777 4. 2e → nd(a1) Part (a) 9.678 78 058 3.917 9.677 10.003 80 680 4.920 10.002 10.174 82 058 5.899 10.176 10.278 82 898 6.885 10.280 [10.347]a 83 454 7.900 10.348 [10.392]a 84 817 8.868 10.394 [10.452]a 84 301 10.973 10.451 [10.470]a 84 446 11.967 10.469 [10.484]a 84 559 12.960 10.483 Part (b) 9.996 80 623 3.875 10.014 10.334 83 349 4.894 10.339 [10.617]a 85 632 6.909 10.617 [10.684]a 86 172 7.900 10.685 [10.730]a 86 543 8.894 10.731 [10.762]a 86 801 9.858 10.764 [10.786]a 86 995 10.877 10.788 10.804 87 140 11.783 10.806 10.819 87 261 12.803 10.820 [10.831]a 87 358 13.843 10.832 5. 2e → nf(nde) Part (a) 9.716 78 364 4.003 9.710 10.021 80 825 5.001 10.018
Status: Postprint (Author’s version) Table 3 (continued)
ERyd (eV) ERyd (cm-1) n* EFit (eV)
10.191 82 196 6.031 10.185 10.286 82 962 6.983 10.286 10.397 83 857 8.999 10.397 10.431 84 132 10.071 10.429 [10.452]a 84 301 10.973 10.452 [10.470]a 84 446 11.967 10.470 [10.484]a 84 559 12.960 10.484 - - - - - - - - 10.511 84 777 15.873 10.511 Part (b) 10.016 80.784 3.919 10.047 10.339 83 390 4.916 10.356 [10.513]a 84 793 5.914 10.523 [10.617]a 85 632 6.909 10.623 [10.684]a 86 172 7.900 10.689 [10.730]a 86 543 8.894 10.734 [10.762]a 86 801 9.858 10.766 [10.786]a 86 995 10.877 10.789 [10.807]a 87 167 11.967 10.807 10.821 87 277 12.960 10.821 [10.831]a 87 358 13.843 10.832
Assignments, effective quantum numbers and energies EFit resulting from the fit to Eq. (5) are included (1 eV = 8065.545 cm-1 [34]). a Data in square brackets: at least two possible assignments. For explanation see text.
b
Data in brackets: weak signals.
On the basis of the low and often negative values of δ, Table 3 shows at least a series of 9 to 10 lines which consistently pertain to nf-type Rydberg series or to another d series converging to the 2E3/2 ionic state. The
series converging to 2E1/2 is much less certain because it overlaps to a large extent the other 2e→ nd series.
4.4. The low energy region: Exchange versus spin-orbit interactions In the low n regime, the (2e)3(nla1) configuration leads to a 3
E and a 1E states, which are separated by an interval equal to 2K where K is the exchange integral. When the spin-orbit coupling is switched on, the 3E state is further split into two E states, one A1 state and one A2 state. If the C3v field for these Rydberg states is
approximated as nearly cylindrical (C∞v), then the projection of the total electronic angular momentum on the
cylinder axis is a constant of motion. One of the E states deriving from the 3E corresponds to Ω = 2, the other one to Ω = 1, whereas Ω = 1 applies for the 1E. When n increases the singlet-triplet splitting decreases as (n*)-3 so that the spin-orbit coupling constant A becomes comparable with K. The spin-orbit operator Hso is able to couple the 1E (Ω = 1) and 3E (Ω = 1) substrates. Their mixing increases with n to reach eventually a 1:1 ratio corresponding to Hund's case (c). In this latter regime, two series with the same quantum defect should converge respectively to CH3Br
+
X~2E3/2 and X
~2
E1/2.
Out of the 5 states corresponding to the (2e)3(nla1) configuration, the dipolar transition probability from
the ground state X~1 A1 of CH3Br will be shared between both Ω = 1 states with an intensity ratio governed by
the K/A ratio. In pure Hund's case (c) the intensity ratio is equal to 1. In pure Hund's case (a), the transition to 3E is forbidden.
In Hund's case (a) the Rydberg states energies are given by Eqs. (2) and (3):
Status: Postprint (Author’s version)
it is the average ionization energy as defined by
Table 4 : Calculated quantum defects δ' and δ" obtained by fitting Eq. (5) to the data related to the nsa1, npa1;
npe, nd and nf series in CH3Br and CD3Br, standard deviation (σ) between the experimental and fitted energies
(meV) and values of the exchange coupling element K for n = 3 in meV (cm-1)
nsa1 npa1 npe nd nf
CH3Br δ' 1.076 0.616 0.552 -0.0003 0.025 δ" 1.016 0.579 0.470 -0.0006 -0.053 σ 4 3 6 8 6 K(n = 3) 110(887) 36 (290) 72 (581) <0.2 (1.6) 39 (314) CD3Br δ' 1.067 0.603 0.542 0.085 0.010 δ" 1.026 0.603 0.542 0.085 0.010 σ 6 4 3 5 9 K(n = 3) 75 (605)
As the triplet state is more stable than the singlet, δ')δ".
Eq. (5) below is valid in the whole coupling range. It takes into account both exchange and spin-orbit interactions.
Eq. (5) reduces to Hund's case (a) when K >> A (small n) and to Hund's case (c) when K << A (large n). In this latter case, inserting (2) and (3) into (5) and expanding in powers of n-1 leads to two Rydberg series:
with δ = (δ' + δ")/2. Two series with the same average quantum defect converge to the two spin-orbit components of the ionic state.
We fitted the energies of all the observed Rydberg series to Eq. (5) by assuming no n variation of the δ' and δ" quantum defects. The spin-orbit coupling constant A has been taken as half the ionic 2E3/2
-2
E1/2 splitting,
i.e. 159.5 meV [30] for CH3Br +
and 168.5 meV for CD3Br +
[32]. The fitted energies (labeled as Efit) are listed in
Tables 2 and 3. Table 4 summarizes the results.
At this point some aspects have to be stressed, (i) The fit of Eq. (5) with constant quantum defects, i.e. with only two free parameters, seems appropriate to account for most of the experimental data, (ii) We attempted to apply the same treatment to all transition types, i.e. nsa1, npa1, npe, nd and nf. The coupling scheme seems to
hold for all these transitions at least in CH3Br. (iii) Already for n = 6, CH3Br and CD3Br behave as pure Hund's
case (c)-systems. This would likely be the reason why only tiny differences exist between the fittings by Eq. (5) and its simplified form Eq. (1). (iv) Quite surprisingly,the 3E1-1E1 coupling constant K shows a non-negligible
change with isotopic substitution. For 5sa1 the constant K is equal to 110 meV in CH3Br whereas K= 75 meV in
CD3Br. This effect is not observed in CH3C1 and CD3C1 where K= 55 and 56 meV, respectively, for 3sa1 [7].
Status: Postprint (Author’s version) 5. Conclusions
The vacuum UV photoabsorption spectrum of CH3Br has been reexamined in detail between 6 and 25
eV photon energy at medium resolution. A few weak diffuse absorption bands have been observed in the 12-24 eV photon energy range. These were essentially assigned to 3 s Rydberg states, members of series converging to 3a1-1, 1e-1, and higher ionization limits. Very likely many electron transitions are involved in the bands observed
above 18.0 eV [27, 35].
In the 6-12 eV photon energy range, both in CH3Br and CD3Br, as observed at medium and high
resolution, many lines spread between 7 and 10.8 eV and are assigned to Rydberg series converging to the spin-orbit split X~2E3/2-2E1/2 ground state of CH3Br+. Vibration-less Rydberg transitions have been classified on the
basis of their quantum defect δ.
First, using the simple Rydberg formula, δ is observed to be reasonably constant for one orbital-type transition. Five Rydberg series for each spin-orbit component have been detected: nsa1 (δ = 1.067 and 1.032),
npa1 (δ = 0.588 and 0.579), npe (δ = 0.543 and 0.533), nd (δ = 0.076 and 0.085) and nd and/or nf (δ = -0.047 and
-0.023).
To confirm the present interpretation, the photoabsorption spectrum of CD3Br has been analyzed for the
first time. Assignments were made by the same procedure. Also in this molecule the quantum defects remain fairly constant for one orbital-type transition. It has been noticed that its value for npa1 (δ = 0.58 and 0.62) and
for npe (δ = 0.50 and 0.53) are very close, asobserved in CH3Br also. This is in contrast to our observations in
CH3Cl [7]. The isotopic shift on the vibronic transition allowed us to observe longer nd and nf series. In a second step, the combined effects of the exchange interaction, leading to singlet-triplet splitting, and of the spin-orbit coupling are considered. Good quality fits of Eq. (5) to the experimental data could be obtained with constant quantum defects in the whole observed n range. Already Rydberg states with n = 6 correspond to pure Hund's case (c).
Acknowledgements
We are indebted to the University of Liège, the Freie Universität Berlin and the Bundesministerium fur Fors-chung und Technologie for financial support. R.L. and B.L. gratefully acknowledge the European Community for its support through its TMR programme (Contract EU-HPRI-1999CT-00028). H.B. acknowledges the Fonds den Chemischen Industrie for financial support. The generous financial support of the Direction de la Recherche Scientifique de la Communauté Française de Belgique through an Action de Recherche Concertée (A.R.C.) is gratefully acknowledged. We would finally acknowledge Dr. Gert Reichardt for his kindness and always very precious experience in maintaining the 3m-NIM monochromator in the best operating conditions.
References
[1] O.N. Sing, P. Fabian, in: P. Febian, O.N. Singh (Eds.), Reactive Bromine compounds in The Handbook of Environmental Chemistry. Part 4E: Reactive Halogen Compounds in the Atmosphere, Springer Verlag, Berlin, 1999, p. 3.
[2] S.A. Montzka, P.J. Fraser, Controlled substances and other source gases, in: A.N. Ajevon, D.L. Albritton, G. Mégie, R. Watson (Ed.), Scientific Assessment of Ozone Depletion: 2002, Global Ozone Research and Monitoring Project, Rep. No. 47, World Meteorological Organization, Geneva, 2003 (Chapter 1).
[3] R. Locht, J. Momigny, Int. J. Mass Spectrom. Ion Proc. 71 (1986) 141. [4] R. Locht, E. Rühl, J. Momigny, H. Baumgärtel, Chem. Phys. 117 (1987) 305.
[5] R. Locht, J. Momigny, in: F. Lahmani (Ed.), Photophysics and Photochemistry above 6 eV, Elsevier, Amsterdam, 1985, p. 171. [6] R. Locht, B. Leyh, A. Hoxha, D. Dehareng, H.W. Jochims, H. Baumgartel, Chem. Phys. 257 (2000) 283.
[7] R. Locht, B. Leyh, A. Hoxha, H.W. Jochims, H. Baumgärtel, Chem. Phys. 272 (2001) 259.
[8] R. Locht, B. Leyh, A. Hoxha, D. Dehareng, H.W. Jochims, H. Baumgärtel, Chem. Phys. 272 (2001) 277.
[9] R. Locht, B. Leyh, A. Hoxha, D. Dehareng, K. Hottmann, H.W.Jochims, H. Baumgärtel, Chem. Phys. 272 (2001) 293. [10] J. Momigny, R. Locht, Chem. Phys. Lett. 211 (1993) 161.
Status: Postprint (Author’s version)
[12] R. Locht, B. Leyh, K. Hottmann, H. Baumgärtel, Chem. Phys.220 (1997) 229.
[13] A. Hoxha, R. Locht, B. Leyh, D. Dehareng, K. Hottmann, H. Baumgärtel, Chem. Phys. 256 (2000) 239.
[14] A. Hoxha, R. Locht, B. Leyh, D. Dehareng, K. Hottmann, H.W. Jochims, H. Baumgärtel, Chem. Phys. 260 (2000) 237. [15] A. Hoxha, R. Locht, A.J. Lorquet, J.C. Lorquet, B. Leyh, J. Chem. Phys. 11l (1999) 9259.
[16] K.M. Weitzel, F. Güthe, J. Mähnert, R. Locht, H. Baumgärtel, Chem. Phys. 201 (1995) 287. [17] F. Güthe, R. Locht, B. Leyh, H. Baumgärtel, K.M. Weitzel, J. Phys. Chem. A 103 (1999) 8404. [18] W. Zhang, G Cooper, T. Ibuki, CE. Brion, Chem. Phys. 137 (1989) 391, and references therein. [19] W. Zhang, G Cooper, T. Ibuki, CE. Brion, Chem. Phys. 151 (1991) 343, and references therein. [20] W. Zhang, G Cooper, T. Ibuki, CE. Brion, Chem. Phys. 153 (1991) 491, and references therein. [21] J.W. Au, GR. Barton, CE. Brion, Chem. Phys. 221 (1997) 151, and references therein. [22] S. Felps, P. Hochmann, P. Brint, S.P. McGlynn, J. Mol. Spectrosc. 59 (1976) 355. [23] W.C. Price, J. Chem. Phys. 4 (1936) 539.
[24] P. Hochmann, P.H. Templet, H.T. Wang, S.P. McGlynn, J. Chem. Phys. 62 (1975) 2588. [25] W.S. Felps, K. Rupnik, S.P. McGlyn, J. Phys. Chem. 95 (1991) 639.
[26] G.C. Causley, B.R. Russell, J. Chem. Phys. 62 (1975) 848.
[27] T.N. Olney, G Cooper, W.F. Chan, GR. Burton, CE. Brion, K.H. Tan, Chem. Phys. 218 (1997) 127.
[28] G Reichardt, T. Noll, I. Packe, P. Rotter, J.-S. Schmidt, W.Gudat, Nucl. Instr. and Meth. A 467-468 (2001) 458. [29] R. Locht, B. Leyh, W. Denzer, G Hagenow, H. Baumgartel, Chem. Phys. 155 (1991) 407.
[30] L. Karlsson, R. Jadrny, L. Mattsson, F.T. Chau, K. Siegbahn, Phys. Scripta 16 (1977) 225. [31] W. Von Niessen, L. Asbrink, G Bieri, J. Electr. Spectr. Rel. Phennom. 26 (1982) 173. [32] R. Locht, E. Gridelet, B. Leyh, D. Dehareng, to be published.
[33] T.N. Olney, W.F. Chan, G Cooper, CE. Brion, K.H. Tan, J. Electr. Spectr. Rel. Phenom. 66 (1993) 83. [34] P.J. Mohr, B.N. Taylor, J. Phys. Chem. Ref. Data 28 (1999) 1713.
[35] R. Locht, B. Leyh, K. Hottmann, H.W. Jochims, H. Baumgärtel, to be published.


![Table 2 : Vibrationless Rydberg transitions as observed for CH 3 Br in the present work and in previous reports [24] and [26] for both spin-orbit components: parts (a) and (b) converge to the 2 E 3/2 and 2 E 1/2 ionic states, respecti](https://thumb-eu.123doks.com/thumbv2/123doknet/5607709.135057/8.918.144.848.136.1108/vibrationless-rydberg-transitions-observed-previous-components-converge-respecti.webp)