Any correspondence concerning this service should be sent
to the repository administrator:
[email protected]
This is an author’s version published in: http://oatao.univ-toulouse.fr/20950
To cite this version:
Vanneste, Heleen
and De Vleeschouwer, François
and
Bertrand, Sébastien and Martínez-Cortizas, Antonio and
Vanderstraeten, Aubry and Mattielli, Nadine and Coronato,
Andrea and Piotrowska, Natalia and Jeandel, Catherine
and Le Roux, Gaël
Elevated dust deposition in Tierra del
Fuego (Chile) resulting from Neoglacial Darwin Cordillera
glacier fluctuations. (2016) Journal of Quaternary Science,
31 (7). 713-722. ISSN 02678179
Official URL:
https://doi.org/10.1002/jqs.2896
Open Archive Toulouse Archive Ouverte
OATAO is an open access repository that collects the work of Toulouse
researchers and makes it freely available over the web where possible
Elevated
dust deposition in Tierra del Fuego (Chile)
resulting
from Neoglacial Darwin Cordillera
glacier
fluctuations
HELEEN VANNESTE,1,2* FRANSCOIS DE VLEESCHOUWER,1,2S◆EBASTIEN BERTRAND,3ANTONIO MARTI´NEZ-CORTIZAS,4 AUBRY VANDERSTRAETEN,5NADINE MATTIELLI,5ANDREA CORONATO,6NATALIA PIOTROWSKA,7
CATHERINE JEANDEL8and GAËL LE ROUX1,2
1Universit◆e de Toulouse, INP, UPS, EcoLab (Laboratoire Ecologie Fonctionnelle et Environnement), ENSAT, Avenue de
l’Agrobiopole, 31326 Castanet Tolosan, France
2CNRS, EcoLab, 31326 Castanet Tolosan, France
3Renard Centre of Marine Geology, Ghent University, Krijgslaan 281 S8, Gent, 9000, Belgium
4Departamento de Edafoloxı´a e Quı´mica Agrı´cola, Facultade de Bioloxı´a, Universidade de Santiago de Compostela, Campus Sur
E-15782, Santiago de Compostela, Spain
5Department of Earth and Environmental Sciences, DSTE, CP 160/02, Universit◆e Libre de Bruxelles, Avenue F. D. Roosevelt, 50,
Brussels 1050, Belgium
6CONICET-CADIC, B. Houssay 200, 9410 Ushuaia, Tierra del Fuego, Argentina
7Department of Radioisotopes, Institute of Physics, Silesian University of Technology, Gliwice, Poland
8LEGOS (CNRS/CNES/IRD/Universit◆e de Toulouse), Observatoire Midi-Pyr◆en◆ees, 14 Avenue Edouard Velin, 31400,
Toulouse, France
ABSTRACT: Atmospheric mineral dust is intrinsically linked with climate. Although dust flux variability on glacial–interglacial timescales is well documented, Holocene dust records remain scarce. To fill this gap, we conducted elemental, isotopic and sedimentological analyses on a peat core from the Karukinka Natural Park in Tierra del Fuego. An 8000-year-old mineral dust record was extracted indicating three periods of elevated dust deposition: (i) 8.1–7.4 cal ka BP, (ii) 4.2 cal ka BP and (iii) 2.4–1.4 cal ka BP. The two oldest peaks are related to volcanic eruptions of the Hudson and Monte Burney volcanoes, respectively. The most recent dust peak, however, has a rare earth element and neodymium isotopic composition that resembles the geochemical signature of outwash plain sediments from the Darwin Cordillera. Since the timing of this dust peak corresponds to a period of glacier retreat between Neoglacial advances III and IV, we infer that Holocene aeolian dust fluxes in southern Patagonia are mostly driven by glacial sediment availability. Our results underline the important role of glaciers in producing aeolian dust in high-latitude regions, and they imply that the current retreat of glaciers worldwide may result in elevated atmospheric dust loads.
KEYWORDS: dust; neodymium isotopes; Neoglacial; peat archive; Tierra del Fuego.
Hemisphere at present-day (Prospero et al., 2002; Gaiero et al., 2003). The capacity of this dust engine, however, has varied over time. Large dust plumes reached as far as Antarctica during glacial periods while dust fluxes signifi-cantly dropped after the Last Glacial Maximum (19–23 ka ago; Iriondo, 2000; Delmonte et al., 2008; Sugden et al., 2009). The shifts in palaeodust accumulation in this region are partly related to environmental changes that occurred over time, altering dust availability. During glacial periods, Patagonian glaciers which flowed eastwards were mainly terminating on outwash plains and large areas of the continental shelf were exposed because of lower sea levels (Kaiser and Lamy, 2010). Hence, more sediment could be entrained by the westerly winds and transported to the South Atlantic Ocean and beyond (Sugden et al., 2009). Sea level rise and the expansion of Nothofagus forests at the start of the Holocene (McCulloch and Davies, 2001; Borromei et al., 2014) probably contributed to the decline in dust loadings from Patagonia. However, besides particle availability, the presence and persistence of wind is equally essential in dust production. Patagonia’s climate is mainly controlled by the positioning of the Southern Westerly Wind belt, which not only brings strong surface winds year-round, but also gen-erates a dramatic precipitation gradient as its airflow is perturbed by the Andes (Schneider et al., 2003; Garreaud et al., 2013). Western Patagonia features a hyper-humid climate supporting extensive forests, peatlands, major rivers
Introduction
Today there is an overall awareness of the significance of mineral dust in the Earth’s system. Its impact ranges from changing the overall planetary radiation balance by scattering and absorbing solar and terrestrial radiation (e.g. Painter et al., 2007; Yoshioka et al., 2007), to fertilizing surface oceans and hence potentially altering the global carbon cycle (e.g. Jickells et al., 2005; Maher et al., 2010). To understand the processes behind dust production and the consequences of dust flux fluctuations on the environment, more detailed records of past dust production and deposition are crucially needed. Thus far, research efforts have mainly focused on dust flux changes at glacial–interglacial transitions, during which dust loadings were up to ⇠25 times current amounts (Lambert et al., 2008; Winckler et al., 2008). However, although changes in dust deposition during the Holocene may have been much smaller, the dust cycle plays a significant role in today’s climate and environment (Griffin et al., 2001). Hence, studying dust emission variability since the last glaciation is important to anticipate near future climatic changes.
The extra-Andean Patagonian region is considered one of the most important atmospheric dust sources in the Southern ⇤Correspondence to: H. Vanneste, Laboratoire de G◆eologie de Lyon (LGL-TPE), Ecole Normale Sup◆erieure de Lyon, 69364 Lyon, France.
tubes on the field for shipment to France. The cores were sliced frozen at a 1-cm resolution using a stainless steel band saw at EcoLab (Toulouse, France). Subsequently, each slice was cleaned with MilliQ water, edges removed and subsampled for further analyses (Givelet et al., 2004; De Vleeschouwer et al., 2010).
This study also makes use of top soils, river, moraine, aeolian and outwash plain sediments collected in southern Patagonia during various expeditions in 2005, 2009, 2013 and 2014. Sampling sites are shown on Fig. 1b and detailed in Table 1. Before sampling the top soils, the outer 10 cm was removed from the exposed surface to avoid contamination or modification by present-day materials/processes.
Chronology
Eight plant macrofossil samples were selected for radiocar-bon analyses following established protocols (Mauquoy et al., 2004). All samples were prepared at the GADAM centre (Gliwice, Poland) where each sample was washed using the acid–alkali–acid extraction protocol, dried, com-busted and graphitized (Piotrowska, 2013). Radiocarbon concentrations were measured and 14C ages were
calcu-lated at the Rafter Radiocarbon Laboratory (Lower Hutt, New Zealand) and at DirectAMS Laboratory (Bothell, WA, USA) (Donahue et al., 1990). Details on the dated material, radiocarbon ages and the obtained age–depth model (Supporting Information, Fig. S1) were published in De Vleeschouwer et al. (2014).
Bulk density and grain size
The density of each sample was determined by measuring the volume using a vernier caliper and subsequently weighing the freeze-dried sample.
The grain size distribution was determined on the water-insoluble inorganic fraction of the bulk peat samples using a Horiba LA-950 laser grain size analyser. This inorganic fraction was obtained by ashing bulk peat samples in a furnace at 550 ˚C for 5 h. As pseudo-minerals (i.e. salts) may form during this ashing process, each sample was submersed in MilliQ water to dissolve them, and subjected briefly to ultrasound to separate the particles. The grain size distribu-tion of the samples was characterized by 70 size classes. To have enough material per sample, five samples were grouped together, resulting in a sample resolution of 5 cm.
Major and trace element analyses
A total of 92 peat samples were processed for element geochemistry. First, each sample was freeze-dried and powdered using an agate mortar. Subsequently, 100 mg of bulk sample was digested in Teflon vials on hot plates using an HNO3 HF mixture as described in De Vleeschouwer
et al. (2014). Major element concentrations were deter-mined by inductively coupled plasma optical emission spectroscopy (IRIS Intrepid II at EcoLab, Toulouse, France) while trace element concentrations were determined by quadrupole inductively coupled plasma mass spectrometry (Agilent Technologies 7500ce, Toulouse, France) at the Observatoire Midi Pyr◆en◆ees (Toulouse, France). The ICP-MS device was calibrated using a synthetic multi-element standard, which was run every eight samples, while an In Re solution was used as an internal standard. The analytical performance was assessed by analysing three international certified reference materials: SRM1547 (peach leaves), SRM1515 (apple leaves) and GBW-07063 (bush branches and leaves). The results are reported in Table S1. and numerous outlet glaciers from the Northern and Southern
Patagonian and Darwin Cordillera ice fields. Eastern Patago-nia features an arid climate characterized by steppe vegeta-tion. Numerous studies argue that these westerlies have changed in strength and/or position through the Quaternary (e.g. Moreno et al., 2009; Lamy et al., 2010; Fletcher and Moreno, 2012; Kohfeld et al., 2013; Bertrand et al., 2014). Accordingly, palaeo dust records in Patagonia may not only provide information about particle availability but they may also be potentially used to unravel past atmospheric circulation.
Peatlands are increasingly used to reconstruct past varia-tions in atmospheric dust deposition and associated palae-oenvironmental conditions, mostly for the past ⇠15 ka (e.g. Shotyk et al., 2002; De Vleeschouwer et al., 2009; Le Roux et al., 2012). This is partly due to the potential high temporal resolution that can be achieved provided reliable dating and high-resolution sampling. Furthermore, peatlands consist in their essence purely of organic material once the ombrotrophic stage in peatland development has been reached (Martini et al., 2006). At this stage inorganic particles only enter the bog via atmospheric deposition, therefore making peatlands a favourable aeolian dust archive. Trace elemental and neodymium isotopic analyses of peat records have been used to identify some important shifts in dust deposition related to climatic changes world-wide, such as the effect of Sahara aridification on dust loading over Europe (Le Roux et al., 2012), El Ni~no– Southern Oscillation (ENSO)-controlled Australian dust transport to New Zealand (Marx et al., 2009) and westerly intensification during the Antarctic Cold Reversal in Tierra del Fuego (Vanneste et al., 2015).
The main goal of this study is to identify and quantify changes in atmospheric dust deposition in southern South America, as inferred from a peat core collected at Karukinka Natural Park (Tierra del Fuego), and determine its link to palaeoenvironmental and climate changes over the last 8000 years. Major and rare earth elements as well as neodymium isotopic compositions are used in combination with principal component analysis to identify the source(s) of the dust in the record. Based on the identified dust source(s), shifts in aeolian dust deposition are interpreted in terms of climate-related changes in the environment. Furthermore, the high-latitude location of the peatland allows us to assess the dust cycle in a cold climate region, which is underrepre-sented in aeolian research.
Methods
Site
description and sampling
Karukinka bog (53.86˚S, 69.58˚W) is an ombrotrophic mire (De Vleeschouwer et al., 2014) located in the Karukinka Natural Park, a protected area managed by the Chilean branch of the Wildlife Conservation Society, on Isla Grande de Tierra del Fuego (Fig. 1). The sampling site is located at 245 m a.s.l., on a plateau flanking the main valley, 20 m above the river bed and experiences a mean annual tempera-ture and precipitation of, respectively, 5 ˚C and 600 mm a 1
(Hijmans et al., 2005). Deciduous forests surround the bog and are dominated by Nothofagus pumilio.
Peat cores were recovered from Karukinka bog in 2012 by means of a stainless steel Russian corer of 10 cm internal diameter down to 398.6 cm depth and a smaller Russian corer of 5 cm internal diameter down to 449.6 cm (both core heads are 50 cm long). All core sections were photo-graphed, described, and packed in plastic film and PVC
UNCORRECTED PROOFS
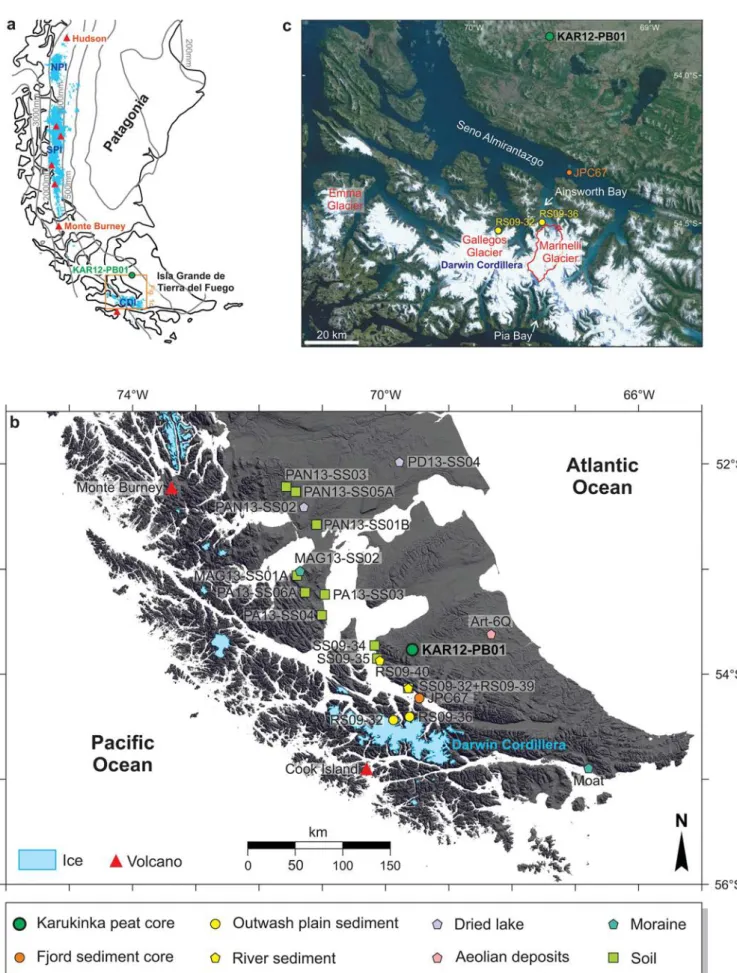
Figure 1. a. Precipitation map of southern South America with location of peat core KAR12-PB01, Hudson and Monte Burney volcanoes, Patagonian ice fields (northern, NPI; and southern, SPI) and Cordillera Darwin Ice field (CDI). Precipitation data were obtained from the worldclim database (Hijmans et al., 2005). b. Topographic map of southern Patagonia with the location of peat core KAR12-PB01, topsoil, river, moraine, dry lake, aeolian and outwash plain sediment samples (see legend) and fjord sediment core JPC67 (Boyd et al., 2008). c. Natural colour landsat image (LandsatLook) of study area showing the location of glaciers discussed in the text as well as the peat core KAR12-PB01 and outwash plain sediment samples (RS09-32 and RS09-36).
spectrometer (Finnigan-MAT 261, static mode) at Observa-toire Midi Pyr◆en◆ees (Toulouse, France), whereas 13 peat samples were measured using a Nu Plasma I multi-collector inductively coupled plasma mass spectrometer (Nu 015) at Universit◆e Libre de Bruxelles (Brussels, Belgium) (see Support-ing Information for details). The reproducibility of both methods was assessed by four replicates (Table S3).
Statistical analyses
Principal component analysis (PCA) was performed on the elemental concentrations in the bulk peat samples from Karukinka bog. Based on the co-variance between the chemi-cal elements, a number of principal components are extracted explaining a given proportion of the total variance within the dataset. Each component groups elements that show similar variations, i.e. similar concentration–depth profiles. Before analysis all data were first log transformed (log10) and subsequently converted to z-scores [z à (Xi XAvg)/Xstd where
Xi is the concentration of element i, Xavg is the average
concentration of all samples for element i and Xstd is the
respective standard deviation] to account for the composi-tional nature of the data. Both transformations rescale the data and hence open the closed system of concentrations (Baxter, 1995, 1999; Eriksson et al., 1999). A varimax rotation was applied to optimize the loadings of variables in the compo-nents, i.e. to explain the variance in the dataset by more homogeneous components.
To extract the main particle size distribution modes in the record, hierarchical cluster analysis (HCA) was performed using as variables the 70 grain size classes. This statistical analysis allowed us to group together samples (cases) with a similar grain size distribution. Both PCA and HCA were performed using SPSS 20 statistical software.
Estimation of dust accumulation rates
The dust accumulation rate (AR; g m 2a 1) was calculated
based on the REE concentrations measured in bulk peat Table 1. Patagonian soil and sediment sample description, location and neodymium isotopic composition.
Sample ID Sample
type
Latitude (˚S) Longitude (˚W) 143Nd/144Nd 2s e
Nd 2s
Art4-6Q Poorly sorted very fine sand near Arturo Lake (silty sands 6; Coronato et al., 2011)
53.72 68.32
MAG13-SS01A Top soil 53.14 71.40
PA13-SS03 Top soil 53.34 70.96
PA13-SS04 Top soil 53.52 70.95 0.512498 0.000008 2.7 0.2
PA13-SS06A Top soil 53.32 71.27 0.512470 0.000013 3.3 0.3
PAN13-SS01B Top soil 52.68 71.09 0.512738 0.000012 2.0 0.2
PAN13-SS02 Sediments from dry lake 52.50 71.29
PAN13-SS03 Top soil 52.36 71.42
PAN13-SS05A Top soil 52.32 71.57 0.512647 0.000007 0.2 0.1
PD13-SS04 Sediments from partly dried lake, Laguna Ana 52.07 69.78
MAG13-SS02 Fine silt, moraine deposit 53.12 71.35 0.512490 0.000011 2.9 0.2 Moat-27 Buried epipedon above till 54.96 66.79
Moat-30 Till 54.96 66.79 0.512486 0.000006 3 0.1
RS09-32 Braided river sediment from outwash plain; Gallegos Glacier
54.514 69.872 0.512127 0.000007 10 0.1 RS09-36 Braided river sediment from outwash plain;
Marinelli Glacier
54.49 69.62 0.512644 0.000012 0.1 0.2 RS09-39 River sediment Rio Parallelo 54.22 69.64 0.512403 0.000010 4.6 0.2 RS09-40 River sediment Rio Condor 53.97 70.09
SS09-32 Top soil 54.22 69.64 0.512360 0.000018 5.4 0.3
SS09-34 Top soil 53.95 70.13 0.512319 0.000006 6.2 0.1
SS09-35 Top soil 53.82 70.17 0.512414 0.000010 4.4 0.2
The reproducibility of the digestion procedure, determined by repeat analysis of GBW-07063 (n à 5), SRM1547 (à n à 3), SRM1515 (à n à 3) and two peat samples (each n à 3), was generally better than 13%. The blanks for all elements considered here were <0.01 p.p.m.
The <63 mm fraction was extracted from 20 soil/sediment samples for element geochemistry using a nylon sieve. This fraction was selected as particles up to 70 mm can be transported over long distances (>2000 km) from their source (Gaiero et al., 2013). One hundred milligrams of each sample was first ashed in a furnace at 550 ˚C for 5 h to remove all organic matter. Subsequently the samples were acid digested in Teflon vials on hot plates using an HNO3–HF mixture (for
details see Supporting Information). Rare earth element (REE) concentrations were measured by ICP-MS (Agilent Technolo-gies 7500ce). Measurements of an international certified reference material (SRM2711a Montana II Soil; n à 2) gave REE concentrations within 18% of the certified values. The reproducibility was assessed by repeat analysis (n à 3) of two soil samples and was better than 5%.
Neodymium isotope analyses
Thirty-seven peat samples (24 processed at EcoLab, Toulouse, France, and 13 processed at Laboratoire G-Time, Brussels, Belgium; Table S2) and 12 soil/sediment samples (<63 mm fraction) were selected for neodymium (Nd) isotope analysis. First, 400 mg of bulk peat sample (100 mg for the soil/ sediment samples) was ashed in a furnace at 550 ˚C for 5 h. Subsequently the samples were acid digested using a mixture of concentrated HNO3 and HF. The accuracy and
reproduc-ibility of the digestion procedure regarding Nd concentra-tions, determined by repeat analysis of the international certified standard GBW-07063 (n à 3), was better than 10%. Neodymium was separated from the matrix using a two-column ion exchange technique (see Supporting information). The Nd isotopic ratios of 24 peat and 12 soil/sediment samples were measured on a thermal ionization mass
samples using the following equations:
T otal REE AR
ià Ömg cm
2a
1Ü
à SâREEä
i⇥ peat AR
i⇥ density
iÖ1Ü
Dust AR
ià total REE AR
i=S
â
REE
ä
UCC⇥ 10000
Ö2Ü
whereP[REE]iis the sum of the REE concentrations (mg g 1)
in sample i and P[REE]UCC is the sum of the REE
concen-trations in the upper continental crust (148 mg g 1; Rudnick
and Gao, 2003). REEs are considered to behave conserva-tively and have a wide distribution in crustal rocks, so they can be used as a quantitative indicator of the natural variation in supply of inorganic material to bogs (e.g. Aubert et al., 2006).
Results
Dust accumulation rate
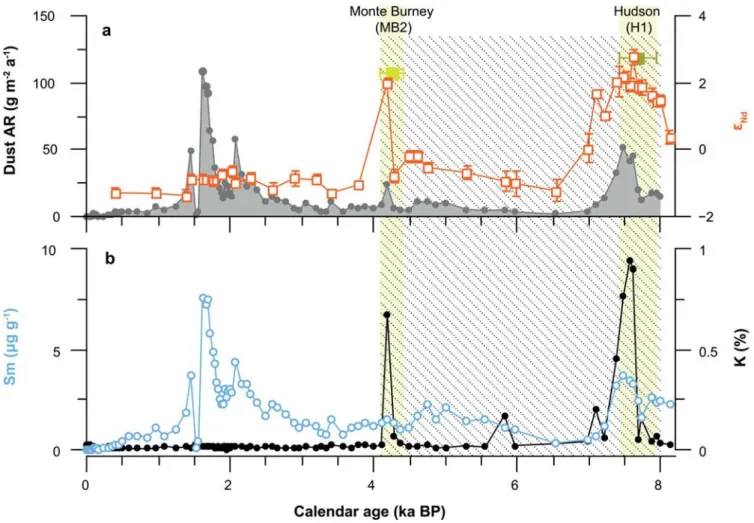
Three periods of elevated dust AR (Fig. 2a) can be distin-guished relative to a background value of 7 g m 2a 1: (i) from 8.1 to 7.4 cal ka BP; (ii) at 4.2 cal ka BP and (iii) from 2.4 to 1.4 cal ka BP (with a short drop at 1.6 cal ka BP). The highest rate of 109 g m 2a 1occurred from 1.7 to 1.6 cal ka BP.
Elemental concentrations and PCA
The results of the PCA are shown in Figs S2 and S3. Three components explain 95% of the variance in the geochemical dataset. The first principal component (PC1) accounts for 62% of the total variance and includes REEs, Sc, Th, U, Zr, Hf and Al. PC2 explains 26% of the total variance and comprises Rb, Na, K, Cs, Ti, Pb and Ga. The third component (PC3) accounts for 7% of the variance and includes Mg, Ca and Sr. As 98% of the variance of Sm concentrations is allocated to PC1 and 87% of that of K to PC2, these two elements are presented here as reference elements for PC1 and PC2, respectively. The variation of Sm and K with calendar age is shown in Fig. 2b. Samarium concentrations are elevated from 8.1 to 7.4 cal ka BP, from 2.4 to 1.6 cal ka BP and from 1.5 to 1.4 cal ka BP, while the K record shows three peaks from, respectively 8.1 to 7.4, at 5.8 and at 4.2 cal ka BP.
REE patterns of the Karukinka peat samples, top soils, river, moraine, aeolian and outwash plain sediments from southern Patagonia are shown in Figs 3 and S4 (data are provided in Tables S4 and S5). Measured concentrations were normalized to the upper continental crust (Rudnick and Gao, 2003). REE patterns of the peat samples coinciding with periods of increased aeolian dust deposition (i.e. 2.4–1.6 and 1.5–1.4 cal ka BP) have a middle REE enrichment.
Figure 2. Dust deposition record at the Karukinka bog. a. Profiles of dust accumulation rates (g m 2a 1) and neodymium isotopic compositions
(eNd) with calendar age (ka BP). Yellow squares: neodymium isotopic composition of two volcanic ash layers from the Hudson volcano (H1; Stern,
2008) and Monte Burney (MB2; McCulloch and Davies, 2001). Error bars indicate the age uncertainty reported in the literature for both eruptions. b. Samarium (Sm) and potassium (K) concentration–calendar age profiles. The peatland development stages, fen and transition to bog, are marked by the hatched area. All deposits younger than 4.1 cal ka BP occur within the ombrotrophic stage of the peatland (De Vleeschouwer
et al., 2014), which is exclusively fed by atmospheric dust deposition. (For interpretation of the references to colour in this figure legend, the
Discussion
Dust sources
In southern South America mineral dust is generated by two main processes: (i) ash-producing volcanic eruptions and (ii) wind erosion (deflation) predominantly by the westerly winds. Accordingly, dust originating from both processes is expected to be present in peat archives. In the Karukinka record we distinguish two volcanic ash layers based on their co-occurrence with known tephras (Fig. 2): Hudson 1 (7.7 ⌃ 0.3 cal ka BP; Stern, 2008) and Monte Burney 2 (4.2 ⌃ 0.2 cal ka BP; McCulloch and Davies, 2001). In addition, the volcanic origin of these two layers is confirmed by the neodymium isotopic composition measured in these peat samples (eNdà 2.8 ⌃ 0.2 and 2 ⌃ 0.1), which
corre-sponds to published eNd values of, respectively, Hudson 1
(2.8; Gaiero et al., 2007) and Monte Burney 2 tephra (2 ⌃ 0.2; Stern and Kilian, 1996) (Fig. 2a). Both eruptions account for the two oldest dust AR peaks. The spread in the Hudson 1 volcanic ash layer is most likely due to post-depositional redistribution by groundwater flow, as the peat-land at that time was still in the minerotrophic stage (Fig. 2; De Vleeschouwer et al., 2014). Since the largest peaks in K coincide with the volcanic ash layers we conclude that PC2, represented by K, can be attributed to volcanic ash. Accord-ingly, PC1, represented by Sm, is interpreted as mineral dust of non-volcanic origin. Therefore, an increase in aeolian dust deposition was registered in the Karukinka bog from 2.4 to 1.4 cal ka BP (samples within this interval are referred to as KAR dust samples). Elevated concentrations in Sm from 8.1 to 7.4 cal ka BP, coinciding with the Hudson 1 tephra, occur within the minerotrophic stage of the peatland (Fig. 2), and hence cannot be safely interpreted in terms of aeolian dust deposition. The PCA extracted a third component, PC3, which is considered to represent diagenetic processes as it affects mainly Mg, Sr and Ca, which are known to be mobile in peat (e.g. Steinmann and Shotyk, 1997). PC3 will not be discussed further as it does not provide any information about dust sources.
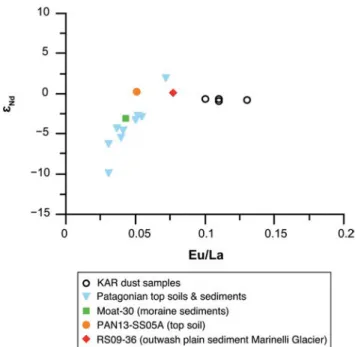
Figure 4. Neodymium isotopic compositions (eNd) versus europium/
lanthanum ratios for Karukinka dust samples (i.e. peat samples from the dust intervals 2.4–1.6 and 1.5–1.4 cal ka BP) and Patagonian top soils, river, moraine and outwash plain sediments (Fig. 1 for location and Table 1 for more details).
Figure 3. Rare earth element (REE) patterns of Karukinka dust samples (i.e. peat samples from the dust intervals 2.4–1.6 and 1.5–1.4 cal ka BP; grey curves) and Patagonian top soils, river, moraine, aeolian and outwash plain sediments (Fig. 1 for location and Table 1 for more details) normalized to the upper continental crust (UCC; Rudnick and Gao, 2003). The mean is shown for samples with a similar REE pattern. The individual REE patterns of Moat-27 (moraine sediment), RS09-36 (outwash plain sediments Marinelli Glacier) and PD13-SS04 (sediments from partly dried lake Laguna Ana) are presented in Fig. S4.
Neodymium isotopic composition
The neodymium isotopic signatures of the peat samples are shown in Fig. 2a. Overall the samples have a homogeneous isotopic composition with an average eNd value of 1 ⌃ 0.2,
apart from the samples corresponding to 8.1–7.4 cal ka BP ( ( e eNd 2 varies 0.1). from
e 0.5values ⌃0.2 toof 2.812⌃soil,0.2) andriver, 4.2
morainecal kaandBP
Nd à ⌃ Nd
outwash plain sediments are given in Table 1 and shown in Fig. 4 and vary from 10 ⌃ 0.1 to á2 ⌃ 0.2.
Grain size
The main grain size distributions in the Karukinka record are shown in Fig. 5e. Silt-size particles (2–63 mm) dominate but clay (<2 mm) and sand (63 mm to 2 mm) particles occur in a number of samples. Two clusters and two single events of significantly different grain size distribution were ex-tracted by means of cluster analysis (Fig. S5). Cluster 1 represents samples with a grain size distribution that peaks in the medium to coarse silt and tails towards the fine to medium sand fraction. The two subgroups show a larger statistical distance between them than those of cluster 2, due to the larger content in the very coarse silt to fine sand size range of the second subgroup (Fig. S5). Cluster 2 groups samples dominated by fine to medium silts and a minor clay fraction. Differences between subgroups are small and concern variations in the mode grain size class, but overall the grain size distribution is similar (with the exception of a slight enrichment in clay fractions in one of the subgroups). The grain size distributions of two samples are significantly different from the above two clusters and are therefore classified as events. They are characterized by a dominant medium to coarse silt fraction and a minor medium to coarse sand fraction. The distribution of the median grain size and the main grain size clusters with calendar age are shown in Fig. 5d.
The neodymium isotopic composition of the aeolian dust peaks from 2.4 to 1.4 cal ka BP is overall constant, i.e. 0.9 ⌃ 0.1 (Fig. 2a). Either this means that during this timespan dust has a single origin or the eNd signature in the
the mire (Fig. 1b). Besides the fact that winds from the east are less frequent, easterly wind flow generally brings humidity from the Atlantic Ocean (Schneider et al., 2003). Accord-ingly, they are less likely to transport dust over large distances but instead stimulate precipitation and dust deposition closer to the sources. Both the moraine sediments from Punta Moat and the outwash sediments from the Marinelli valley have an overall similar origin, i.e. glacial erosion of the Darwin Cordillera. Punta Moat is an end moraine generated by glacier activity in the Beagle Channel with an origin in the southern slope of the Darwin Cordillera (Coronato, 1995). RS09-36, on the other hand, was collected from the outwash plain of the Marinelli Glacier which is the largest outlet glacier located on the northern slope of the Cordillera Darwin Ice field (CDI; Lopez et al., 2010) (Fig. 1c). Hence their common origin explains their similar REE composition. Nevertheless, their different location is expressed in their Nd isotopic composition. The moraine sediments from Punta Moat are less radiogenic, eNdà 3 ⌃ 0.1, than the outwash
deposits from the Marinelli Glacier, eNdà 0.1 ⌃ 0.2 (Fig. 4).
The latter are a closer match to the eNd values of the KAR
dust samples, 0.9 ⌃ 0.1. Furthermore, several mountain Figure 5. Comparison of the Karukinka peat record with selected palaeoenvironmental reconstructions from southern Patagonia. a. Dust accumulation rates (g m 2a 1) at the Karukinka bog. b. Neoglacial SPI glacier advances (Aniya, 2013), also represented by the blue vertical
bars. c. Magnetic susceptibility profile as an indicator of fine sediment supply from the Marinelli Glacier to the Seno Almirantazgo (core JPC67; Boyd et al., 2008). d. Median grain size (mm) of Karukinka peat samples. The horizontal colour bar marks the occurrence of the main grain size distributions in the record (Fig. 5d). Yellow shaded bars: timing of volcanic eruption events of the Hudson (H1) and Monte Burney (MB2) volcanoes, respectively (McCulloch and Davies, 2001; Stern, 2008). The width of the bars corresponds to the age uncertainty reported in the literature for both eruptions. The peatland development stages, fen and transition to bog, are marked by the hatched area. All deposits younger than 4.1 cal ka BP occur within the ombrotrophic stage of the peatland (De Vleeschouwer et al., 2014), which is exclusively fed by atmospheric dust deposition. e. Main grain size distributions in the Karunkinka peat record extracted by cluster analysis (Fig. S5). (For interpretation of the references to colour in this figure legend, the reader is referred to the web version of this article.)
surrounding geological formations is not diagnostic. Since the REE patterns of the KAR dust samples also have a similar middle REE enrichment (Fig. 3), we can infer that the aeolian dust peak most likely originates from a single source. To identify the dust origin during this period, their composition was compared to that of a number of top soils, river, moraine, aeolian and outwash plain sediments, mainly upwind from the Karukinka bog.
Three potential aeolian dust sources can be identified based on the resemblance of their REE patterns to those of the KAR dust samples (Figs 3 and S4). Moraine sediments from Punta Moat (Moat-27), outwash plain sediments from the Marinelli glacial valley (RS09-36) and lake sediments from the partially dry lake Laguna Ana (PD13-SS04), all show a middle REE enrichment similar to the KAR dust samples. Regardless of its geochemical resemblance, Laguna Ana is considered an unlikely source of dust for the Karukinka bog as the lake is located in extra-Andean Patagonia, east from
the JPC67 MS data, argue for an important glacier retreat from 2.4 to 1.4 cal ka BP. Furthermore, although the Marinelli Glacier is considered to have terminated in the fjord for the entire Holocene (Boyd et al., 2008), the Karukinka dust record allows us to infer that it was probably land-terminating from ca. 2.4 to 1.4 cal ka BP.
The absence of dust peaks in the peat record during previous glacier retreat intervals might reflect differences in the extent of CDI glaciers, i.e. dust is only generated when glaciers retreat far enough to allow the development of a subaerial outwash plain. This is in contrast to fjord sediment cores, which record increased fine glacigenic sediment input because of increased meltwater fluxes, regardless of the presence or absence of outwash plains. The presence of outwash plains in the CDI at the present day is relatively recent as most glaciers were still calving in fjords during the last century. The Marinelli Glacier, for example, was terminating 10 km down into Ainsworth Bay during the mid-1960s (Holmlund and Fuenzalida, 1995). Accordingly, the short timeframe and limited outwash extent of the most recent retreat has thus far not allowed a visible accumulation of dust in the Karukinka peat record. Additional parameters such as surface moisture and lag deposit development (i.e. coarsening of surface material due to winnowing) may also have played a role in particle detachment, entrainment and thus dust production (Maher et al., 2010; Bullard, 2013).
The impact of glacier fluctuations on the Karukinka dust record is also expressed in the physical properties of the deposited dust. For most of the record the grain size distribution of inorganic material is relatively constant (Fig. 5d), fine to medium silt (cluster 2; Fig. 5e). However, for the time interval of increased aeolian dust deposition, we observe several shifts of short duration between grain size distributions of cluster 1 and 2. These relatively rapid shifts and the appearance of coarser material (cluster 1) for dust peaks at 2.1 and at 1.7–1.6 cal ka BP suggest distinct dust events that differ in character from the overall inorganic influx (cluster 2) to the mire. This is consistent with our interpretation that, probably, outwash plains were only exposed during these time intervals. Furthermore, loess derived from glacial settings shows particle sizes which generally range from medium to coarse silt (Muhs, 2013), which is similar to the grain size distribution of cluster 1 (Fig. 5d). The differences between the two subgroups of this cluster probably indicate small changes in wind strength or changes in grain size of the exposed sediments for deflation (e.g. due to winnowing). Consequently, glacier advance III in the Darwin Cordillera was probably of shorter duration/more limited extent than in the Patagonian ice fields (Fig. 5b; Aniya, 2013). Also the MS record of sediment core JPC67 shows an earlier start of glacier retreat (Fig. 5c).
Besides particle availability, there is also a need for particle transport by winds to accumulate dust in mires. The south-west location of the CDI relative to the Karukinka bog suggests a prevailing south-west orientation of the westerlies during the time interval 2.4–1.4 cal ka BP. Southern west-erlies contract and expand seasonally at the present day (Garreaud et al., 2013) and have migrated and/or contracted and expanded in the past (e.g. Lamy et al., 2001; Fletcher and Moreno, 2012; Kohfeld et al., 2013; Bertrand et al., 2014). However, during the mid- and late-Holocene, the intensity of the southern westerlies was relatively stable in the study region at 54˚S (e.g. Lamy et al., 2010). The relationship between dust production and its record in the Karukinka bog during the Neoglaciation has therefore remained mostly independent of changes in wind intensity.
ranges (e.g. Sierra Lucas Bridges) separate Punta Moat from the Karukinka bog and south-east winds are rare (Schneider et al., 2003). In conclusion, these geochemical characteristics indicate that glacial flour from Darwin Cordillera, represented by the Marinelli Glacier outwash plain sample, was the most likely dominant source of aeolian dust to the Karunkinka mire from 2.4 to 1.4 cal ka BP. To date, other glacial valleys on the northern slope of the Darwin Cordillera cannot be excluded, with the exception of the Gallegos valley (Fig. 1c). Sediments from this valley (sample RS09-32; Figs 3 and 4) are enriched in light REEs and have an eNd value of 10 ⌃ 0.1,
which are in contrast to the middle REE enrichment and the more radiogenic eNd values of the KAR dust samples.
However, since the Marinelli Glacier is the largest CDI glacier (Lopez et al., 2010) it integrates most of the lithologies underlying the CDI and therefore can be taken as representa-tive of the Darwin Cordillera.
Palaeoenvironmental implications
As indicated above, our Karukinka record suggests a signifi-cant input of dust originating from glacier valleys on the north-eastern side of the Darwin Cordillera from 2.4 to 1.4 cal ka BP (peaking at 1.7–1.6 cal ka BP). Glacial activity has a great impact on a landscape as it carves new landforms through physical and, to a lesser extent, chemical erosion, producing large amounts of unconsolidated glacigenic sedi-ment. However, these sediments only become exposed to deflation either once they are transported by meltwater from the ice margin to outwash plains (i.e. for land-terminating glaciers) or upon glacier retreat clearing large surfaces of glacial forelands (i.e. for land-terminating and tidewater glaciers: glaciers that terminate in ocean water). To evaluate the relationship between our dust record and regional glacier variability, we compared the Karukinka dust AR profile to previously published records of Patagonian glacier variability (Fig. 5).
Five Neoglacial advances have been identified for the Patagonian ice fields (Aniya, 2013) (Fig. 5b) which have also been reported at two glaciers in the CDI, i.e. the Ema Glacier (northern slope; Strelin et al., 2008) and glaciers terminating in the Pia Bay (southern slope; Kuylenstierna et al., 1996) (Fig. 1c). As the timing of the Karukinka dust peak at 2.4–1.4 cal ka BP corresponds to a period between Neoglacial advances III and IV, we infer that large areas on the northern slope of the Darwin Cordillera most likely became ice-free due to glacial retreat, stimulating glacial dust production and transport. While down-glacier, kata-batic winds are often spatially restricted as they slow down once the air flows off the ice (Bullard, 2013), the persis-tence of the strong westerly winds in southern Patagonia is considered to facilitate the transport of glaciogenic dust over greater distances.
Glacier retreat between advances III and IV is additionally supported by the magnetic susceptibility (MS) record (Fig. 5c) of sediment core JPC67 (Boyd et al., 2008) recovered from Seno Almirantazgo (Fig. 1c). Peaks in MS occur between advances II and III (3.5–2.8 cal ka BP), between advances III and IV (2–1.5 cal ka BP) and in the most recent part of the record, which represents the latest retreat of the Marinelli Glacier (Fig. 5c). Changes in the MS record have been associated with changes in the amount of fine matrix material (Boyd et al., 2008). Hence the observed increase in MS at ca. 2.0–1.5 cal ka BP most likely indicates an increase in fine glacigenic sediment deposition, which is in turn associated with increased meltwater flow during glacier retreat. Accord-ingly, two independent records, i.e. the dust (this study) and
Table S3. Comparison of neodymium isotope analyses by
thermal ionization mass spectrometer and multi-collector inductively coupled plasma mass spectrometry.
Table S4. Sample depths, maximum-likelihood calendar
ages, and major and trace element concentrations for the Karukinka core.
Table S5. Rare earth element concentrations of topsoil,
river, aeolian, moraine and outwash plain sediments.
Abbreviations. AR, accumulation rate; CDI, Cordillera Darwin Ice
field; HCA, hierarchical cluster analysis; MS, magnetic susceptibility; PCA, principal components analysis; REE, rare earth element.
References
Aniya M. 2013. Holocene glaciations of Hielo Patag◆onico (Patagonia Icefield), South America: a brief review. Geochemical Journal 47: 97–105.
Aubert D, Le Roux G, Krachler M et al. 2006. Origin and fluxes of atmospheric REE entering an ombrotrophic peat bog in Black Forest (SW Germany): evidence from snow, lichens and mosses.
Geo-chimica et CosmoGeo-chimica Acta 70: 2815–2826.
Baxter MJ. 1995. Standardisation and transformation in principal component analysis, with applications to archaeometry. Applied
Statistics 44: 513–527.
Baxter MJ. 1999. Detecting multivariate outliers in artefact composi-tional data. Archaeometry 41: 321–338.
Bertrand S, Hughen K, Sep◆ulveda J et al. 2014. Late Holocene covariability of the southern westerlies and sea surface temperature in northern Chilean Patagonia. Quaternary Science Reviews 105: 195–208.
Borromei AM, Ponce JF, Coronato A et al. 2014. Reconstrucci◆on de la vegetaci◆on posglacial y su relaci◆on con el ascenso relativo del nivel del mar en el extremo este del canal Beagle, Tierra del Fuego, Argentina. Andean Geology 41: 362–379.
Boyd BL, Anderson JB, Wellner JS et al. 2008. The sedimentary record of glacial retreat, Marinelli Fjord, Patagonia: regional correlations and climate ties. Marine Geology 255: 165–178. Bullard JE. 2013. Contemporary glacigenic inputs to the dust cycle.
Earth Surface Processes and Landforms 38: 71–89.
Coronato A. 1995. The last Pleistocene glaciation in tributary valleys of the Beagle Channel. Quaternary of the South America and
Antarctic Peninsula 9: 173–182.
Coronato A, Fanning P, Salemme M et al. 2011. Aeolian sequence and the archaeological record in the Fuegian steppe, Argentina.
Quaternary International 245: 122–135.
De Vleeschouwer F, Chambers FM, Swindles GT. 2010. Coring and sub-sampling of peatlands for palaeoenvironmental research. Mires
and Peat 7: 1–10.
De Vleeschouwer F, Piotrowska N, Sikorski J et al. 2009. Multiproxy evidence of ‘Little ice Age’ palaeoenvironmental changes in a peat bog from northern Poland. The Holocene 19: 625–637.
De Vleeschouwer F, Vanneste H, Mauquoy D et al. 2014. Emissions from pre-Hispanic metallurgy in the South American atmosphere.
PLOS ONE 9: e111315.
Delmonte B, Andersson PS, Hansson M et al. 2008. Aeolian dust in east Antarctica (EPICA-Dome C and Vostok): provenance during glacial ages over the last 800 kyr. Geophysical Research Letters 35: L07703–L07703.
Donahue DJ, Linick TW, Jull AJT. 1990. Isotope-ratio and background corrections for accelerator mass spectrometry radiocarbon meas-urements. Radiocarbon 32: 135–142.
Eriksson L, Johansson E, Kettapeh-Wold S. 1999. Introduction to
Multi- and Megavariate Data Analysis Using Projection Methods (PCA & PLS). Umetrics: Umeå.
Fletcher M, Moreno PI. 2012. Have the Southern Westerlies changed in a zonally symmetric manner over the last 14,000 years? A hemisphere-wide take on a controversial problem. Quaternary
International 253: 32–46.
Gaiero DM, Brunet F, Probst J et al. 2007. A uniform isotopic and chemical signature of dust exported from Patagonia: rock sources and occurrence in southern environments. Chemical Geology 238: 107–120.
Conclusions
Geochemical, statistical and sedimentological tools were successfully applied to a peat core from Karukinka Natural Park, Tierra del Fuego, to study past atmospheric dust fluxes and associated palaeoenvironmental changes. Three periods of elevated dust deposition were identified for the past 8000 years. The oldest two are attributed to volcanic eruptions of the Hudson and Monte Burney volcanoes, while the most recent dust peak (2.4–1.4 cal ka BP) has a geochemical signature similar to glacial dust originating from the Marinelli Glacier valley (northern slope of the Darwin Cordillera). Dust accumulation rates up to ca. 110 g m 2 a 1
were estimated, which is in large contrast to the background value of 7 g m 2 a 1 for most of the record.
Based on the dust source and coherence with known glacier variability data for the Patagonian ice fields, we infer that glaciers of the CDI retreated significantly between Neoglacial advances III and IV. CDI glaciers such as the Marinelli Glacier were very likely land-terminating to ensure sufficient particle availability to produce the ob-served aeolian dust peak in the Karukinka record. The lack of elevated aeolian dust deposition between previous Neo-glacial advances was most likely the result of limited particle availability, due to a lesser retreat of CDI glaciers. These findings are an important contribution to our current knowledge on glacier variability in the region and highlight the need for further research.
In conclusion, the Karukinka peat record demonstrates that glacier retreat acts as an important source of aeolian dust during the Holocene. This observation is of particular interest as most glaciers are currently retreating worldwide.
Acknowledgements. This research was financed by a Young
Research Grant of the Agence Nationale de la Recherche, to F. De Vleeschouwer (Project ANR-2011-JS56-006-01 ‘PARAD’). River and outwash plain sediment samples were collected with Grant # 8379-07 from the National Geographic Society of Research and Exploration (to S. Bertrand). Thanks to A. Lanzanova (GET, France) and W. Debouge (ULB, Belgium) for their technical support in the clean lab and with the ICP-MS analyses. We thank B. Saavedra, S. Arismendi, R. Muza and the Karukinka Park rangers from the Wildlife Conservation Society for facilitating access to the Karukinka Park. D. Mauquoy is thanked for having separated the macrofossils for the radiocarbon measurements. Thanks to N. Bahamonde (INIA, Punta Arenas, Chile) and E. Teneb (UMag, Punta Arenas, Chile) for their logistical support with the preparation of the fieldwork. We also thank the reviewers for their constructive comments.
Supporting
Information
Figure S1. Age–depth model for the Karukinka peat core. Figure S2. Relative importance of each principal
compo-nent in explaining the variance of considered elements.
Figure S3. Profiles of principal components 1 and 2,
samarium and potassium scores and statistical residuals with calendar age (ka BP).
Figure S4. Rare earth element (REE) patterns of moraine
(Moat-27), dried lake (PD13-SS04) and outwash plain sedi-ments (RS09-36) normalized to the upper continental crust (UCC; Rudnick and Gao, 2003).
Figure S5. Result of hierarchical cluster analysis applied to
70 grain size classes.
Table S1. Accuracy and reproducibility of peat sample
analyses by inductively coupled plasma optical emission spectroscopy and inductively coupled plasma mass spectrometry.
Table S2. Neodymium isotopic composition of peat
Gaiero DM, Probst J-L, Depetris PJ et al. 2003. Iron and other transition metals in Patagonian riverborne and windborne materials: geochem-ical control and transport to the southern South Atlantic Ocean.
Geochimica et Cosmochimica Acta 67: 3603–3623.
Gaiero DM, Simonella L, Gass◆o S et al. 2013. Ground/satellite observations and atmospheric modeling of dust storms originating in the high Puna–Altiplano deserts (South America): implications for the interpretation of paleo-climatic archives. Journal of
Geo-physical Research: Atmospheres 118: 3817–3831.
Garreaud R, Lopez P, Minvielle M et al. 2013. Large-scale control on the Patagonian climate. Journal of Climate 26: 215–230.
Givelet N, Le Roux G, Cheburkin A et al. 2004. Suggested protocol for collecting, handling and preparing peat cores and peat samples for physical, chemical, mineralogical and isotopic analyses. Journal
of Environmental Monitoring 6: 481–492.
Griffin DW, Kellogg CA, Shinn EA. 2001. Dust in the wind: long range transport of dust in the atmosphere and its implications for global public and ecosystem health. Global Change and Human
Health 2: 20–33.
Hijmans RJ, Cameron SE, Parra JL et al. 2005. Very high resolution interpolated climate surfaces for global land areas. International
Journal of Climatology 25: 1965–1978.
Holmlund P, Fuenzalida H. 1995. Anomalous glacier responses to 20th century climatic changes in the Darwin Cordillera, southern Chile. Journal of Glaciology 41: 209–220.
Iriondo M. 2000. Patagonian dust in Antarctica. Quaternary
Interna-tional 68–71: 83–86.
Jickells TD, An ZS, Andersen KK et al. 2005. Global iron connections between desert dust, ocean biogeochemistry, and climate. Science 308: 67–71.
Kaiser J, Lamy F. 2010. Links between Patagonian ice sheet fluctua-tions and Antarctic dust variability during the last glacial period (MIS 4–2). Quaternary Science Reviews 29: 1464–1471.
Kohfeld KE, Graham RM, de Boer AM et al. 2013. Southern Hemisphere westerly wind changes during the Last Glacial Maxi-mum: paleo-data synthesis. Quaternary Science Reviews 68: 76–95.
Kuylenstierna JL, Rosqvist GC, Holmlund P. 1996. Late-Holocene glacier variations in the Cordillera Darwin, Tierra del Fuego, Chile.
The Holocene 6: 353–358.
Lambert F, Delmonte B, Petit JR et al. 2008. Dust–climate couplings over the past 800,000 years from the EPICA Dome C ice core.
Nature 452: 616–619.
Lamy F, Hebbeln D, Rohl U et al. 2001. Holocene rainfall variability in southern Chile: a marine record of latitudinal shifts of the Southern Westerlies. Earth and Planetary Science Letters 185: 369–382.
Lamy F, Kilian R, Arz HW et al. 2010. Holocene changes in the position and intensity of the southern westerly wind belt. Nature
Geoscience 3: 695–699.
Le Roux G, Fagel N, De Vleeschouwer F et al. 2012. Volcano-and climate-driven changes in atmospheric dust sources Volcano-and fluxes since the Late Glacial in Central Europe. Geology 40: 335–338.
Lopez P, Chevallier P, Favier V et al. 2010. A regional view of fluctuations in glacier length in southern South America. Global
and Planetary Change 71: 85–108.
Maher BA, Prospero JM, Mackie D et al. 2010. Global connections between aeolian dust, climate and ocean biogeochemistry at the present day and at the Last Glacial Maximum. Earth-Science
Reviews 99: 61–97.
Martini IP, Martinez-Cortizas A, Chesworth W. 2006. Peatlands: a concise guide to the volume. In Peatlands: Evolution and Records
of Environmnetal and Climate Changes. Elsevier: Amsterdam 1–14.
Marx SK, McGowan HA, Kamber BS. 2009. Long-range dust transport from eastern Australia: A proxy for Holocene aridity and ENSO-type
climate variability. Earth and Planetary Science Letters 282: 167–177.
Mauquoy D, van Geel B, Blaauw M et al. 2004. Changes in solar activity and Holocene climatic shifts derived from 14C wiggle-match dated peat deposits. Holocene 14: 45–52.
McCulloch RD, Davies SJ. 2001. Late-glacial and Holocene palae-oenvironmental change in the central Strait of Magellan, southern Patagonia. Palaeogeography Palaeoclimatology Palaeoecology 173: 143–173.
Moreno PI, FranScois JP, Villa-Martı´nez RP et al. 2009. Millennial-scale variability in Southern Hemisphere westerly wind activity over the last 5000 years in SW Patagonia. Quaternary Science
Reviews 28: 25–38.
Muhs DR. 2013. The geologic records of dust in the Quaternary.
Aeolian Research 9: 3–48.
Painter TH, Barrett AP, Landry CC et al. 2007. Impact of disturbed desert soils on duration of mountain snow cover. Geophysical
Research Letters 34: L12502.
Piotrowska N. 2013. Status report of AMS sample preparation laboratory at GADAM Centre, Gliwice, Poland. Nuclear Instru-ments and Methods in Physics Research Section. Part B: Beam
Interactions with Materials and Atoms 294:176–181.
Prospero JM, Ginoux P, Torres O et al. 2002. Environmental characterization of global sources of atmospheric soil dust identi-fied with the nimbus 7 total ozone mapping spectrometer. Reviews
of Geophysics 40: 1002.
Rudnick RL, Gao S. 2003. 01 composition of the Continental Crust. In Treatise on Geochemistry Vol. 3, Holland HD, Turekian KK (eds). Pergamon: Oxford; 1–64.
Schneider C, Glaser M, Kilian R et al. 2003. Weather observations across the southern Andes at 53˚S. Physical Geography 24: 97–119.
Shotyk W, Krachler M, Martinez-Cortizas A et al. 2002. A peat bog record of natural, pre-anthropogenic enrichments of trace elements in atmospheric aerosols since 12 37014C yr BP, and their variation
with Holocene climate change. Earth and Planetary Science Letters 199: 21–37.
Steinmann P, Shotyk W. 1997. Geochemistry, mineralogy, and geochemical mass balance on major elements in two peat bog profiles (Jura Mountains, Switzerland). Chemical Geology 138: 25–53.
Stern CR. 2008. Holocene tephrochronology record of large explo-sive eruptions in the southernmost Patagonian Andes. Bulletin of
Volcanology 70: 435–454.
Stern CR, Kilian R. 1996. Role of the subducted slab, mantle wedge and continental crust in the generation of adakites from the Andean Austral Volcanic Zone. Contributions to Mineralogy and Petrology 123: 263–281.
Strelin J, Casassa G, Rosqvist G et al. 2008. Holocene glaciations in the Ema Glacier valley, Monte Sarmiento Massif, Tierra del Fuego. Palaeogeography Palaeoclimatology Palaeoecology 260: 299–314.
Sugden DE, McCulloch RD, Bory AJ-M et al. 2009. Influence of Patagonian glaciers on Antarctic dust deposition during the last glacial period. Nature Geoscience 2: 281–285.
Vanneste H, De Vleeschouwer F, Martı´nez-Cortizas A et al. 2015. Late-glacial elevated dust deposition linked to westerly wind shifts in southern South America. Scientific Reports 5: 11670.
Winckler G, Anderson RF, Fleisher MQ et al. 2008. Covariant glacial-interglacial dust fluxes in the equatorial Pacific and Antarctica. Science 320: 93–96.
Yoshioka M, Mahowald NM, Conley AJ et al. 2007. Impact of desert dust radiative forcing on Sahel precipitation: relative importance of dust compared to sea surface temperature variations, vegetation changes, and greenhouse gas warming. Journal of Climate 20: 1445–1467.