Official URL
https://doi.org/10.1109/ISBI45749.2020.9098549
Any correspondence concerning this service should be sent
to the repository administrator:
[email protected]
This is an author’s version published in:
http://oatao.univ-toulouse.fr/26323
Open Archive Toulouse Archive Ouverte
OATAO is an open access repository that collects the work of Toulouse
researchers and makes it freely available over the web where possible
To cite this version: Wendt, Herwig and Hourani, Mohamad and
Basarab, Adrian and Kouamé, Denis Deconvolution for improved
multifractal characterization of tissues in ultrasound images.
(2020) In:
17th IEEE International Symposium on Biomedical Imaging: From Nano to
Macro (ISBI 2020), 3 April 2020 - 7 April 2020 (Iowa City, United States).
ABSTRACT
Several existing studies showed the interest of estimating the multifractal properties of tissues in ultrasound (US) imag-ing. However, US images are not carrying information only about the tissues, but also about the US scanner. Deconvolu-tion methods are a common way to restore the tissue reflectiv-ity function, but, to our knowledge, their impact on estimated fractal or multifractal behavior has not been studied yet. The objective of this paper is to investigate this influence through a dedicated simulation pipeline and an in vivo experiment.
Index Terms— Ultrasound imaging, multifractal analy-sis, tissue characterization
1. INTRODUCTION
Ultrasonics tissue characterization (UTC) is an area of inten-sive research, aiming at complementing the visual observa-tion of ultrasound (US) images with quantitative informaobserva-tion about the tissues. Such quantitative measurements, very use-ful in computer-aided screening tools, are generally extracted from US images such as beamformed radiofrequency (RF), envelope, computed by demodulation of individual RF sig-nal, or B-mode, log-compressed envelope, images. The most used parameters to characterize the tissues rely on acousti-cal properties (e.g., attenuation, speed of sound, backscat-tering coefficient [1]) or statistical and spectral information (e.g., [2]). In addition, several studies showed the interest of extracting from US images fractal or multifractal parame-ters, potentially related to the fractal or multifractal behavior of tissues in space and time (e.g., [3]). However, the good agreement between the parameters computed from the US images and those specific to the tissues’ signature is difficult to be proven in practice, thus mitigating the confidence one can have in such measurements. In our previous study in [4], we proposed a simulation pipeline that generated US RF im-ages from tissue reflectivity functions (TRF) with available ground truth of tissue multifractal characteristics. Multifrac-tal spectra were further estimated from the resulting simulated images (RF, envelope and B-mode images were considered) using the algorithm in [5, 6] and compared with the ground
Work supported by Grant ANR-18-CE45-0007 MUTATION.
truth. The results in [4] led to the conclusion that only part of the multifractal characteristics were preserved in US (RF and envelope) images, but B-mode images bear no multifrac-tal ressemblance with simulated tissues.
The main objective herein is to study the impact of de-convolution on the multifractal analysis of US images. The features used in UTC, independently on their acoustic, statis-tic, spectral or multifractal nature, are computed directly on acquired echo data (RF, envelope or B-mode images). Never-theless, this data is not perfectly representative of the tissues, but also carries information about the US scanner, through its point spread function (PSF). Therefore, the restoration of TRF from US images is a subject of active research. Existing algorithms are assuming that RF images from soft tissues can be modeled as the convolution between the TRF and the PSF (e.g., [7, 8]). They aim at restoring the TRF by inverting this model, using various image regularizations, among which the ℓ1-norm is a common choice also used in this work. The
im-pact of deconvolution in UTC was already evaluated in [7] for statistical parameters, but, to the best of our knowledge, has not been studied yet for multifractal features.
Moreover, to also study purely fractal (Hurst) parameters, we make use here of a more versatile simulation pipeline in which fractional Gaussian noise substitutes the independent Gaussian scatter amplitudes of [4]. The estimated multifrac-tal spectra from restored TRF are shown to be in better agree-ment with the ones of the simulated tissues, compared to those extracted from RF or envelope images. Following the results in [4], the B-mode images were not considered in this study given their low correlation with the tissues from a multifrac-tal viewpoint. Finally, we compare the simulation results to those obtained on a real-world US image of thyroid.
The remainder of this paper is organized as follows. Sec-tion 2 provides a brief summary on US image deconvoluSec-tion and multifractal analysis. Section 3 details the US simulation procedure used to generate images from tissues with available multifractal ground truth. The results are regrouped in Section 4, and conclusion and perspectives are drawn in Section 5.
DECONVOLUTION
FOR IMPROVED MULTIFRACTAL CHARACTERIZATION OF TISSUES
IN
ULTRASOUND IMAGING
Herwig
Wendt, Mohamad Hourani, Adrian Basarab, Denis Kouam´e
IRIT,
CNRS UMR 5505, University of Toulouse, Toulouse, France.
2. MULTIFRACTAL ANALYSIS AND IMAGE DECONVOLUTION
2.1. US image deconvolution
Under the hypothesis of soft tissue examination and using the first order Born approximation, observed RF images af-ter beamforming can be related to the unknown TRF by a linear model, namely a two-dimensional convolution with the system PSF
y= Hx + n, (1)
where y is the beamformed RF image, x is the TRF to be estimated and n is the measurement noise supposed white in-dependent Gaussian. The RF image, the TRF and the noise are all expressed in the standard vectorized version. H is a square matrix accounting for 2D block circulant matrices with circulant blocks and thus easily tractable in practice. Estimat-ing x from y is a typical deconvolution problem. A standard way to solve it is to estimate x by minimizing a cost function, see (2), consisting of a data fidelity term (an ℓ2-norm here
due to the Gaussianity of the noise) and a regularizer. In this work, anℓ1-norm is used to regularize the estimated TRF, due
to its popularity in US image deconvolution. minx 1
2ky − Hxk
2
2+ µkxk1, (2)
whereµ is a hyperparameter balancing the weight of the two terms. To solve (2), we use an alternating direction method of multipliers (ADMM) based optimization algorithm [9]. 2.2. Multifractal analysis
We briefly recall the key concepts of multifractal analysis, see, e.g., [5, 6] for details.
Multifractal spectrum. Multifractal analysis character-izes texture in an image F (x) by its multifractal spectrum D(h), defined as the Hausdorff dimension of the sets of points x with same pointwise regularity index h(x) = h, where smaller (larger) h(x) correspond with rougher (smoother) F (x). The spectrum D(h) can be approximated as
D(h) ≈ 2 + (h − c1)2/(2c2) (3)
where the coefficientc1quantifies the average regularity of
F that accounts for its self-similarity or fractality, and c2≤ 0
quantifies the fluctuations of regularity and accounts for mul-tifractality[6]. In practice, multifractal analysis amounts to estimatingD(h) or the parameters c1 andc2 in
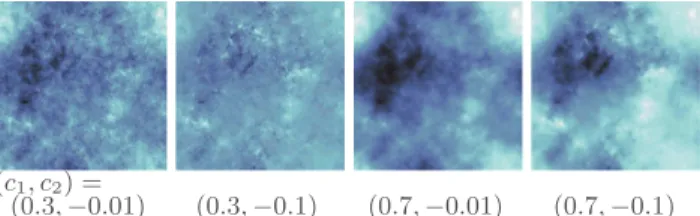
approxima-tion (3). Fig. 1 provides illustraapproxima-tions for multifractal textures with different (multi)fractal parametersc1, c2.
Multifractal formalism. The estimation ofD(h) relies on the wavelet leaders. They are defined as the largest discrete wavelet transform coefficients d(m)F (j, k) of F (cf. [10]), across all finer scales and within a small spatial neighbor-hood,ℓ(j, k) = supm∈(1,2,3),λ′⊂3λj,k|d
(m)
F (λ′)|, where λj,k
(c1, c2) =
(0.3, −0.01) (0.3, −0.1) (0.7, −0.01) (0.7, −0.1)
Fig. 1. Synthetic multifractal images. Realizations of mul-tifractal random walk for different values forc1andc2.
is the dyadic cube of side length 2j centered at k2j and
3λj,k = Sn1,n2={−1,0,1}λj,k1+n1,k2+n2 the union with its eight neighbors, see [6] for details.
It can be shown that the cumulants of order p ≥ 1, Cp(j) = Cump(ln ℓ(j, k)), of the log-leaders ln ℓ(j, k) of F
behave asCp(j) = c0p+ cpln 2j. This can be used to define
simple and robust estimators for the parametersc1andc2of
D(h) in (3) by means of linear regressions of the average and sample variance ofln ℓ(j, k) as functions of ln 2j[5, 6].
3. US IMAGE SIMULATION
To investigate the relationship between the multifractal pa-rameters of a tissue and those that are estimated for the result-ing simulated image, we follow the standard simulation strat-egy used in the US literature and replace the TRF with syn-thetic realizations of a stochastic process with known multi-fractal properties controlled by(c1, c2). The parameters c1, c2
are then estimated for each image independently. Example images corresponding with the different stages of the pipeline are sketched in Fig. 2.
Multifractal TRF (trf). We generate a TRF that mimics the scattering map with prescribed multifractal properties. To this end, we numerically synthesize TRFs as realizations of multifractal random walk (MRW), whose multifractal spec-trum is given byD(h) = 2 + (h − c1)2/(2c2), see [11, 12]
for details. Its construction matches the standard US simu-lation strategy according to which scatterers are modeled as independent Gaussian random variables whose variances en-code local reflectivity; for MRW, a multifractal cascade (con-trolled byc2) modulates the local variance of fractional
Gaus-sian noise (with Hurst parameterH = c1+ c2). We simulate
regularly sampled TRF. It has been checked that this leads to equivalent results as drawing scatterer positions at random from a uniform distribution in the field of view, with subse-quent interpolation to a regular grid, and yields speckle char-acteristics close to those observed in practice.
RF signal (rf). Next, the TRF is convolved with a realistic PSF generated with Field II simulator [13], resulting into an RF image.
Envelope (env). The RF image is further axially demodu-lated, resulting into an envelope image.
Deconvolution (dec). Alternatively, deconvolution is per-formed as described in Section 2.1, assuming perfect
knowl-edge of the PSF.
Enveloped of deconvolved image (env(dec)). Finally, we also compute the envelope of the image obtained by deconvo-lution, to remove possible residual reverberation.
4. RESULTS 4.1. Simulation results
Collections of MRW images with various multifractal param-eters were simulated as described above. The value for the fractal parameter was set toc1 ∈ (0.1, 0.2, . . . , 0.9), and for
the multifractality parameter toc2∈ (−0.1, −0.09, . . . ,
− 0.01, 0), covering a large range of realistic multifractal properties. For each combination(c1, c2), 100 independent
realizations of MRW of size512 × 512 were synthesized and used in the simulation pipeline. The parameters c1 and c2
were estimated for the trf, rf, env, dec and env(dec) images, respectively, as detailed in Section 2, using Daubechies2 wavelets and scalesj ∈ (4, 6) for linear regressions; values reported forc1correspond to the primitive of the image.
Scale invariance. Fig. 3 (left column) plots average cumu-lantsC1(j) and C2(j) as a function of j. It shows that those
obtained for the rf and env images strongly differs from that of the trf image, forC1(j) for all scales, and for C2(j) for the
fine scales. In contrast, the deconvolution effectively restores the linear behavior across scales for all scales forC1(j), and
for all but the finest scales forC2(j).
(Multi)fractal parameters c1and c2. Fig. 3 (right
col-umn) plots average estimates forc1(top) andc2(bottom) as
a function of the prescribed values c1resp. c2. Results are
consistent with those of the previous paragraph. The images rf, dec and env(dec) produce estimates for the fractal param-eterc1that are strongly biased and follow the tendency of the
prescribedc1values at best very weakly. In contrast, the
es-timates forc1obtained after deconvolution tightly reproduce
the prescribed values. For the multifractal parameterc2, all
images enable a reasonably accurate assessment of the value prescribed to the TRF. The best average estimates forc2are
also obtained after deconvolution.
Quantitative analysis. Tab. 1 reports the correlation co-efficient ρ, bias and root mean squared error (rmse) of the estimates obtained for rf, env, dec and env(dec) images, re-spectively, computed w.r.t. estimates obtained for the trf ref-erence image. It confirms that the estimates for c1 and c2
after deconvolution are strongly correlated with those of the TRF model (ρ ≥ 0.98), unlike those for the other images, and produce significantly smaller rmse values (e.g., up to 2 orders of magnitude smaller than those of rf forc1). It also
shows that computing envelopes strongly deteriorates multi-fractal parameter estimates, even after deconvolution.
Overall, this simulation study leads to conclude that only estimates obtained after deconvolution accurately reproduce the full set of fractal and multifractal properties of the TRF.
trf rf env dec env(dec)
Fig. 2. Simulation pipeline. Synthetic images at different steps of the simulation pipeline, illustrating that deconvolu-tion recovers a large part of visual details of the original trf.
2 4 6 -6 -4 -2 0 2 4 (c1=0.3, c2=-0.05) j C 1(j) trf rf env dec env(dec) 0.2 0.4 0.6 0.8 -0.5 0 0.5 1 1.5 (c2=-0.05) c1 synth c 1 est 2 4 6 0 0.1 0.2 0.3 0.4 (c1=0.3, c2=-0.05) j C 2(j) -0.1 -0.05 0 -0.14 -0.12 -0.1 -0.08 -0.06 -0.04 -0.02 0 0.02 (c1=0.3) c2 synth c 2 est
Fig. 3. Log-cumulants and estimation for simulated data. Average estimatesC1(j), C2(j) and c1,c2.
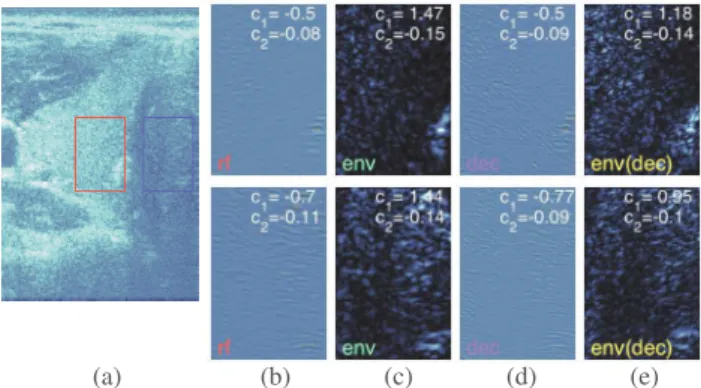
4.2. Illustration for experimental data
We complement the simulation study with a result on an in vivothyroid image acquired from a healthy subject, plotted in Fig. 4(a). Multifractal spectra were estimated for two im-age patches extracted at the same depth and from different tissues. The patches were interpolated to isotropic axial and lateral pixel resolution of≈ 0.02 mm to match the simulation. In this experiment, only the US modes were available. These four pairs of images (two patches for rf, env, dec, env(dec)) are plotted in Fig. 4(b-e), with estimates forc1,c2. The
de-convolution problem is more difficult here than in the simu-lation because the PSF is unknown and can vary in space, re-sulting in clearly visible reverberation artifacts (cf. Fig. 4(d)). We observe that the estimates for multifractalityc2are largely
consistent across the images, corroborating the simulation re-sults as well as those reported in [4], where changes inc2
of US images were found to indicate a change in multifrac-tality for the tissues. As far as the fractal parameter c1 is
concerned, the values for the rf and dec images are very sim-ilar and close to the values observed for rf in the simulation study. This suggests that the deconvolution has not been suc-cessfully unveiling the fractality of the tissue, likely due to the reverberation artifacts caused by a bad estimation of the PSF phase. One could study the envelope of the images in an attempt to remove the residual oscillations, yet this strongly alters the parameterc1, as already observed for the
simula-c1 rf env dec env(dec)
ρ 0.46 0.21 1.00 0.38
bias −1.022 0.628 0.032 0.090
rmse 1.037 0.668 0.034 0.258
c2 rf env dec env(dec)
ρ 0.63 0.47 0.98 0.60
bias −0.007 −0.010 0.010 −0.003
rmse 0.046 0.058 0.016 0.053
Table 1. Correlation coefficientρ, bias and rmse of estimates forc1(top) andc2(bottom) calculated w.r.t. the estimates
ob-tained for the trf image (best results marked in bold).
(a) (b) (c) (d) (e)
Fig. 4. Results for real data. Thyroid image (a, B-mode image) and rf (b), env (c), dec (d), env(dec) (e) images of red (top row) and blue (bottom row) patch, with estimatesc1,c2.
tion. Therefore, while values forc1are different for the two
patches and thus suggest a change in tissue properties, it can not be directly interpreted as a change in tissue fractality.
5. CONCLUSION AND PERSPECTIVES This paper studied the influence of deconvolution on the es-timation of tissue fractal and multifractal properties in US imaging. A simulation pipeline was proposed allowing to generate US images from tissues with available multifractal ground truth. Simulation results showed a better correlation between this ground truth and the estimated fractal and multi-fractal behavior from restored TRF than those estimated from native US data. These encouraging results open several per-spectives including the consideration of other regularization than theℓ1-norm, pursuing with more realistic simulation and
the analysis of further in vivo data. 6. REFERENCES
[1] A. L. Coila and R. Lavarello, “Regularized spectral log difference technique for ultrasonic attenuation imag-ing,” IEEE T. Ultrasonics, Ferroelect., and Frequency Control, vol. 65, no. 3, pp. 378–389, March 2018.
[2] M. L. Oelze and J. Mamou, “Review of quantitative ultrasound: Envelope statistics and backscatter coef-ficient imaging and contributions to diagnostic ultra-sound,” IEEE T. Ultrasonics, Ferroelect., and Frequency Control, vol. 63, no. 2, pp. 336–351, Feb 2016. [3] M. A. Mohammed, B. Al-Khateeb, A. N. Rashid, D. A.
Ibrahim, M. K. A. Ghani, and S. A. Mostafa, “Neural network and multi-fractal dimension features for breast cancer classification from ultrasound images,” Comput-ers& Electrical Eng., vol. 70, pp. 871 – 882, 2018. [4] E. Villain, H. Wendt, A. Basarab, and D. Kouam´e, “On
multifractal tissue characterization in ultrasound imag-ing,” in Proc. IEEE Int. Symp. Biomed. Imag. (ISBI), Venice, Italy, April 2019.
[5] H. Wendt, P. Abry, and S. Jaffard, “Bootstrap for empiri-cal multifractal analysis,” IEEE Signal Processing Mag-azine, vol. 24, no. 4, pp. 38–48, 2007.
[6] H. Wendt, S. G. Roux, P. Abry, and S. Jaffard, “Wavelet leaders and bootstrap for multifractal analysis of im-ages,” Signal Processing, vol. 89, no. 6, pp. 1100–1114, 2009.
[7] M. Alessandrini, S. Maggio, J. Poree, L. De Marchi, N. Speciale, E. Franceschini, O. Bernard, and O. Basset, “A restoration framework for ultrasonic tissue character-ization,” IEEE T. Ultrasonics, Ferroelec. & Frequency Control, vol. 58, no. 11, pp. 2344–2360, 2011.
[8] N. Zhao, A. Basarab, D. Kouam´e, and J.-Y. Tourneret, “Joint Segmentation and Deconvolution of Ultrasound Images Using a Hierarchical Bayesian Model based on Generalized Gaussian Priors,” IEEE T. Image Proces., vol. 25, no. 8, pp. 3736–3750, 2016.
[9] S. Boyd, N. Parikh, E. Chu, B. Peleato, and J. Eckstein, “Distributed optimization and statistical learning via the alternating direction method of multipliers,” Founda-tions and Trends in Machine Learning, vol. 3, no. 1, pp. 1–122, 2011.
[10] S. Mallat, A Wavelet Tour of Signal Processing, 3rd ed. Academic Press, 2008.
[11] E. Bacry, J. Delour, and J.-F. Muzy, “Multifractal ran-dom walk,” Phys. Rev. E, vol. 64: 026103, 2001. [12] L. Chevillard, R. Robert, and V. Vargas, “A stochastic
representation of the local structure of turbulence,” Eu-rophysics Letters, vol. 89, p. 54002, March 2010. [13] J. A. Jensen and N. B. Svendsen, “Calculation of
pres-sure fields from arbitrarily shaped, apodized, and ex-cited ultrasound transducers,” IEEE T. Ultrasonics, Fer-roelec. & Frequency Control, vol. 39, no. 2, pp. 262– 267, March 1992.