This is an Accepted Manuscript, which has been through the
Royal Society of Chemistry peer review process and has been
accepted for publication.
Accepted Manuscripts are published online shortly after
acceptance, before technical editing, formatting and proof reading.
Using this free service, authors can make their results available
to the community, in citable form, before we publish the edited
article. We will replace this Accepted Manuscript with the edited
and formatted Advance Article as soon as it is available.
You can find more information about Accepted Manuscripts in the
author guidelines
.
Please note that technical editing may introduce minor changes
to the text and/or graphics, which may alter content. The journal’s
standard
Terms & Conditions
and the ethical guidelines, outlined
in our
author and reviewer resource centre
, still apply. In no
event shall the Royal Society of Chemistry be held responsible
for any errors or omissions in this Accepted Manuscript or any
consequences arising from the use of any information it contains.
Accepted Manuscript
rsc.li/analyst
Analyst
www.rsc.org/analyst ISSN 0003-2654 PAPER Michele Zagnoni et al.Emulsion technologies for multicellular tumour spheroid radiation assays
Volume 141 Number 1 7 January 2016 Pages 1–354
Analyst
This article can be cited before page numbers have been issued, to do this please use: T. Brule, G. Granger, N. Bukar, C. Deschenes-Rancourt, T. Havard, A. R. Schmitzer, R. Martel and J. Masson, Analyst, 2017, DOI: 10.1039/C7AN00216E.
Journal Name
ARTICLE
Received 00th January 20xx, Accepted 00th January 20xx DOI: 10.1039/x0xx00000x www.rsc.org/Field-deployed surface plasmon resonance (SPR) sensor for RDX
quantification in environmental waters
Thibault Brulé
a†, Geneviève Granger
a†, Natalia Bukar
a†, Clarisse Deschênes-Rancourt
b, Thierry
Havard
a, Andreea R. Schmitzer
a, Richard Martel
band Jean-Francois Masson
a,c *A field-deployable surface plasmon resonance (SPR) sensor is reported for the detection of energetic material (commonly termed explosives) 1,3,5-trinitroperhydro-1,3,5-triazine (RDX) at ppb concentration in environmental samples. The SPR sensor was first validated in laboratory conditions with uncontaminated natural water samples spiked with known concentrations of RDX near the EPA limit of 2 ppb, which was then applied to monitor environmental samples collected in different downgradient wells near a grenade training range. The SPR sensor was finally tested on the field, where environmental samples were analysed on location in less than 90 minutes per well, which included the time to setup the equipment, sample the well and analyse the sample. The SPR analysis time was less than 45 minutes for equilibration, recalibration and measuring the water sample. Results obtained with the SPR sensors were cross-validated with the standard HPLC method (EPA method 8330B), showed good agreement with an accuracy within less than 1.6 ppb for analysis at the sampling sites, and with relative standard deviation (RSD) better than 20 % for field and laboratory
measurements. The SPR sensor worked in a range of environmental conditions, including operation from about 0oC to
nearly 30o
C. The instrument was easily deployed near the sampling site using motor vehicles in summer conditions
(Lab-in-a-Jeep) and using a sled in winter conditions (Lab-on-a-sled), showcasing the field deployability of the RDX SPR sensor and
the possibility of continuously monitoring RDX in the environment.
Introduction
Military training operations often involves handling and detonation of ammunition, which can impact the environment with potential effects for the local population, fauna and flora. In an effort to provide sustainable management of the training sites, several military organisations have prioritized the detection of energetic materials in ground and surface waters to understand and minimize the impact of energetic material residues in military activities. For example, recent hydrogeological studies in several major Canadian military training sites 1 and several others across the world have shown that grounds near firing positions and close to targets required significant attention due to the large quantities of energetic materials residues in some areas. The energetic materials can be transported to ground and surface waters by rainfall and
snow melt. RDX poses a significant challenge as it is poorly retained by most soil composition and becomes readily available in groundwater, which can also be used as drinking water sources of the nearby populations. These sites should be continuously monitored to ensure that contaminant levels do not exceed applicable guidelines and criteria 2-5.
The standard procedure to detect energetic materials in environmental samples requires HPLC-UV analysis (EPA method 8330b 6), a method homologated by the United States Environmental Protection Agency (EPA). This analytical procedure is relatively complex, lengthy and poorly suited for monitoring environmental samples on site. The procedure involves sampling, transport of the sample to the laboratory, pre-concentration/extraction and instrumental analyses, all performed in centralised laboratories. It is thus impossible to have a rapid (less than 1 day) or continuous monitoring of environmental contamination with energetic materials. New analytical techniques adapted to the specific requirements of environmental monitoring are thus needed for energetic materials.
The development of sensors for energetic materials is mostly targeting the detection of trinitrotoluene (TNT) and often times for the standoff detection of the energetic materials present in the gas phase. While this application is of importance, the detection of RDX in water is of utmost importance for environmental sensing due to its prevalence and persistence. Electrochemistry 7, fluorescence 8-14 and a
2
3
4
5
6
7
8
9
10
11
12
13
14
15
16
17
18
19
20
21
22
23
24
25
26
27
28
29
30
31
32
33
34
35
36
37
38
39
40
41
42
43
44
45
46
47
48
49
50
51
52
53
54
55
56
57
58
Analyst
Accepted
Manuscript
ARTICLE
Journal Name
plasmonic technique relying on the aggregation of Au nanoparticles 15 have been proposed to detect RDX in water samples. However, the limits of detection achieved with most of these sensing schemes did not meet the stringent requirement of low ppb detection in environmental samples. In fact, the EPA established the threshold concentration of 2 ppb in natural water, thus methods applied for environmental monitoring should have detection limits significantly better than this concentration.
While surface plasmon resonance (SPR) sensing has been overwhelmingly applied for biological applications 16, it has been also applied to environmental monitoring of contaminants on several occasions, such as for the detection of a series of organic contaminants and heavy metals 17, 18. In addition to the classical prism-based SPR sensing, colorimetric sensors based on localized surface plasmon resonance (LSPR) are increasingly reported for environmental applications 19, 20. SPR sensors have been reported to meet this requirement for RDX monitoring in water with sub-ppb limits of detection, using sensing schemes based on competitive sensing involving an antibody 21 and based on a molecularly imprinted polymer (MIP) 22. The MIP-based sensing scheme is especially attractive for environmental sensing technologies due to the stability of MIPs in environmental conditions and to the simplicity of the sensing scheme. For these reasons, we have selected a RDX-selective MIP based on a previously reported bisaniline polymer crosslinked with Au nanoparticles (Au NP) and templated with Kemp’s acid 22. In addition, SPR and LSPR sensing are especially advantageous in environmental applications due to the possibility of deploying the instrument to the site of sample collection with portable instruments.
Several portable SPR systems have been reported based on different configurations 23-30. Despite the availability of portable SPR systems since nearly 20 years, SPR sensing has been rarely used in field conditions and nearly all studies are still conducted in the laboratory. The detection of proteins using an airborne SPR instrument mounted on an aircraft is one of the only example reported to date using a field-deployed SPR instrument in the environment 31. Therefore, efforts must be devoted to the development and the application of SPR sensing platform with demonstrated performance in actual field sampling conditions.
Thus, we report on a fast and portable SPR sensor for energetic materials detection in water, which was actually used in field conditions for environmental monitoring of RDX. The SPR instrument is based on a small, portable, and USB-powered design reported previously 30 and on a SPR sensor modified with a MIP selective for RDX 22. This SPR sensor was calibrated in natural water and tested on site with environmental samples collected near a grenade range from a local military base. This constitutes to the best of our knowledge the first report where a SPR sensor has been tested in environmental conditions and cross-validated with an homologated EPA method (EPA method 8330b).
Experimental
SPR analysis.
The SPR measurements were performed with a portable P4-SPR from Affinité Instruments. This device is lightweight (<1.5 kg), compact (175 mm x 155 mm x 55 mm) and portable on the field. It uses a small SPR chips (20 mm x 12 mm x 3 mm) and fluidic cell comprised of three sensing channels and a reference channel. Thus, all samples were measured in triplicate. The noise level of the SPR measurements is on the order to 0.01 nm, similar to the standard value reported by Homola 32. Thus, SPR shifts of 0.1 nm or less can be measured with this system. The chips were functionalised with a MIP selective for RDX adapted from a previously published procedure 22, as detailed below. The SPR sensors were tested with known concentrations ranging from 1 pM to 50 nM by flowing the different concentrations sequentially on the SPR sensor at 1 mL/min using a peristaltic pump. The standards were prepared in natural water collected from an uncontaminated well located upgradient of the sampling site. For field analysis, the SPR sensor was calibrated with standards from 1 to 50 nM, a range overlapping with the EPA limit and the expected concentration in the natural samples. The response from each sensor was normalized with the response from a 10 nM RDX standard. The influence of temperature on the sensitivity of the calibration curve was measured in the laboratory from 2oC to 36oC.
SPR sensor for RDX.
Au nanoparticle synthesis and functionalisation
Small 3-5 nm Au NP were synthesized with 10 mL ethanolic solution with 197 mg of HAuCl4, which was added to 5 mL of a methanol solution with 42 mg of mercaptoethane sulfonate and 8 mg of p-aminothiophenol. The solution was stirred with 2.5 mL of glacial acetic acid in an ice bath for 1 hour. 7.5 mL of an aqueous NaBH4 solution was then added dropwise and stirred an additional hour in an ice bath and then 14 hours at room temperature. The functionalized Au nanoparticles were then centrifuged and washed twice in methanol, ethanol, diethyl ether. At the end, diethyl ether was evaporated and the functionalized AuNPs were stored as a solid. The functionalized AuNPs were resuspended in 4-(2-hydroxyethyl)-1-piperazineethanesulfonic acid (HEPES) buffer before for the electropolymerization.
Functionalisation of the SPR chips with the MIP
The SPR chips were reacted 24 hours with a 50 mM p-aminothiophenol solution in ethanol. An electropolymerization solution was prepared with 1 mg/mL of functionalized AuNPs and 5.6 mg/mL Kemp’s acid (as template) in 0.1 M HEPES at pH 7.2, with a freshly prepared HEPES. Electropolymerization was carried with the following setup: counter electrode: Platinum mesh, washed before use (1. Cycle from -810 mV to 2000 mV to -810 mV in 0.5 M H2SO4 once. 2.Cycle >10 times from -610 mV to 1000 mV to -610mV in 0.5 M H2SO4 at 50 mV/min), the working electrode was the SPR chip electrically connected with a copper tape, and a silver wire reference electrode. A custom made Teflon electrochemical cell was designed to host the SPR prism and the electrodes (Figure S1). The electropolymerization solution was then bubbled with
1
2
3
4
5
6
7
8
9
10
11
12
13
14
15
16
17
18
19
20
21
22
23
24
25
26
27
28
29
30
31
32
33
34
35
36
37
38
39
40
41
42
43
44
45
46
47
48
49
50
51
52
53
54
55
56
57
58
59
Analyst
Accepted
Manuscript
Published on 10 May 2017. Downloaded by Institut nationale de la recherche scientifique (INRS) on 16/05/2017 13:38:07.
nitrogen for 10 minutes, in a vial wrapped in aluminum foil. The platinum mesh was then positioned as close as possible to the SPR chip (about 3 mm) and the electropolymerization solution was added thereafter. Electropolymerization was carried with 10 cycles between -0.35 and 0.8 V vs the Ag quasi-reference electrode at a scan rate of 100 mV/s, followed by a potentiostatic step at 0.8 V for 30 min. The SPR chips were then washed with water. Finally, the template molecule was extracted by washing the SPR chip in HEPES for 2 hours at 40°C, then overnight in a fresh HEPES solution at room temperature. This procedure was repeated a second time.
Characterisation of the MIP on the SPR chip
The SPR sensor modified with the MIP was subjected to a series of surface measurement for the characterisation of the MIP. Ellipsometric measurements were conducted with a M-2000V from J.A. Woollam Co. Scanning electron microscopy (SEM) images were acquired with a JEOL 7400F instrument and transmission electron microscopy (TEM) images were acquired with a FEI Tecnai T12 microscope available at the Université de Montréal. An indium tin oxide (ITO) glass slide was modified with the MIP following the same procedure as for the SPR sensor and was subjected to dark-field imaging using darkfield microscopy equipped with hyperspectral imaging. Optical and hyperspectral images, and data were captured using a research grade optical microscope (Olympus BX43) equipped with an advanced darkfield illumination system with integrated hyperspectral analysis (CytoViva). An Andor iXon3 camera was used in order to acquire images of 512 by 512 pixels. Spatial and spectral data (wavelengths between 400 and 1000 nm) were collected with a 100x objective, resulting in a pixel size of approximately a few hundred nanometers. Similarly, a gold-coated nanodisk array was modified with the Kemp’s acid templated MIP and atomic force microscopy (AFM, Witec) images were acquired in contact mode to estimate the thickness of the MIP coating.
Field analysis of RDX.
Field experiments were conducted with minimal infrastructure. A tent or a trailer served as protection of the equipment against environmental conditions such as snow or rain, in which a table and mat were installed for the SPR system and the laptop. A generator was available for electricity in longer days of sampling, although the SPR system could run
for approximately 2 hours on the battery of the laptop. Water was sampled from wells using a peristaltic pump. The flow rate of the sampling pump exceeded the flow rate necessary for the SPR system, thus the sampling pump outlet and the inlet of the peristaltic pump for the SPR system were placed in a spill beaker.
Natural water samples were also collected in amber glass bottles and brought back to the laboratory for analysis with the EPA method 8330b and with SPR for duplicate analysis. Although bisulfite was investigated as a stabilizing agent for samples brought back to the lab, we opted out of this option to maintain the samples in natural conditions even for laboratory analysis. Uncontaminated natural water was also collected in an upstream well, which was used to dilute RDX standards.
Sampling location and conditions
The samples were collected near the impact area of a grenade shooting range. The site’s topography is relatively flat. The ground surface is constituted of light-brown colored sand on its deforested part, except the area of impact where the sand is dark brown to black color. The ground surface in the wooded area is covered with organic matter. Three contaminated wells were analysed downgradient from the range. Based on previous measurements and localisations, these wells are respectively an uncontaminated (control well), the most contaminated and a lower contaminated well. Different sampling and measurement campaigns were conducted at different times between April and September 2016. An early Spring campaign was conducted in wintery conditions with approximately 0°C to 6°C with snow-covered ground and rain
HPLC analysis
HPLC analysis of RDX-contaminated natural water was performed at the Institut National de la Recherche Scientifique (INRS) Centre water, earth and environment laboratory located in Quebec City. The samples were analysed according to EPA method 8330b.
Results and discussion
Spatial and temporal variations of the concentration of environmental contaminants can occur rendering extensive
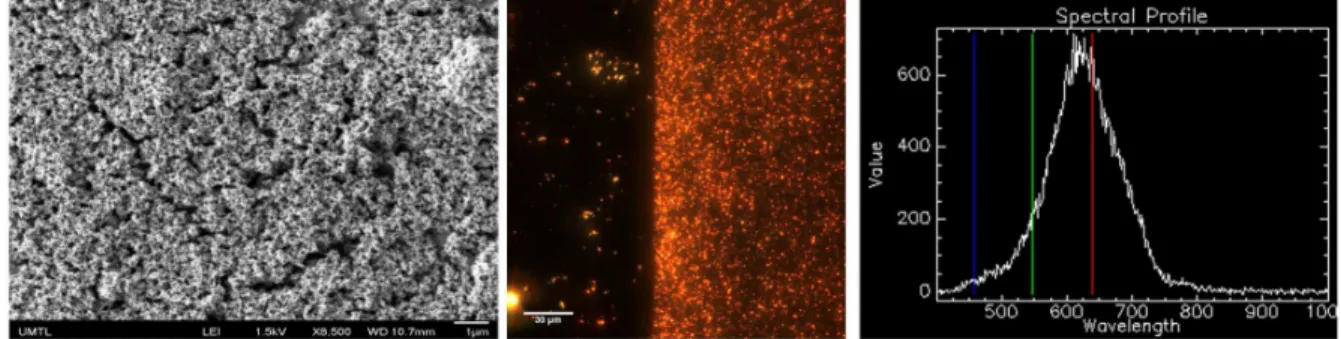
Figure 1. Characterisation of the MIP for RDX on the SPR sensor. Left) SEM image acquired at 8,500X magnification of the MIP on the SPR sensor, with a
thin Au overcoat. Centre) Dark-field image at the edge of the MIP on an ITO slide. No MIP was on the left side of the image, while the right side was
2
3
4
5
6
7
8
9
10
11
12
13
14
15
16
17
18
19
20
21
22
23
24
25
26
27
28
29
30
31
32
33
34
35
36
37
38
39
40
41
42
43
44
45
46
47
48
49
50
51
52
53
54
55
56
57
58
Analyst
Accepted
Manuscript
ARTICLE
Journal Name
sampling necessary for monitoring underground water. For example, spatial variations in a single sampling site can be due to different topography, geology, soil types, drainage, flow direction, and anthropogenic processes 33. Temporal variations can be caused by seasonal changes and weather conditions. In the case of energetic material contamination, military across the globe started sampling for energetic material in water sources nearby their facilities to ensure compliance to environmental regulation and for the safe and sustainable use of the land. A portable SPR sensor was thus adapted to meet these needs.
Characterisation of the RDX MIP on the SPR chip
The several steps involved in the formation of the MIP on the SPR sensor were subjected to optimization. The ratio of 4-aminothiophenol and mercaptoethane sulfonate was varied for the synthesis of the Au NP with the optimal ratio reported in the experimental procedure. The one-pot synthesis of the Au NP also proved to be optimal, with the trials for synthesizing the Au NP in a first step and subsequent functionalisation with 4-aminothiophenol and mercaptoethane sulfonate were not satisfactory. A series of TEM images demonstrated the relatively monodisperse size of the Au NP (Figure S2), but revealed that different shapes of Au NP resulted from this synthesis.
The gold film of the SPR sensor had to be pre-functionalised with 4-aminothiophenol to allow formation of the MIP. Electropolymerization had to be conducted on a freshly prepared SPR sensor modified with 4-aminothiophenol, but then could be stored for extended periods of time. The concentration of the template molecule (Kemp’s acid) in the electropolymerization solution was optimal between 4 and 8 mg/mL (Figure S3) and a final concentration of 5.6 mg/mL was used for in the optimal process. To ensure reproducible response for RDX with the SPR sensor, the following precautions were taken for the electropolymerization step: 1) the HEPES solution was freshly prepared, 2) the
electropolymerization solution was bubbled with nitrogen for 10 minutes before polymerization, 3) the solution was unstirred during the electropolymerization process, 4) the positioning of the counter electrode had to be relatively close to the SPR prism (about 3 mm) and 5) we used the Teflon cell of Figure S1. The extraction of the template molecule was optimized as specified in the protocol and the removal of the template was confirmed from the disappearance of Kemp’s acid from the extraction solution as measured with HPLC.
The formation of the MIP on the SPR sensor was characterised with several techniques. SEM images showed the presence of a homogeneous and porous films on the surface of the SPR sensor (Figure 1). The thickness of this film was evaluated with several techniques. Ellipsometric measurements were conducted directly on the functionalized SPR sensor and the thickness was evaluated at 5 nm. AFM images were acquired on the SPR sensor, but the thickness of the film could not be extracted. Therefore, the electropolymerization reaction was carried on a gold-coated nanodisk array (Figure S4), prepared as detailed elsewhere 34. The analysis of the cross-sections of the AFM images suggested a MIP height difference of about 3 nm before exposition to RDX and a significantly larger height difference of 9 nm after exposition to RDX. This result is in agreement with ellipsometry that the MIP film is sub-10 nm. Finally, the presence of Au NP in the MIP film was revealed from dark-field images collected in transmission configuration (Figure 1). In that case, the MIP was grown on a transparent ITO slide, using the same process as for the SPR prism. An image was collected at the edge of the MIP, where a high density of Au NP was observed on the MIP and only a few scattered Au NP could be seen on the region where no MIP was grown. The spectral analysis of the dark-field data revealed a maximum resonance around 620 nm, in agreement with a dense film of Au NP. These experiments clearly showed the presence of the MIP film and of the Au NP on the SPR sensor.
Figure 2. SPR sensorgram for the calibration of the sensor for RDX using manual injections (no flow, left panel) and using a peristaltic pump at 1 mL/min
(right)
1
2
3
4
5
6
7
8
9
10
11
12
13
14
15
16
17
18
19
20
21
22
23
24
25
26
27
28
29
30
31
32
33
34
35
36
37
38
39
40
41
42
43
44
45
46
47
48
49
50
51
52
53
54
55
56
57
58
59
Analyst
Accepted
Manuscript
Published on 10 May 2017. Downloaded by Institut nationale de la recherche scientifique (INRS) on 16/05/2017 13:38:07.
Calibration of the SPR sensor for RDX
The sensor was then calibrated in the laboratory with aqueous solution of RDX. Manual injections and continuous flowing of the RDX solution with a peristaltic pump at 1 mL/min flow rate were evaluated (Figure 2). In both cases, the SPR response was relatively equivalent within the same dynamic range and with similar sensitivities. The main difference resided in the stability of the baseline, far superior with the use of a peristaltic pump. The reaction rate was higher (no isotherm was observed) for the manual injection, which could be due to the faster exchange of the solution in the fluidic cell than with the peristaltic pump. We observed two dynamic ranges with high sensitivity. A first range covered the concentrations comprised between 1 fM and 500 fM, where the response followed a Langmuir isotherm (Figure S5). The detection limit was about 10 fM with our SPR sensor. The sensor was relatively insensitive in the pM range and was once again very sensitive in the 1 to 50 nM range. The dose-response profile is in agreement with a dual binding site with fM and nM dissociation constant. While the fM range is impressive, the concentration of RDX in contaminated wells should be in the low nM range, as the 2 ppb limit set by the EPA corresponds to 10 nM. Therefore, the calibration of the sensor was performed in the nM range. These analytical figures compared well to other RDX sensors. For example, fluorescent sensors were able to detect 15 ppb (75 nM) 8, in the mM range 13 and 3 pM 9, electrochemical sensors detected 120 ppb (600 nM) 7 and other SPR sensors detected 12 fM 22 and 0.04 ppb (0.2 nM) 21. Lastly, we have evaluated the use of a normalized calibration curve, to mitigate any potential fluctuation of the absolute response from different lots of the SPR sensors. We found optimal to use a 10 nM RDX standard to normalize the response of the different sensors and calibrated the SPR sensor in the environmentally-relevant range of 1-50 nM (Figure 3). Lastly, we verified that TNT, another common energetic material that could be found near most range training areas, did not yield a SPR response at high
concentration with the SPR sensor (Figure S6). Therefore, the selectivity of the sensor was suited for our field campaigns.
Environmental conditions encountered during field campaigns can change significantly. SPR sensing being sensitive to temperature, we calibrated the instrument for RDX in laboratory conditions at different temperatures. The instrument remained at room temperature for these measurements, while the samples were stabilized at different temperatures. The response of the SPR sensor was subtracted to pure water measured at the same temperature and is reported in Table 1. The response of the RDX sensor was larger at lower temperatures by a factor of nearly 5 for 1 pM RDX and by a factor of 2.5 for 10 nM RDX. The sensitivity was also compared for the concentration range of 1 pM to 1 µM using once again signal normalisation with the response for 10 nM RDX. The normalized sensitivity was about twice lower at 2oC than for 36oC, indicating that calibration should be adjusted for different temperatures if a calibration over several orders of magnitude is used. However, using a 10 nM normalization concentration minimizes the drift for the 1 to 50 nM range used for the analysis of the environmental samples, as the response drifted mostly at very low concentration (Figure S7).
On site measurement of the RDX concentration with SPR sensing
The wells located upgradient of the range were not contaminated with RDX and served for the optimization of the sensor by spiking this uncontaminated water with known
Figure 3. Left) Response of the RDX sensor in the pM to nM range normalized to 10 nM showing the plateau in response in the pM range. Right)
Calibration curve for RDX in the environmentally relevant range. The SPR response was normalized to 10 nM. The error bars represent one standard deviation on a triplicate measurement (n = 3).
Table 1. Temperature influence on the sensitivity and SPR
response for RDX in natural water.
Temperature (oC) Normalized sensitivity SPR shift 1 pM (nm) SPR shift 10 nM (nm) 2 0.06 ± 0.01 1.65 ± 0.11 2.5 ± 0.9 20 0.087 ± 0.004 1.09 ± 0.18 1.91 ± 0.35 36 0.13 ± 0.02 0.35 ± 0.16 0.99 ± 0.18
2
3
4
5
6
7
8
9
10
11
12
13
14
15
16
17
18
19
20
21
22
23
24
25
26
27
28
29
30
31
32
33
34
35
36
37
38
39
40
41
42
43
44
45
46
47
48
49
50
51
52
53
54
55
56
57
58
Analyst
Accepted
Manuscript
ARTICLE
Journal Name
concentrations of RDX. It also served for establishing a baseline for the SPR measurements of natural waters.
The SPR system was installed in a temporary shelter (tent, trailer or the tailgate of a SUV) near the wells sampled and the water from the wells was collected using a standard procedure referred to low flow 35. The SPR system was powered from the laptop computer, which could run independently with its battery (for about 90 to 120 minutes) or powered from a generator deployed to the field. The SPR instrument was tested in different seasons and in different conditions ranging from nearly freezing temperatures and snow-covered grounds to hot summer days for Canada of nearly 30oC (Figure S8). Remote wells were accessed by trekking and carrying equipment on a sled in winter conditions (Lab-on-a-sled) or by off-road driving of the SUV in summer conditions
(Lab-in-a-Jeep).
As a first step, comparative measurements were performed on groundwater of a contaminated well and an
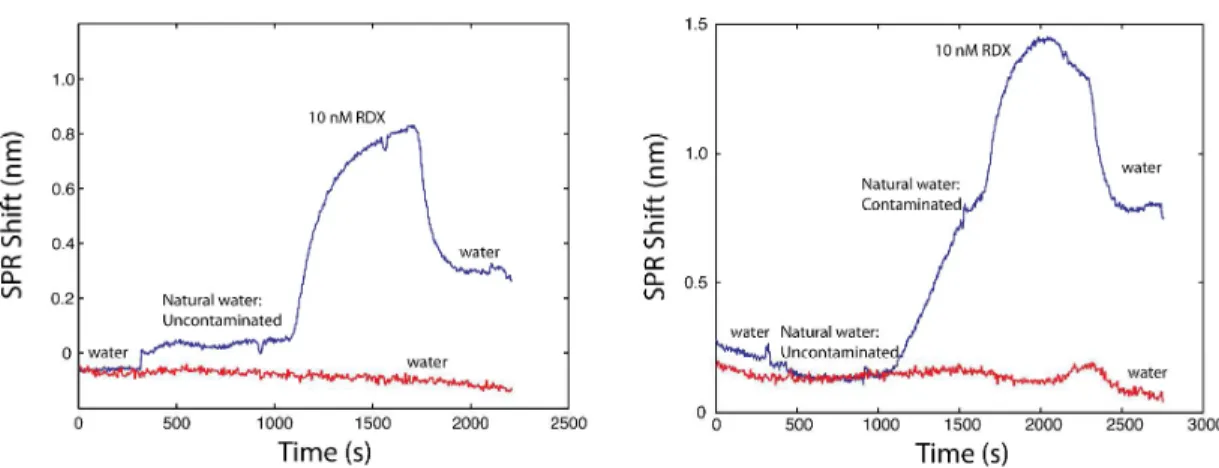
uncontaminated well to assess the capacity of the RDX sensor to discriminate the presence of RDX in natural water and in environmental conditions (Figure 4). Deionised water was first injected to equilibrate the system and record a baseline. Uncontaminated water was then injected for about 10 minutes. A small increase of the baseline was due to the refractive index mismatch between natural water and pure water. Natural water contained dissolved salts and organic matter that slightly increased the refractive index. Otherwise, the SPR response in uncontaminated natural water was relatively flat and comparable to the reference channel. The injection of contaminated water from the well labelled G1-1-5m located closest to the detonation area of the training range led to a strong SPR response. Finally, a 10 nM RDX standard was injected for recalibration. These results clearly show that SPR sensing is sensitive enough for monitoring RDX in contaminated natural water measured directly on site.
Figure 4. Left) SPR sensorgram for an uncontaminated well and a 10 nM RDX calibration point. Right) SPR sensorgram for a highly contaminated well with RDX.
Uncontaminated natural water did not yield any signal. Results acquired in April 2016.
Figure 5. Left) Photograph of the setup for continuously monitoring RDX in effluents of sand columns. Right) SPR sensorgram showing the stable
response of the system for more than 1 day, at different concentrations of RDX. The slow response was due to the low flow rate applied to the sand columns, to mimick hydrogeological conditions.
1
2
3
4
5
6
7
8
9
10
11
12
13
14
15
16
17
18
19
20
21
22
23
24
25
26
27
28
29
30
31
32
33
34
35
36
37
38
39
40
41
42
43
44
45
46
47
48
49
50
51
52
53
54
55
56
57
58
59
Analyst
Accepted
Manuscript
Published on 10 May 2017. Downloaded by Institut nationale de la recherche scientifique (INRS) on 16/05/2017 13:38:07.
The total time from arrival on site to the completion of the SPR measurement required about 60 to 90 minutes per well, which included the time to flush and sample the well, to setup the equipment, to perform the equilibration of the SPR instrument with pure water and uncontaminated water, measure the sample and recalibrate the sensor. This procedure is significantly faster than the current HPLC method of the EPA, which require the sample to be brought back to the centralised laboratory. Hence, the EPA method is not nearly as suited as the SPR method for frequent monitoring of environmental samples.
To test the possibility of continuously monitoring on-site energetic material in natural water, we developed a laboratory experiment mimicking the conditions found in the environment. A Teflon/glass (35 mm ID and 100 mm long) column was packed with natural uncontaminated sand found on a range training area site and different concentrations of RDX were sequentially pumped through the sand column and separated with DI water steps. RDX does not significantly adsorb on this sand and was thus available for detection in SPR. The flow rate was adjusted to loosely match natural flow rate in the sand aquifer (250 m/yr) and to be compatible with the SPR system. The SPR signal was monitored consecutively for at least 1 day and a dose-response was clearly seen for the different concentrations of RDX (Figure 5). The SPR signal was also on the same order of the calibration curves previously established, confirming that the RDX SPR sensor is suited for continuous monitoring. In order to be implemented in common practice, the RDX SPR sensor would have to be thoroughly calibrated and validated in environmental conditions. Temperature stability could be one concern, but groundwater has a generally more stable yearly temperature than surface waterbodies, mainly corresponding to the mean air temperature 36, and could be compensated with the reference channel of the SPR sensor.
While the experiments in environmental conditions were clearly successful, we noted a few potential issues to be considered. The formation of gas bubbles occurred on occasion (mostly in summer conditions), which could be prevented by using a degassing line between the pump and the SPR system. We also had to shield the SPR system and tubing from direct sunlight exposure to avoid sudden temperature drifts. We also noted that data were more accurate by recalibrating the sensor first and then performing the analysis of the contaminated water. Lastly, insect repellent was a must in summer campaigns!
Comparison of the SPR and EPA method 8330b method
Finally, we sampled a small set of wells to compare the SPR results with the current standard method using HPLC analysis (EPA method 8330b). The wells were located downgradient at different distances from the detonation area of the training facility. The samples were immediately analysed on site with the SPR sensor and samples were brought back to the laboratory for HPLC analysis and for a second SPR analysis under laboratory conditions. The SPR results were in excellent agreement with the EPA method (Table 2). The concentration was accurate within 1.6 ppb for the on site and the laboratory measurements. The reproducibility of the SPR measurements were better than 20% RSD on site and in the laboratory. Hence, the SPR method was in agreement with the results provided by the EPA method, with the advantage of being deployed on site, being faster and offering the possibility of continuous monitoring.
Conclusions
The characterisation and validation of a SPR sensor for monitoring RDX concentration at environmentally-relevant concentrations is reported. The sensor was deployed on the field for monitoring RDX contamination in groundwater of several wells nearby a grenade training range of a military base. The response measured on the field was in excellent agreement with the standard EPA method 8330b measured independently. The SPR sensor was deployed in wintery and summer conditions with success. The sensor was also tested for continuous monitoring using environmental condition recreated in the laboratory and the RDX concentration of the effluent could be monitored for at least 1 day. This article clearly demonstrates the potential of portable and field-deployed SPR sensing for environmental sensing.
Acknowledgements
The authors would like to thank Sonia Thiboutot of Defense Research & Development Canada (DRDC), François-David Cloutier of the Canadian Army and Dominic Faucher of the Construction Defense Canada for securing access to the military facilities, to Félix Lussier and Patricia Moraille of the Université de Montréal for the AFM measurements and Trevor Theoret and Kevin J. Wilkinson of Université de Montréal for the dark-field measurements. The authors thank financial support from the Natural Science and Engineering Research Council (NSERC) of Canada, the Minister of National Defence of Canada and of the Canada Foundation for Innovation (CFI).
References
1. M. Mailloux, R. Martel, U. Gabriel, R. Lefebvre, S. Thiboutot and G. Ampleman, J. Environ. Qual., 2008, 37, 1468.
Table 2. Comparative study of the SPR method and the EPA method
8330b with different wells sampled on site*, concentrations reported in ppb
Method Well 1 Well 2 Well 3
EPA 8330b** 5.8 3.8 1.9
SPR on site 6.2 ± 1.2 2.2 ± 0.1 1.8 ± 0.3
SPR laboratory 4.5 ± 0.8 3.0 ± 0.4 1.8 ± 0.2
* Conditions: Late summer, 27 to 29oC, dew point below 14oC
** EPA method 8330b has a 1-3% RSD
2
3
4
5
6
7
8
9
10
11
12
13
14
15
16
17
18
19
20
21
22
23
24
25
26
27
28
29
30
31
32
33
34
35
36
37
38
39
40
41
42
43
44
45
46
47
48
49
50
51
52
53
54
55
56
57
58
Analyst
Accepted
Manuscript
ARTICLE
Journal Name
2. 2011 Edition of the Drinking Water Standards and Health Advisories, United States Environmental Protection
Agency, Washington, DC, 2011.
3. HealthCanada, Guidelines for Canadian Drinking Water
Quality—Summary Table. Water and Air Quality Bureau, Healthy Environments and Consumer Safety Branch,
Health Canada, Ottawa, Ontario, 2014.
4. EnvironnementCanada, Federal Contaminated Sites Action
Plan (FCSAP). Federal Interim Groundwater. Quality Guidelines for federal contaminated sites, Report ISBN –
978-0-660-20896-1, Environnement Canada, 2016. 5. EnvironnementCanada, Federal Contaminated Sites Action
Plan (FCSAP) - guidance document on federal interim groundwater quality guidelines for federal contaminated sites, Report ISBN: 978-1-100-22281-3, Environment
Canada, 2013.
6. Nitroaromatics, nitramine, and nitrate esters by high performance liquid chromatography (HPLC), Report
Method 8330B, US EPA, 2006.
7. S.-Y. Ly, D.-H. Kim and M.-H. Kim, Talanta, 2002, 58, 919-926.
8. J. C. Bart, L. L. Judd and A. W. Kusterbeck, Sensors and
Actuators B: Chemical, 1997, 39, 411-418.
9. N. Enkin, E. Sharon, E. Golub and I. Willner, Nano Letters, 2014, 14, 4918-4922.
10. A. D. Hughes, I. C. Glenn, A. D. Patrick, A. Ellington and E. V. Anslyn, Chemistry – A European Journal, 2008, 14, 1822-1827.
11. W. J. Peveler, A. Roldan, N. Hollingsworth, M. J. Porter and I. P. Parkin, ACS Nano, 2016, 10, 1139-1146.
12. A. Ponnu and E. V. Anslyn, Supramolecular Chemistry, 2010, 22, 65-71.
13. A. Ponnu, N. Y. Edwards and E. V. Anslyn, New Journal of
Chemistry, 2008, 32, 848-855.
14. M. D. Woodka, V. P. Schnee and M. P. Polcha, Analytical
Chemistry, 2010, 82, 9917-9924.
15. A. Üzer, Z. Can, İ. Akın, E. Erçağ and R. Apak, Analytical
Chemistry, 2014, 86, 351-356.
16. M. Couture, S. S. Zhao and J.-F. Masson, Physical
Chemistry Chemical Physics, 2013, 15, 11190-11216.
17. D. R. Shankaran, K. V. Gobi and N. Miura, Sensors and
Actuators B: Chemical, 2007, 121, 158-177.
18. J. Homola, Chemical Reviews, 2008, 108, 462-493. 19. H. Wei, S. M. Hossein Abtahi and P. J. Vikesland,
Environmental Science: Nano, 2015, 2, 120-135.
20. M. Li, S. K. Cushing and N. Wu, Analyst, 2015, 140, 386-406.
21. Y. Tanaka, R. Yatabe, K. Nagatomo, T. Onodera, K. Matsumoto and K. Toko, Ieee Sensors Journal, 2013, 13, 4452-4458.
22. M. Riskin, R. Tel-Vered and I. Willner, Advanced Materials, 2010, 22, 1387-+.
23. T. Akimoto, S. Wada and I. Karube, Analytica Chimica
Acta, 2008, 610, 119-124.
24. T. M. Chinowsky, J. G. Quinn, D. U. Bartholomew, R. Kaiser and J. L. Elkind, Sensors and Actuators B-Chemical, 2003,
91, 266-274.
25. T. M. Chinowsky, S. D. Soelberg, P. Baker, N. R. Swanson, P. Kauffman, A. Mactutis, M. S. Grow, R. Atmar, S. S. Yee and C. E. Furlong, Biosensors & Bioelectronics, 2007, 22, 2268-2275.
26. F. Fernandez, K. Hegnerova, M. Piliarik, F. Sanchez-Baeza, J. Homola and M. P. Marco, Biosensors & Bioelectronics, 2010, 26, 1231-1238.
27. J. F. Masson, L. Obando, S. Beaudoin and K. Booksh,
Talanta, 2004, 62, 865-870.
28. J.-F. Masson, Y.-C. Kim, L. A. Obando, W. Peng and K. S. Booksh, Applied Spectroscopy, 2006, 60, 1241-1246. 29. O. R. Bolduc, L. S. Live and J.-F. Masson, Talanta, 2009, 77,
1680-1687.
30. S. S. Zhao, N. Bukar, J. L. Toulouse, D. Pelechacz, R. Robitaille, J. N. Pelletier and J.-F. Masson, Biosensors &
Bioelectronics, 2015, 64, 664-670.
31. A. N. Naimushin, C. B. Spinelli, S. D. Soelberg, T. Mann, R. C. Stevens, T. Chinowsky, P. Kauffman, S. Yee and C. E. Furlong, Sensors and Actuators B: Chemical, 2005, 104, 237-248.
32. J. Homola, S. S. Yee and G. Gauglitz, Sensors and Actuators
B: Chemical, 1999, 54, 3-15.
33. J. R. Dean, Environmental Trace Analysis: Techniques and
Applications, John Wiley & Sons, Ltd, 2014.
34. M. Couture, T. Brule, S. Laing, W. Cui, M. Sarkar, K. Faulds, W. Peng, M. Cnava and J. F. Masson, Submitted for
publication, 2017.
35. Low-flow (minimal drawdown) ground-water sampling procedures, Office of Solid Waste and Emergency Response, Report EPA/540/S-95/504, US EPA 1995.
36. R. A. Freeze and J. A. Cherry, Groundwater, Prentice-Hall, Englewood Cliffs. London, 1979.
1
1
2
3
4
5
6
7
8
9
10
11
12
13
14
15
16
17
18
19
20
21
22
23
24
25
26
27
28
29
30
31
32
33
34
35
36
37
38
39
40
41
42
43
44
45
46
47
48
49
50
51
52
53
54
55
56
57
58
59
Analyst
Accepted
Manuscript
Published on 10 May 2017. Downloaded by Institut nationale de la recherche scientifique (INRS) on 16/05/2017 13:38:07.