Science Arts & Métiers (SAM)
is an open access repository that collects the work of Arts et Métiers Institute of
Technology researchers and makes it freely available over the web where possible.
This is an author-deposited version published in: https://sam.ensam.eu Handle ID: .http://hdl.handle.net/10985/17641
To cite this version :
Laurent BERTHE, Natalia S. BEZAEVA, Jerôme GATTACECA, Michel BOUSTIE, Thibaut DE RESGUIER, Pierre ROCHETTE - Behavior of basalt under laser-induced shock-wave application to the planetary hypervelocity impact effect Journal of Laser Applications Vol. 23, n°1, p.17 -2011
Any correspondence concerning this service should be sent to the repository Administrator : [email protected]
Behavior of basalt under laser-induced shock-wave application to the
planetary hypervelocity impact effect
Laurent Berthea兲
Laboratoire PIMM, UPR CNRS 8006/ARTS et METIERS PARIS TECH, 151 Boulevard de l’Hôpital, 75013 Paris, France
Natalia S. Bezaeva
CEREGE, UMR CNRS/Aix-Marseille Université, BP 80, 13545 Aix-en-Provence Cedex 4, France;
Department of Earth Science and Engineering, Imperial College London, South Kensington Campus, London SW7 2AZ, United Kingdom; and Earth Physics Department, Faculty of Physics, M.V. Lomonosov
Moscow State University, Leninskie gory, 119991 Moscow, Russia
Jerôme Gattaceca
CEREGE, UMR CNRS/Aix-Marseille Université, BP 80, 13545 Aix-en-Provence Cedex 4, France
Michel Boustie and Thibaut de Rességuier
Laboratoire de Combustion et de Détonique, UPR CNRS 9028, ENSMA, 1 Avenue C. Ader, B.P. 40109, 86961 Futuroscope Cedex, France
Pierre Rochette
CEREGE, UMR CNRS/Aix-Marseille Université, BP 80, 13545 Aix-en-Provence Cedex 4, France
This paper presents the results of an investigation of the impact of laser-induced shock on basalt samples in a water confinement regime. In order to observe the effect of laser shock-wave propagation, in this material, the rear free surface velocity is measured by a velocimetry interferometer system for any reflector under various specified conditions. Parameters for an elastoplastic constitutive law and the Kanel’s damage model are provided and have been set up in such a way to ensure good correlation between numerical simulations and laboratory experiments. These resultant material properties, identified for the basalt sample studied here, could be used in future investigations looking to further correlating residual effects in material with pressure levels induced by water confined laser-matter interaction. This is of particular importance in meteoritics and planetary science due to the fact that hypervelocity impacts represent a major event taking place in the solar system, and shock waves generated during hypervelocity impacts can significantly affect physical properties of extraterrestrial materials and solid solar system bodies such as Mars, the Moon, asteroids, and others.
Key words: Shock, laser, hypervelocity, planetary, magnetization, mechanical properties
I. INTRODUCTION
For investigations of the effects of hypervelocity impacts on the solid solar system bodies 共e.g., Earth, Mars, the Moon, etc.兲, it is essential to know the mechanical behavior of rocks under strong shock waves. For example, the effect of shock waves on the remanent magnetization of basalt can help for better understanding and interpretation of planetary magnetic anomalies observed above impact basins.1,2 How-ever, the evolution of magnetic properties caused by hyper-velocity impacts can be correlated with mechanical effects only if the physical response of basalt under such shock events is well understood.
Compared to widely used plate impact and explosive shock experimental techniques, high-power laser offers an incomparable flexibility allowing an easy recovery of samples共thicker than 3 mm in the present paper兲 and a wide
range of experimental settings共such as a possibility of labo-ratory shock simulation under a controlled background mag-netic field3兲. Besides, a laser can generate a wide range of shock peak pressures from gigapascals4,5 to terapascals6,7 with different shock durations,8 allowing the simulation of loading conditions close to those induced by impacts at a very small scale. By now, very few papers have been pub-lished using this promising experimental technique of laser driven shock. Previous results were limited to postmortem analysis of recovered samples. No material properties could be really produced and further investigated.9
Some works have been done on mechanical properties of basalt.10,11 However, they show finally that each rock has proper properties depending on loadings and sources. So, they have to be characterized separately for each source and each loading performed for impact simulations.
This paper presents the evaluation of mechanical prop-erties of a Pleistocene basalt from France共see below兲 using shock waves, generated by pulsed laser in a water confine-a兲Electronic mail: [email protected]
ment regime共WCR兲.12This study proposes the modeling of material in reproducing rear free surface velocity 共RFSV兲 measured by a velocimetry interferometer system for any reflector 共VISAR兲. The first part of the paper presents the experimental setup, and the second part presents a numerical model used to reproduce experimental rear free surface ve-locities. The last part highlights and discusses the main re-sults.
II. EXPERIMENTAL SETUP
The experimental setup is presented in Fig.1. It is based on the configuration typical for investigations of shock waves, induced by laser in WCR using a VISAR tool. The numbering on figures corresponds to different parts of the setup.
The laser shock generator from Quantel Company 共1兲 共LCD Facility, Poitiers, France兲 delivers about 25 J in 20 ns at 1064 nm. The spot diameter is 4 mm, which enables one to ensure a one-dimensional13 propagation through the target during the acquisition time. The maximum power density is 6 GW cm−2.
The continuous laser probe for RFSV measurements共4兲 is a VERDI model from Coherent Company working at 532 nm with a maximum power of 5 W to light the rear face of the target 共3兲 covered in front by 1 mm of water. The re-flected light from the rear free surface is collected by a lens 共6兲 and a drilled mirror 共5兲 to be focused 共6兲 inside an optical fiber 共7兲 for transfer to the VISAR 共8兲 共from Valyn Com-pany兲. This tool is based on a Michelson type interferometer14 and allows velocity measurements from 50 m s−1to several thousands of m s−1with a time precision ranging from 0.5 to 1 ns共according to the velocity range兲.
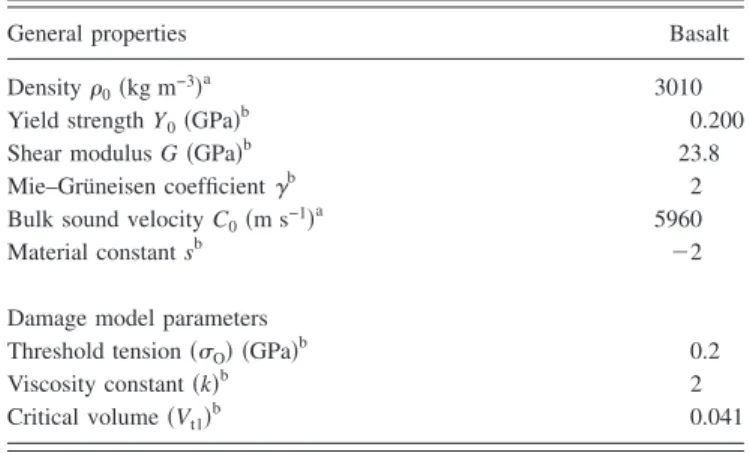
The target sample is a Pleistocene basalt from Chan-teuges 共Haute-Loire, France兲. Table I provides some infor-mation on the properties—parameters of interest for shock-wave propagation. Density and bulk sound velocity values
come from direct measurement on the sample;3other values, presented in TableI, come from numerical simulations per-formed to reproduce experimental RFSV. The initial basalt sample is cut using a diamond wire saw into slices 共sub-samples兲, whose thickness is between 250 and 3000 m 共unchangeable within each particular subsample兲. For each target thickness, experiments have been carried out at two power densities: 1.27⫾0.13 and 5.42⫾0.85 GW/cm2. For thickness higher than 2500 m, targets can be recovered for cross-section analysis using a scanning electron microscope 共SEM兲.
III. SIMULATION TOOLS
A. Models for laser interaction in WCR
Pressure loadings generated by laser in WCR have been calculated according to Refs. 15 and 16. Pressure profiles have been experimentally validated in Ref. 5 with VISAR RFSV measurements.
The maximum pressure, generated by laser plasma in WCR, is given by the following relationship:15
P共GPa兲 = 0.01
冑
␣␣+ 3
冑
Z共g cm−2s−1兲
冑
I0共GW cm−2兲, 共1兲 where ␣ is the fraction of the internal energy devoted to thermal energy共typically␣= 0.25兲, I0is the incident power density, and Z is the reduced shock impedance between the target and the confining water,
2/Z = 1/Zwater+ 1/Ztarget. 共2兲
For the basalt target in the water confined regime, Zwater = 0.165⫻106 g cm−2s−1, Z
basalt=0C0= Ztarget= 1.8
⫻106 g cm−2s−1, and Z = 3.04⫻105 g cm−2s−1.
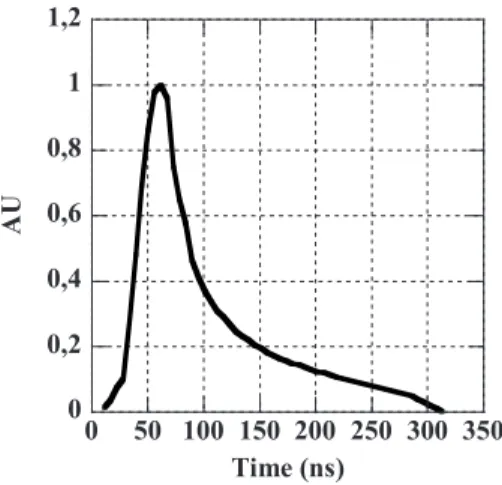
Figure 2 shows typical pressure loadings used in the SHYLAC software 共see below兲 computation of shock-wave propagation in basalt. The pressure duration共45 ns兲 is about twice the pulse duration 共20 ns兲 as set up in numerical models. So, the mean pressure peaks, generated for the two experimental power densities 共1.27⫾0.13 and 5.42⫾0.85 GW/cm2兲, are 1.72 and 3.55 GPa, respectively. 2 3 4 5 6 1 7 8 6 6 2 3 4 5 6 1 7 8 6 6 3 4 5 6 1 7 8 6 6
FIG. 1. Experimental setup used for investigations of the behavior of basalt under shock waves, induced by laser in water confinement regime. 1: Laser, 2: water layer for confinement, 3: target, 4: laser probe for rear free surface velocity of target measurement, 5: drilled mirror, 6: lens, 7: fiber, 8: VISAR.
TABLE I. Properties of the target basalt.
General properties Basalt
Density0共kg m−3兲a 3010
Yield strength Y0共GPa兲b 0.200
Shear modulus G共GPa兲b 23.8
Mie–Grüneisen coefficient␥b 2
Bulk sound velocity C0共m s−1兲a 5960
Material constant sb ⫺2
Damage model parameters
Threshold tension共O兲 共GPa兲b 0.2
Viscosity constant共k兲b 2
Critical volume共Vt1兲b 0.041
aMeasured共Ref.2兲.
B. Propagation of shock waves usingSHYLAC
software
TheSHYLACsoftware共which is a French abbreviation of “Simulation Hydrodynamique Lagrangienne des Chocs”兲 has been developed at Laboratoire de Combustion et de Détonique, Futuroscope, France for numerical simulations of shock-wave propagation in solids. The physics and computation scheme are detailed in Refs.17and18.SHYLAC is a one-dimensional finite differences code solving the three conservation equations of mass, momentum, and energy.
The Mie–Grüneisen equation of state was used with a reference to the single shock Hugoniot. The Hugoniot is described by the relationship
D = C0+ su, 共3兲
where D is the shock velocity, C0 is the sound speed at the initial state, s is the dimensionless material constant, and u is the material velocity. This empirical equation is based on experimental shock-wave data first obtained in Ref. 19. An elastic-plastic behavior is included in the code. The axial stress component is calculated as
= − P + 2/3Y0, 共4兲
where P is the hydrostatic pressure and 2/3Y0 is the deviatoric stress 共with Y0 being the yield strength兲. A standard linear elastic evolution of solid is used in the Von Mises condition to find the elastic/plastic boundary: Strain cannot exceed Y0/共2G兲 共where G is the shear modulus兲 or deviatoric stress cannot exceed 2/3Y0.
The dynamic material damage is described with a continuous kinetic criterion, developed by Kanel.20 The growth of a damage parameter Vt, corresponding to the specific volume of voids inside the target, is calculated by
For 兩兩 ⬎ 兩Oe兩, dVt/dt = − k sign共P兲共兩兩 −Oe兲共Vt
− Vt1兲, 共5兲
For 兩兩 ⬍ 兩Oe兩, dVt/dt = 0, 共6兲
with Oe=O共Vt1/Vt+ Vt1兲. 共7兲 The three parameters in the spallation model mean: O, the threshold tension from which the damage process starts; k, a constant depending on the viscosity related to the strain rate; and Vt1, the critical value of Vtfrom which the growth rate accelerates exponentially.
This model has been extensively developed and validated in the case of spallation induced by laser in Ref.
21. Table I provides the mechanical properties and damage model parameters for basalt target used for SHYLAC simulations.
IV. RESULTS AND DISCUSSIONS A. Typical RFSV
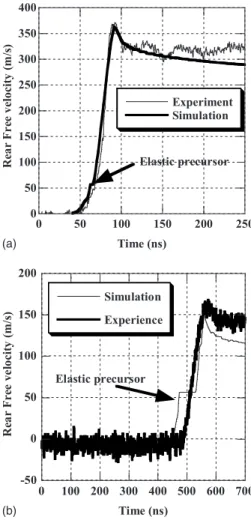
Figure3shows a typical RFSV for a basalt foil at power density of 1.27⫾0.13 GW/cm2. It looks like a typical profile for spallation phenomena22 induced by laser.4 It can be separated in two parts: a peak of velocity 共155 m/s兲, which is related to the first occurrence of shock wave at the rear surface, and a constant velocity 共120 m/s兲, which corresponds to the flight velocity of the expelled spall. The last part occurs during the decrease of the first peak velocity. Figure 3 also shows a comparison with computer simulations. As seen from Fig.3, our computation is in good agreement with the experimental profile. However, the elastic precursor breaks ahead of the shock-wave front 共as the elastic wave velocity is higher than the plastic wave velocity兲 on simulation 共60 m/s兲 but not as clearly on the experimental profile.
B. Attenuation as a function of thickness
Figure 4 shows the first peak of RFSV versus the thickness of basalt target for the two power densities. For both intensities, velocity decreases as thickness increases. For 5.42⫾0.85 GW/cm2, velocity decreases from 360 to 150 m/s, from 250 to 3000 m, respectively. For 1.23⫾0.13 GW/cm2, velocity drops from 180 to 70 m/s, from 250 to 3000 m, respectively. Computation using
0 0,2 0,4 0,6 0,8 1 1,2 0 50 100 150 200 250 300 350 AU Time (ns)
FIG. 2. Typical pressure loadings onto targets used inSHYLACsimulations.
-50 0 50 100 150 200 0 50 100 150 200 250 300 Experiment Simulation R ear Fre e ve lo ci ty (m /s) Time (ns)
FIG. 3. Typical RFSV for a 500 m basalt foil at the laser power density of 1.27⫾0.13 GW/cm2. Comparison withSHYLACsimulation共peak pressure loading of 1.7 GPa兲.
SHYLAC software is in relatively good agreement with experiments. Consequently, material properties of basalt 共Table I兲 could be used for further investigations aiming to
correlate residual effect in material to pressure levels induced in WCR.
C. Material constant s
Among properties, a negative material constant s is not conventional 关see Table I 共s=−2兲兴. It has been already
reported, for example, for Vacaville basalt. A negative material constant implies a spreading of the front of shock wave during the propagation inside the material, because bulk sound velocity is lower with high material velocity关see Eq.共3兲兴. Present results clearly evidence the spreading of the shock front. For instance, Figs.5共a兲and5共b兲 present typical RFSVs for basalt targets of 250 and 3000 m in thickness, respectively, at the highest power density. The rising times of the first velocity peak are 38 and 74 ns at 250 and 3000 m, respectively. The shock front is well reproduced by simulation, including a negative material constant s.
The validation of this material property can also be confirmed by the shock-wave mean velocity. It depends on shock velocity and material constant s, expressed by Eq.共3兲. Figure6shows this velocity as a function of thickness of the target sample for the two loadings of experiments 共1.7 and 3.55 GPa兲. Curves can be separated in two parts. For the first part, up to 2000 m, mean velocity increases as a function of thickness 共e.g., 2400 m/s at 250 m and 5000 m/s at 1500 m for 1.7 GPa loadings兲. For the second part, starting from 2000 m and up, mean velocity saturates at the bulk velocity C0= 5960 m/s 共see Table I兲. These variations are in agreement with Eq. 共3兲. As the material constant is negative, the shock velocity is clearly below the bulk velocity. When the thickness increases, the material velocity decreases共see Fig.4兲 due to the shock attenuation,
and so the velocity reaches bulk velocity. Measurements and SHYLACsimulations have a good correlation, which confirms the plausibility of the model used for simulations.
D. Material heterogeneities
There are some discrepancies between the model and experiments.共1兲 In Fig.4, there are some variations between simulations and experiments reaching up to 30% 共e.g., for the 750 m target at the highest power density, SHYLAC gives 280 m/s against 360 m/s for experiment兲; 共2兲 the
0 100 200 300 400 500 0 500 1000 1500 2000 2500 3000 3500 Sim. (1.7 GPa) Sim. (3.55 GPa) Exp. (3.55 GPa) Exp. (1.7 GPa) Fi rs tp ea k of rear fre e surf ace velo ci ty (m /s ) Thickness (um)
FIG. 4. First peak of RFSV as a function of thickness for basalt at the lowest and highest loadings. Black circle: experiment at 5.42⫾0.85 GW/cm2; straight line corresponds to the simulation at peak pressure loading of 3.55 GPa; open circle: experiment at 1.27⫾0.13 GW/cm2; dashed line corre-sponds to the simulation at peak pressure loading of 1.7 GPa.
0 50 100 150 200 250 300 350 400 0 50 100 150 200 250 Experiment Simulation R ear Fre e ve lo ci ty (m /s) Time (ns) Elastic precursor (a) -50 0 50 100 150 200 0 100 200 300 400 500 600 700 Simulation Experience Re ar Fr ee vel oc ity (m /s) Time (ns) Elastic precursor (b)
FIG. 5. Typical RFSV at the lowest laser power density of 5.42⫾0.85 GW/cm2for共a兲 250 and 3000 m basalt foils.共b兲 Comparison withSHYLACsimulations共peak pressure loading of 3.5 GPa兲.
0 1000 2000 3000 4000 5000 6000 0 500 1000 1500 2000 2500 3000 3500 Sim. 3.55 Gpa Sim. 1.7 GPa Exp. 1.7 GPa Exp. 3.55 GPa M ean sh oc k V el oc ity (m /s ) Thickness (um)
FIG. 6. Mean shock velocity as a function of thickness for high共3.55 GPa兲 and low 共1.7 GPa兲 loadings. Comparison of laboratory experiments and computer simulations.
elastic precursor ahead of the shock wave does not appear clearly on the experimental profile for thick target关see Figs.
5共a兲and 5共b兲兴. However, for the thickest target 关Figs. 5共a兲 and 5共b兲兴, the elastic precursor is longer than that for the thinnest target. Indeed, it has a velocity lower than the shock-wave one22 and propagates ahead the shock wave for longer time with thicker target.
These differences could be due to material heterogeneities. Indeed, this basalt has a crystallized matrix with an intergranular texture containing different minerals 共e.g., clinopyroxene, plagioclase, olivine, and opaque minerals, among others兲, whose properties could be very different. This basalt also contains about 5% of phenocrystals 共mainly olivine and clinopyroxene in equal proportion, and some rare opaque minerals兲, which are up to 1.5 mm in size. It is obvious that a numerical model cannot take into account these small-scale heterogeneities.
E. Damage models
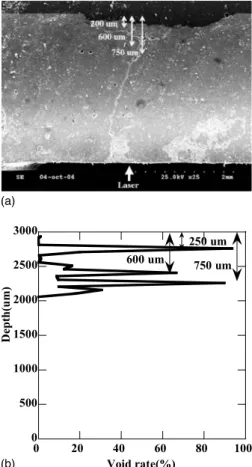
SHYLAC predicts the damage location inside the target which can be compared with the experimental one as in Fig.
7. Figure7共a兲shows a SEM image of a recovered sample of 3000 m irradiated by the lowest power density 共1.27⫾0.13 GW/cm2兲. The laser beam comes from the bottom of the sample. Three areas can be observed. The first
area is up to 250 m from the rear free surface. The basalt sample is expelled by the damage process: There is no more material left. The second area is close to 600 m from the rear surface: A fracture along the surface occurs without any expulsion of material. In the third area, at 700 m from the rear surface, a deep fracture is generated. It propagates toward the front surface. Figure 7共b兲 presents the computation of rate of void as a function of thickness for loading, which corresponds to that in Fig. 7共a兲 共peak pressure loading of 1.7 GPa兲. Three main void locations are also clearly evidenced at the same location as those observed on cross section in Fig. 7共a兲: 200, 600, and 750 m. However, the code does not reproduce the fracture going up to the front surface. Indeed, the propagation of the fracture could be produced at longer time than this simulation 共700 ns兲. It is obvious that a one-dimensional and one damage model is not adapted to treat accurately this case of fractures. To be computed correctly, it necessitates the use of multidimensional models. However, both damage location and RFSV are in agreement with experiments and validate the damage model, used in simulations for the time scale of experiments. For further investigations concerning residual effect, induced by laser shocks, the best way is to use thicker samples to avoid damage processes, induced near the rear free surface.3
V. CONCLUSIONS
The behavior of basalt under shock induced by laser in WCR is investigated in detail. Numerical simulations using SHYLAC software reproduce experimental measurements of RFSV for loadings under 6 GPa and initial duration in the range of 50 ns. Under these conditions, the set of parameters for the constitutive elastoplastic law and Hugoniot descrip-tion evidence the main features of propagadescrip-tion demonstrated by laboratory experiments: a decrease of shock velocity when shock pressure increases, leading to a spreading of compression instead of a stiffening as in most of materials. With these parameters, the decay of the initial loading can be reproduced after propagation within a few millimeters. Con-cerning the damaging of the basalt upon traction, induced by shock-wave propagation, an average estimate can be pro-vided with Kanel’s model for locating coarsely the damaged zone and reproducing the corresponding RFSV. All these data can be used for further works aiming to correlate re-sidual effect in basalt to pressure levels induced by water confined laser-matter.
1J. Gattacceca, A. Lamali, P. Rochette, M. Boustie, and L. Berthe, “The effects of explosive-driven shocks on the natural remanent magnetization and the magnetic properties of rocks,”Phys. Earth Planet. Inter. 162, 85–98共2007兲.
2J. Gattacceca, M. Boustie, B. P. Weiss, P. Rochette, E. Lima, L. E. Fong, and F. Baudenbacher, “Investigating impact demagnetization through la-ser impacts and SQUID microscopy,”Geology 34, 333–336共2006兲. 3J. Gattacceca, L. Berthe, T. Boustie, T. Vadeboin, P. Rochette, and T. De
Resseguier, “On the efficiency of shock magnetization processes,”Phys. Earth Planet. Inter. 166, 1共2008兲.
4L. Tollier, R. Fabbro, and E. Bartnicki, “Study of the laser-driven spalla-tion process by the velocity interferometer system for any reflector inter-ferometry technique. I. Laser shock characterization,”J. Appl. Phys. 83, 1224–1230共1998兲. (a) 0 500 1000 1500 2000 2500 3000 0 20 40 60 80 100 Void rate(%) 600 um 750 um 250 um De p th (um ) (b)
FIG. 7.共a兲 Image by SEM of a cross section of 3000 m basalt foil at laser power density of 1.27⫾0.13 GW/cm2;共b兲 corresponding rate of void, cal-culated usingSHYLAC software at time of 700 ns from the irradiation of 1.27⫾0.13 GW/cm2共peak pressure loading: 1.7 GPa兲. Laser beam comes from bottom共location: 0 m兲. Rear free surface is on the top.
5L. Berthe, R. Fabbro, P. Peyre, L. Tollier, and E. Bartnicki, “Shock waves a from water-confined laser-generated plasma,”J. Appl. Phys. 82, 2826– 2832共1997兲.
6R. J. Trainor, J. W. Shaner, J. M. Auerbach, and N. C. Holmes, “Ultrahigh pressure laser-driven shock-wave experiments in aluminum,”Phys. Rev. Lett. 42, 1154–1157共1979兲.
7R. Cauble, D. W. Phillion, T. J. Hoover, N. C. Holmes, J. D. Kilkenny, and R. W. Lee, “Demonstration of 0.75 Gbar planar shocks in X ray driven colliding foils,”Phys. Rev. Lett. 70, 2102–2105共1993兲. 8T. de Rességuier, H. He, and P. Berterretche, “Use of laser-accelerated
foils for impact study of dynamic material behaviour,”Int. J. Impact Eng.
31, 945–956共2005兲.
9J. A. Bolger, C. S. Monstross, and A. V. Rode, “Shock wave in basalt rock generated with high powered lasers in confined geometry,”J. Appl. Phys. 86, 5461–5466共1999兲.
10T. J. Ahrens and M. L. Johnson, Shock Wave Data for Rocks, Rock
Phys-ics and Phase Relations, Handbook of Physical Constants 共American
Geophysical Union, Washington, D.C., 1995兲, pp. 35–43.
11S. Nakazawa, S. Watanabe, Y. Iijima, and M. Kato, “Experimental inves-tigation of shock wave attenuation in basalt,” Icarus 156, 539–550 共2002兲.
12N. C. Anderholm, “Laser generated stress wave,”Appl. Phys. Lett. 16, 113–115共1970兲.
13M. Boustie, J. P. Cuq-Lelandais, C. S. Bolis, S. Barradas, M. Arrigoni, T. de Resseguier, and M. Jeandin, “Study of damage phenomena induced by edge effects into materials under laser driven shocks,” J. Phys. D: Appl.
Phys. 40, 7103–7108共2007兲.
14L. M. Barker and R. E. Hollenbach, “Laser interferometer for measuring high velocities of any reflecting surface,”J. Appl. Phys. 43, 4669–4675 共1972兲.
15R. Fabbro, J. Fournier, P. Ballard, D. Devaux, and J. Virmont, “Physical study of laser-produced plasma in confined geometry,”J. Appl. Phys.68, 775–784共1990兲.
16A. Sollier, L. Berthe, B. Bartnicki, P. Peyre, and R. Fabbro, “Study of dense-low temperature plasma generated during laser shock processing of metallic materials in water confined regime,” IFSA Conference共Elsevier, Kyoto, 2001兲, pp. 1060–1064.
17Y. B. Zel’dovich and Y. P. Raizer, Physics of Shock Waves and
High-Temperature Hydrodynamic Phenomena共Academic, New York, 1966兲,
Vol. I, pp. 1–96.
18F. Cottet and M. Boustie,J. Appl. Phys. 66, 4067–4073共1989兲. 19M. H. Rice, R. G. d. Mc Queen, and J. M. Walsh, Solids State Physics,
edited by F. Steiz and D. Thurnbull共Academic, New York, 1958兲, Vol. 6, pp. 1–63.
20T. Antoun, L. Seaman, D. R. Curan, G. I. Kanel, S. V. Razorenov, and A. V. Utkin, Spall fracture,”共Springer, New York, 2003兲.
21L. Tollier, R. Fabbro, and E. Bartnicki, “Study of the laser-driven spalla-tion process by the velocity interferometer system for any reflector inter-ferometry technique. II. Experiment and simulation of the spallation pro-cess,”J. Appl. Phys. 83, 1231–1237共1998兲.
22T. Antoun, L. Seaman, D. R. Curan, G. I. Kanel, S. V. Razorenov, and A. V. Utkin, Spall Fracture共Springer-Verlag, New York, 2003兲, pp. 39–55.