HAL Id: hal-01578974
https://hal-mines-albi.archives-ouvertes.fr/hal-01578974
Submitted on 25 Oct 2017HAL is a multi-disciplinary open access archive for the deposit and dissemination of sci-entific research documents, whether they are pub-lished or not. The documents may come from teaching and research institutions in France or abroad, or from public or private research centers.
L’archive ouverte pluridisciplinaire HAL, est destinée au dépôt et à la diffusion de documents scientifiques de niveau recherche, publiés ou non, émanant des établissements d’enseignement et de recherche français ou étrangers, des laboratoires publics ou privés.
Simulation of IR Heating for Composite Stamping
Abdelmagid El Bakali, Olivier de Almeida, Jérôme Bikard, Maxime Villière,
Fabrice Schmidt, Yannick Le Maoult, Myriam Dauphin
To cite this version:
Abdelmagid El Bakali, Olivier de Almeida, Jérôme Bikard, Maxime Villière, Fabrice Schmidt, et al.. Simulation of IR Heating for Composite Stamping. ESAFORM 2013 - 16th An-nual ESAFORM conference on material forming, Apr 2013, Aveiro, Portugal. p.1523-1529, �10.4028/www.scientific.net/KEM.554-557.1523�. �hal-01578974�
SIMULATION OF IR HEATING FOR COMPOSITE STAMPING
EL BAKALI Abdelmagid
1,a, DE ALMEIDA Olivier
1,b, BIKARD Jérôme
2,c,
VILLIERE Maxime
3,d, SCHMIDT Fabrice
1,e, LE MAOULT Yannick
1,f,
DAUPHIN Myriam
1,g1 Université de Toulouse, Institut Clément Ader, Mines Albi, INSA, ISAE, UPS, Campus Jarlard,
Route de Teillet, 81013 Albi Cedex 09 - France
2Rhodia-Solvay, Laboratoire New Tech, 85 rue des Frères Perret BP 62, 69192 Saint Fons Cedex
- France
3 Université de Nantes, CNRS, Laboratoire de Thermocinétique de Nantes, UMR 6607, La
Chantrerie, rue Christian Pauc, BP 50609, 44306 Nantes cedex 3 – France
aaelbakal@mines-albi.fr, bolivier.dealmeida@mines-albi.fr, cjerome.bikard@eu.rhodia.com, dmaxime.villiere@univ-nantes.fr, efabrice.schmidt@mines-albi.fr, fyannick.lemaoult@mines-albi.fr,
gmdauphin@mines-albi.fr
Keywords: Comsol Multiphysics™, IR-Heating, Thermoplastic Matrix Composites.
Abstract.
A first modelling approach of the heating step of the composite stamping process is proposed in this study wherein the composite is considered as a homogeneous material. The thermal and optical properties have been measured and implemented in the commercial software Comsol Multiphysics™ in order to predict the temperature field throughout a composite volume. The proposed methodology is applied to three Polyamide 6.6 composites reinforced with carbon or glass fibres and simulations are compared with experimental results. Moreover, an original method based on inverse analysis and using IR camera measurements has been developed in order to determine the in-plane thermal conductivity of thin composite sheets.
Introduction
Thermoplastic composites stamping is a two steps process that consists first in heating composite sheets in an infrared heating oven and then to form it under press in a mid-temperature heated die. The optimization of such process is therefore a complex problem due to the heterogeneous structure of thermoplastic composites. For example, the deformation behaviour of dry multiplies woven structures during the forming step and the thermal conductivity of composite materials are still major issues [1].
The aim of this study is to propose a simplified modelling approach of the heating stage in considering the composite material as a homogeneous material. The methodology used has been applied to polyamide 6.6 composites and the model validation has been assessed thanks to comparison between numerical and experimental results.
As a first approach, the homogeneous transient heat balance equation will be solved (Eq. 1). Indeed, computing the temperature field resulting from infrared radiation amounts to solving the heat transfer equation including both conductive qc and radiative qr heat fluxes.
ρmCp∂T ∂t = −∇. qc +qr
(
)
(1)Solving this equation thus requires the identification of composite thermal and optical properties. For such a goal, different techniques have been used in order to measure the variation of heat capacity versus temperature, the anisotropic conductivity tensor and the interaction of the material with IR radiation. In particular, we have developed a new method based on IR camera measurements and inverse analysis leading to estimate the in-plane thermal conductivity.
In addition, computations of infrared heating have been performed thanks to numerical model previously developed based upon Comsol Multiphysics™ software [2,3]. The validity of the proposed methodology is then analysed by comparing numerical simulation results with experimental data.
Materials
Materials used in this study are polyamide 6.6 composites reinforced with glass or carbon fabrics and provided by Solvay Rhodia as 2mm thick sheets. The main characteristics of the composites are listed below (Table 1).
A B C
Matrix
Reinforcement Glass Glass Carbon Fabric weave Satin 8 Satin 8 Twill Weave Surface density (g.m-‐2) 296 545 285
Composite density (g.dm-‐3) 1884 1883 1534
Table 1. Properties of the polyamide 6.6 composites
Optical properties characterization
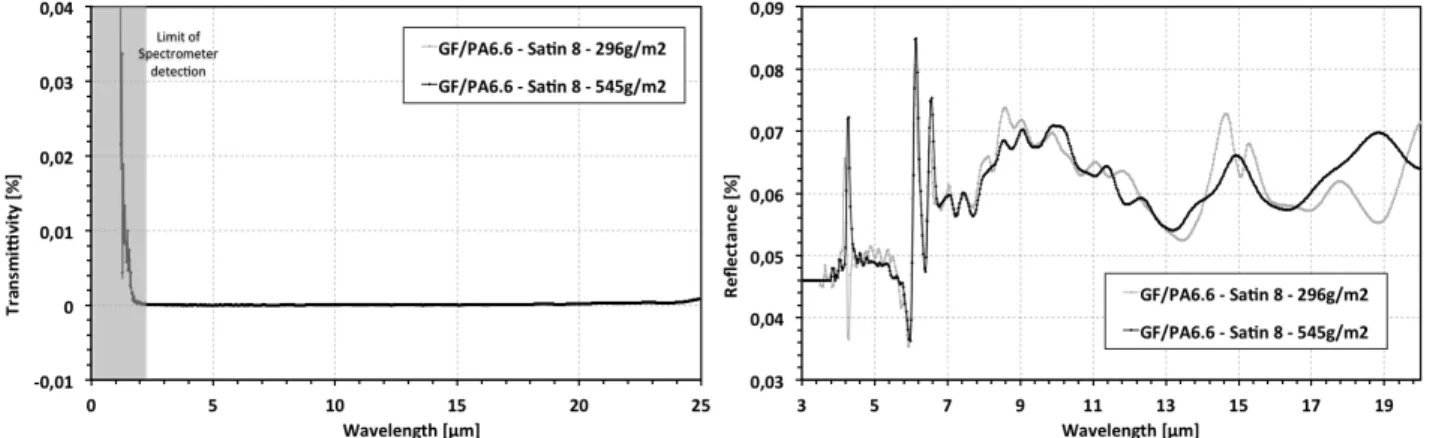
Optical properties measurements of the composites were performed thanks to an infrared spectrometer Bruker Vertex 70. It is to be noted that this spectrometer is equipped of two detectors allowing to cover all the IR spectral range (0.8 to 25µm). Figure 1 shows the reflectance and transmittivity spectra of the PA 6.6 composites reinforced with glass fibres. It is to be noted that both composites exhibit in both conditions a similar behaviour. Moreover, the transmittivity spectra show that the analysed composites are opaque with a very low transmittivity (near zero) in the studied wavelength range. Consequently, the carbon composite can be assumed opaque as well. On the other hand, the reflectance spectra also show that the composites exhibit a low spectral reflectivity (average value of 6%).
Figure 1 – Transmittivity and Reflectance spectra of GF/PA6.6 composites
Composite Emissivity A 0.92 B 0.90 C 0.88
Table 2 – Total emissivities of PA6.6 composites (ambient temperature)
Using previous results, we may consider PA composites as opaque material. Spectral emissivity of composites could then be deducted from the Kirshhoff’s law [4] considering Lambertian materials (Eq. 2). The resulting composites total emissivities in the spectral range [0.8µm; 25µm] were calculated using eq. 3 and are listed in Table 2.
λ λ = −ρ ε 1 (2) ε T
( )
= ελLoλ( )
T d λ 0.8 25∫
Loλ T( )
d λ 0.8 25∫
(3) Where Loλis the Plank’s law and the composite temperature T is 25°C.
Thermal properties characterization
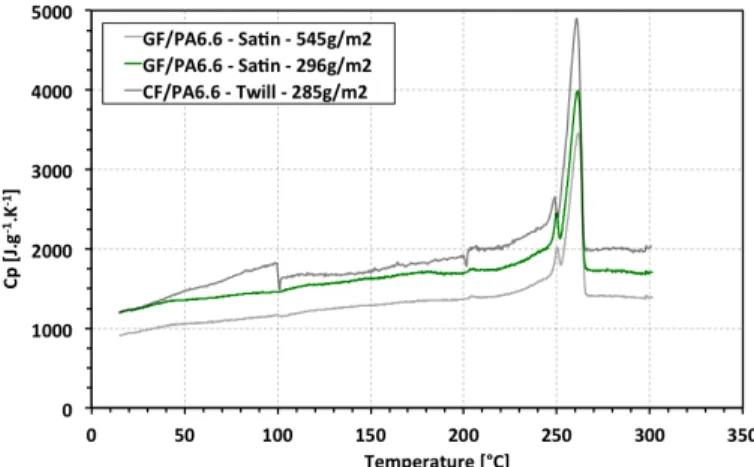
The heat capacity of the materials has been measured thanks to a differential scanning calorimeter (Perkin Elmer DSC 8000). DSC measurements were performed during 5°C.min-1 heating ramps on 5 to 8mg specimens from room temperature to 300°C. The heat capacity variations versus temperature for the different materials are plotted in Figure 2. Heat capacity increases with temperature, until reaching a peak at 261°C. This peak corresponds to the fusion of the polyamide matrix of composites.
Figure 2 – Heat capacities of the polyamide 6.6 composites
The thermal conductivity of the composites has been measured using two different experimental setups. First, a hot disc system was used to estimate the heat conductivity of the composites at 30°C. The measurements have been performed on composites reinforced with glass fibers at the LTN laboratory (Nantes, France) with in-lab experimental setup fully detailed in the literature [5]. This two-steps inverse analysis method allows measuring the heat conductivity tensor and heat capacity of the specimen. The first step consists in applying a thermal flux through the specimen thickness with a heating coil and to measure the thermal flux on the opposite surface of the disc with a flux sensor. During a second step, heating is only applied at the centre of the disc surface and the temperature distribution is measured on the disk surface with numerous thermocouples. Thermal properties are then fitted using an optimization procedure thanks to Comsol Multiphysics™ software.
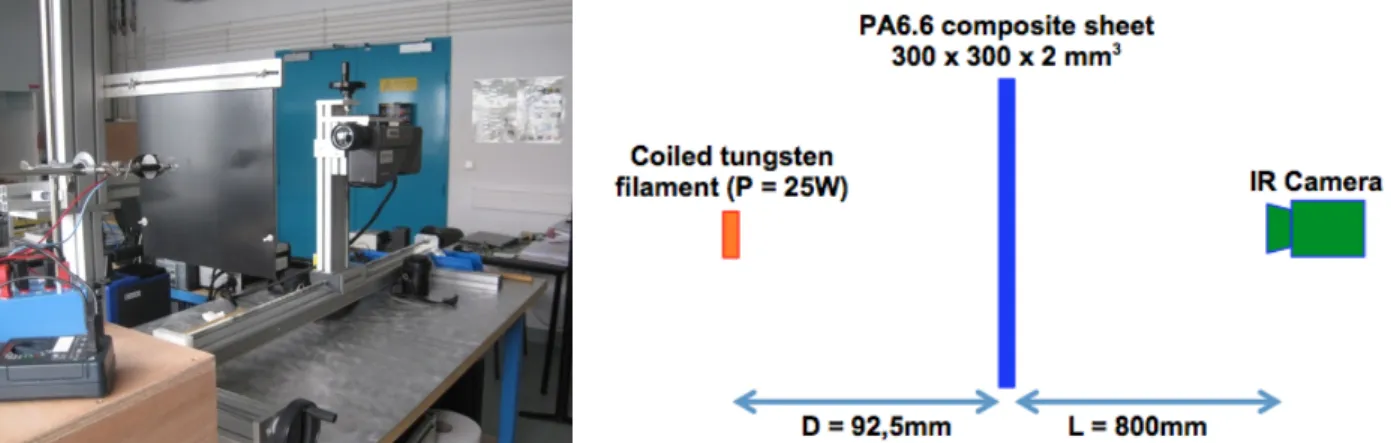
The second method used to measure the thermal conductivity of composites is again based upon inverse analysis method but temperature measurements are achieved using an infrared camera. As described in Figure 3, this techniques consists in applying a heat flux on the front surface of the composites using an incandescent light bulb of 25W (tungsten filament). Then, we measure the stationary temperature distribution on the back surface of the composite sheet using an AGEMA 880 LW IR camera [8-12 µm]. In this configuration, it was assumed that the temperature was constant throughout the materials volume, i.e. the composite sheet has been supposed as thermally thin which has been confirmed by calculating the Biot number (Bi < 0.05). Resulting surface temperatures are represented in figure 4.
Figure 3 – Experimental set-up used for thermal conductivity measurement using IR camera
A B C
Figure 4 – Back surface temperature distribution for the three different PA6.6 composites
In order to identify the thermal conductivity, a simplified model of this experimental set-up has been developed in Comsol Multiphysics™ software. The numerical model has been reduced to the 2mm thick composite sheet and the tungsten filament, which was modelled by a cylinder shape of 0.75mm diameter and 6mm long. The heat capacity measured by DSC has been implemented in the model and the filament has been considered as a lambertian homogeneous radiative source. The thermal conductivity has been thus calculated using inverse analysis by fitting the measured surface temperatures along the ellipse axes.
DSC Hot disk Thermography Cp Cp kx, ky kz kx, ky A 1249 1115 0.56 0.57 0.67 B 980 996 0.44 0.53 0.66
Table 2 – Thermal properties of PA6.6 composites at 30°C
The thermal properties measured using three different methods are reported in Table 2. Considering the thermal conductivity, the results show that the two methods lead to values of the same order of magnitude. However, the thermal conductivities measured with the hot disk method exhibit lower values than those from infrared camera method. Indeed, the hot dick technique has been applied to thick composite disks obtained by welding three sheets together. Therefore, the difference between the methods may be due to the thermal resistance generated at the interface of the 2mm thick welded sheets.
Infrared heating simulations
Figure 5 – Experimental IR heating oven and model schematisation
The heating stage of the composite stamping process has been reproduced by using an infrared in-lab oven (Figure 5). This experimental set-up is constituted of 9 infrared emitters provided by Toshiba Lighting Company, a horizontal hammered aluminium reflector that can be considered as a diffuse reflector and a supporting frame. The halogen lamps emit mainly in short IR wavelength (0.75 - 2µm) and have been set to nominal power of 1000W during the experiments. The set-up has been instrumented with a calibrated IR pyrometer (8 - 14µm) that measured the back surface temperature of the heated composite sheets.
In order to estimate the accuracy of this first modelling approach, a numerical model of the oven has been developed again with Comsol Multiphysics™ software. Variation of heat capacity versus temperature, thermal conductivity measured using infrared camera method and integrated materials emissivity have been implemented in the database. Again IR emitters have been modelled as long and thin cylinders (r = 1.075mm) neglecting the radiation of quartz tubes enclosing the tungsten filament. The variation of tungsten filament emissivity versus temperature has been taken into account [6] and correlated to the supply voltage. A global heat transfer coefficient integrating self-radiation of the composite as well as free convection was used for thermal simulations. Details concerning free convection can be founded in reference [3]. In addition, the supporting frame has been neglected. Indeed, the analysis of the experimental configuration performed by Nakouzi et al. [2,3] has shown that this frame has low effect on the heating stage whether we consider the radiation or conduction interactions.
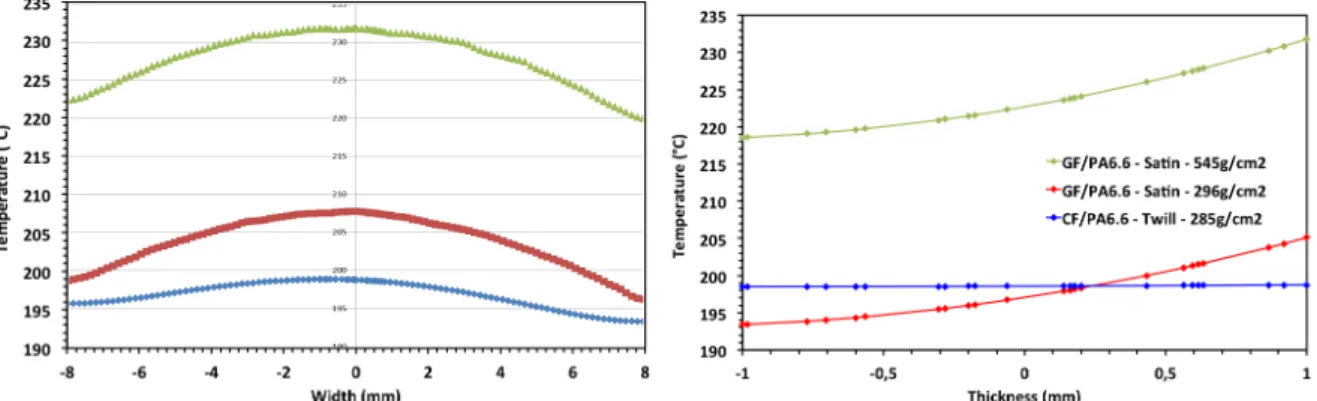
Figure 6 – Simulated surface and through-the-thickness temperature profiles for the three different PA6.6 composites after 120min of IR heating
The temperature profiles throughout the composites after 120 min heating are plotted in Figure 6. Due to constant power setting of halogen lamps the surface temperature profiles (Figure 6, left) exhibit large temperature gradients with a maximum temperature at the centre of composite sheets. This gradients are of about 10°C for the glass fibre composites while it is only 5°C for the carbon reinforced composite. These results highlight the higher thermal conductivity of carbon composite. This different conductive behaviour is also clearly discernible on the through-the-thickness
temperature profiles: the temperature of carbon composites is almost homogeneous in the thickness direction, while glass fibre composites exhibit large temperature gradients of about 10°C through specimen thickness due to the lower thermal conductivity of glass fibres.
Figure 7 – Comparison of the experimental and simulated temperature evolution obtained for the carbon composite
Figure 7 shows a comparison of computed temperature versus time with experimental data and the root mean square error versus time. The displayed results correspond to the backside temperature of the carbon-reinforced composite as measured using the pyrometer (cf. Figure 5, right).
The comparison emphasises that the numerical simulation is in good agreement with the measured temperature during the entire heating stage. The difference between the experimental data and simulations is lower than 20°C and the root mean square error remains lower than 10% until 200°C witch fits with the beginning of polyamide fusion. The use of heat capacity instead of latent heat of fusion to model polyamide fusion is probably the source of this difference.
Conclusions and future works
The homogeneous numerical model of composite forming turns out to be an accurate method to predict the temperature field induced by infrared heating. However, experimental characterisations of composites are required in order to measure precisely the heat capacity, thermal conductivities and emissivity. Nevertheless, this preliminary study has shown that even 2mm thick glass-reinforced composites are opaque and that the total emissivity can be deducted directly from the reflectance spectra.
On the other hand, this study also proposed a new inverse method based on infrared camera in order to measure the thermal conductivity tensor of composites. The resulting data emphasises that this technique lead to conductivities similar to hot disk ones. This positive conclusion encourages the optimisation of this technique in particular by performing a sensitivity analysis. In addition, we plan to develop an optimisation method together with the infrared heating solver in order to compute the best power of each emitter to achieve a homogeneous surface temperature.
References
[1] B.-C. Chern, T.J. Moon, J.R. Howell, On-line Processing of Unidirectional Fiber Composites
Using Radiative Heating, J. of Composite, Materials, 2002
[2] S. Nakouzi, F. Berthet, D. Delaunay, Y. Le Maoult, F. Schmidt,V. Sobotka, Optimization of the
incident IR heat flux upon a 3D geometry composite part (Carbon/Epoxy), Key Engineering
Materials Vols. 504-506 (2012), 1085-1090.
[3] S. Nakouzi , J. Pancrace, F.M. Schmidt, Y. Le Maoult, F. Berthet, Simulations of an Infrared
Composite Curing Process, Advanced Engineering Materials, 2011, vol. 13, issue 7, pp. 604-608.
[4] R. Siegel, J.R. Howell, Thermal Radiation Heat Transfer, Washington DC: Hemisphere Publishing, 1992.
[5] M. Thomas, N. Boyard, N. Lefèvre, Y. Jarny, D. Delaunay , An experimental device for the
simultaneous estimation of the thermal conductivity 3-D tensor and the specific heat of orthotropic composite materials, Int. Journal of Heat and Mass Transfer, Vol. 53, Issues 23–24, 2010, Pages
5487–5498.
[6] S. Monteix, F.M. Schmidt, Y. Le Maoult, G. Denis and M. Vigny, Recent Issues In Preform
Radiative Heating Modeling, Proceeding of the 17th International Conference of Polymer