HAL Id: hal-01316234
https://hal.archives-ouvertes.fr/hal-01316234
Submitted on 17 May 2016HAL is a multi-disciplinary open access archive for the deposit and dissemination of sci-entific research documents, whether they are pub-lished or not. The documents may come from teaching and research institutions in France or abroad, or from public or private research centers.
L’archive ouverte pluridisciplinaire HAL, est destinée au dépôt et à la diffusion de documents scientifiques de niveau recherche, publiés ou non, émanant des établissements d’enseignement et de recherche français ou étrangers, des laboratoires publics ou privés.
accelerated test using Bayesian network
Thanh-Binh Tran, Emilio Bastidas-Arteaga, Stéphanie Bonnet, Franck Schoefs
To cite this version:
Thanh-Binh Tran, Emilio Bastidas-Arteaga, Stéphanie Bonnet, Franck Schoefs. Parameter identifi-cation in chloride ingress from accelerated test using Bayesian network. ICASP12 – 12th Interna-tional Conference on Applications of Statistics and Probability in Civil Engineering, 2015, Vancouver, Canada. �10.14288/1.0076264�. �hal-01316234�
Parameter identification in chloride ingress from accelerated test
using Bayesian network
Thanh-Binh Tran
PhD Student, University of Nantes, Nantes, France
Emilio Bastidas-Arteaga
Associate Professor, University of Nantes, Nantes, France
Stéphanie Bonnet
Associate Professor, University of Nantes, Nantes, France
Franck Schoefs
Professor, University of Nantes, Nantes, France
ABSTRACT: Chloride ingress into concrete is one of the main causes leading to the degradation of reinforced concrete (RC) structures. Important damages due to chloride-attack are reported after 10-20 years and thus, structures should be inspected periodically to ensure optimal levels of serviceability and safety. Modelling chloride ingress into concrete, therefore, becomes an important task to plan and quantify maintenance operations of structures. Relevant material and environmental parameters required for modelling could be determined from inspection data obtained after each inspection campaign. However, its assessment requires significant experimental time for collecting data that allow considering the time-dependency of the deterioration process. Data from accelerated test could be used as information about long-term performance of concrete or mortar under real exposure conditions if the scale factor reflecting the ratio between exposures times for natural and accelerated tests is determined. The main objective of this paper is to develop a method based on Bayesian updating to identify the ‘real’ (equivalent) exposure time from accelerated tests that is used to define the scale factor. The proposed methodology is first tested on simulated data and after implemented to real measurements.
1. INTRODUCTION
Chloride penetration into concrete is one of the main factors responsible for generating corrosion in reinforcing bar which in turn cause: reduction of reinforcement cross-section, loss of bond between steel and concrete, and concrete cracking and delamination (Bastidas-Arteaga and Schoefs 2012; Bastidas-Arteaga et al. 2011; Lounis and Amleh 2003). These consequences lead to the reduction of serviceability and safety levels as well as the shortening of the service life of reinforced concrete (RC) structures. Most RC structures are designed for a lifetime of 50-100 years. However, under chloride attack, important
Mehta 2004; Poupard et al. 2006). Consequently, RC structures should be inspected periodically to ensure optimal levels of serviceability and safety during their structural life. Data collected after inspection campaigns is often used to determine parameters for chloride ingress or corrosion propagation models under specific environmental exposures. These parameters are very useful for lifetime assessment and optimisation of maintenance strategies (Bastidas-Arteaga and Schoefs 2012). However, under real exposure conditions, even for environments with larger chloride content (splash and tidal zones), the rate of chloride ingress into concrete is particularly slow. Consequently, a significant exposure time
characterise the mid- and long-term durability behaviour of concrete and mortar. Non destructive chloride ingress measurements could be very useful to characterise the performance of cement-based materials subject to real conditions (Torres-Luque et al. 2014). However, many of these techniques are still under development.
This study is based on data obtained from an experimental test in which chloride ingress is accelerated by drying the concrete surface after immersion cycles. Data from these tests could provide information about the mid- and long-term performance of concrete or mortar under real exposure conditions and it could be also used for testing new building or repair materials. The main challenge of this approach is to determine a scale factor reflecting the ratio between exposures times for natural and accelerated tests.
Bayesian network (BN) is an effective tool for parameter identification. Some studies (Bastidas-Arteaga et al. 2012; Richard et al. 2012; Tran et al. 2014) proposed methodologies based on BN to identify model/material parameters from real experiment data that shown a good agreement between numerical predictions and experimental measurements. In this study, BN is also used as a tool for parameter identification based on a chloride ingress model. Based on the approach proposed by Tran et al., (2014), data from natural test will be used to identify information about two model parameters: chloride surface concentration (Cs) and the chloride diffusion coefficient (D). This information will be after used as priori information in other BN to identify the equivalent exposure time from data obtained in the accelerated test. A scale factor representing the ratio between experimental time and equivalent time in accelerated test is then proposed.
2. PARAMETER IDENTIFICATION IN CHLORIDE INGRESS USING BN
2.1. Parameter identification using BN
Using BN for identifying parameters in chloride ingress has been investigated in some previous studies (Bastidas-Arteaga et al. 2012; Deby et al. 2008, 2012; Tran et al. 2014). In general, each parameter in the model is represented as a node in the BN. There is an arrow linking from a “parent node” to a “child node” to define the dependency between the two nodes. The Conditional Probability Table (CPT) in BN describes the relationship between each pair of nodes. The CPT for each node could be built from numerical simulations or by real statistic data. The BN allows updating the statistical distributions of parameters in the network with new information from experimental results. In BN modelling of chloride ingress, parameters to identify are modelled as parent nodes and chloride content at different depth points and inspection times are modelled as child nodes. Inspection data is introduced in BN as evidences.
Tran et al. (2014) optimised the use of inspection data to improve the BN configuration for parameter identification in chloride ingress models. They pointed out that there is a specific configuration of BN for each parameter that minimise the identification errors. For the surface chloride concentration (Cs), a BN with only one child node representing the chloride content at the surface at early inspection time provides a good identification. For the chloride diffusion coefficient (D), to minimize errors, the optimised BN configuration should consider child nodes representing the total inspection depth with optimal spatial discretisation intervals. Tran et al. (2014) also suggested that different boundaries should be used to define the ranges for child nodes to take advantage of information from deeper points where chloride content is low. These optimised configurations and numerical aspects are applied in this study to minimise the errors in parameter identification.
2.2. Modelling chloride ingress
In this study, chloride ingress is modelled as (Luping and Gulikers 2007):
C x,t
( )
= Cserfc x 2 D0 1− n 1+ tex' t ⎛ ⎝⎜ ⎞ ⎠⎟ 1−n − tex ' t ⎛ ⎝⎜ ⎞ ⎠⎟ 1−n ⎡ ⎣ ⎢ ⎢ ⎤ ⎦ ⎥ ⎥ t0' t ⎛ ⎝⎜ ⎞ ⎠⎟ n t ⎡ ⎣ ⎢ ⎢ ⎢ ⎢ ⎢ ⎢ ⎢ ⎤ ⎦ ⎥ ⎥ ⎥ ⎥ ⎥ ⎥ ⎥ (1)where C(x,t) is the concentration of chloride ions at depth x and time t, Cs is the chloride concentration at the exposure surface, D0 and t’0 is a pair of known diffusion coefficient and age,
t’
ex is the age of concrete at the start of exposure,
n is the age factor, and erfc(.) is the
complementary error function.
This equation is valid only under these assumptions: 1) concrete is a homogeneous material; 2) chloride binding is time-independent and linearly proportional to the free chloride concentration; 4) the effect of co-existing ions is constant; 5) the diffusion is one dimensional into semi-infinite space. However, this model is considered in this study because it accounts, in a simplified way, for the time-dependency of the chloride ingress process.
3. PARAMETER IDENTIFICATION WITH DATA FROM ACCELERATED TEST
3.1. Description of the experimental setup
The experimental setup of the accelerated tests was carried out within the framework of the French MAREO project. It aimed at characterising the durability performance of new materials to repair RC components located in tidal zones by performing both natural and accelerated tests. For natural and accelerated tests, concrete slabs are placed in a tank with salted water. The exposure of the slabs ensures chloride ingress in one dimension. Tidal cycles (high and low) are simulated varying the level of water. For the accelerated tests, ventilators are used to dry the samples during the low tide cycle. The drying accelerates chloride ingress due to an
(Hong 1998). Natural tests are subjected to the same tidal cycles without drying. The test is automatically controlled via a Labview® program. The thanks are placed inside a building and its environmental conditions (room temperature, water salinity and relative humidity) are recorded.
For natural tests, the exposure time in laboratory, texp, could represent the exposure time in real conditions. However, for accelerated tests the chloride contents are larger, and consequently, the exposure time in lab texp must correspond to an equivalent time, teq, under natural exposure conditions (teq > texp).
3.2. Bayesian identification of teq
Chloride profiles obtained from natural tests could provide information about chloride content at depth x at real exposure times texp. However, those of accelerated test just can provide information about chloride content at depth x. Consequently, different BN configurations are used for natural and accelerated tests. Tran et al. (2014) modelled chloride ingress into concrete in natural tests by the BN shown in Figure 1 where
Cs and D0 are two parent nodes and there are n child nodes C(xi,tj) representing the discrete chloride concentration measurement in time and space i.e. at depth xi and inspection time tj. In accelerated tests, chloride ingress is modelled by the BN described in Figure 2 that has three parent nodes Cs, D0 and teq. Child nodes in Figure 2 represent the chloride content at depth
xi.
Figure 1: BN configuration for natural test
Cs D C(x , t )1 1 C(x , t )2 1 C(x , t )i 1 C(x , t )n 1 C(x , t )1 j C(x , t )2 j C(x , t )i j C(x , t )n j C(x , t )1 m C(x , t )2 m C(x , t )i m C(x , t )n m . . . . . . . . . . . . . . . . . . 0
Figure 2: BN configuration for accelerated test
If there is no priori information about the parameters Cs, D, and teq, we can assume that they follow uniform distributions in given ranges (Bastidas-Arteaga et al. 2012; Cao and Wang 2014; Robinson and Hartemink 2010). However, data from natural tests could be used herein to provide some priori information that reduces the level of uncertainty in the BN by improving the identification process.
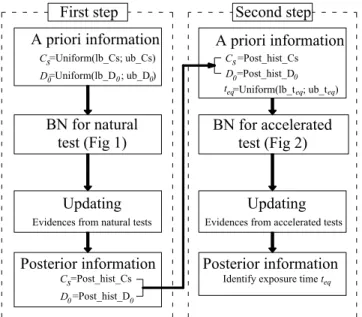
Figure 3: Flowchart of the proposed approach
The proposed approach for identifying teq is described in Figure 3. The first step of the methodology consists of using the BN and data from natural tests (Figure 1) to identify the parameters Cs and D0. Cs and D0 are respectively related to chloride exposure and concrete diffusivity. Natural and accelerated tests are performed on the same material subject to the same environmental chloride concentration. Then, we assume that these parameters should remain unchanging for natural and accelerated
test. The first step of the methodology aims then at characterising these two parameters under natural exposure conditions. Posterior histograms of the parameters Cs and D0 are then used in the second step as a priori information for the BN (Figure 2). The equivalent exposure time for accelerated test could be then identified by updating the BN with evidences obtained from accelerated test results.
4. APPLICATION TO NUMERICAL DATA In practice it is difficult to obtain enough experimental data to validate the proposed procedure and to improve the configuration of the BN that minimises identification errors. Consequently, this section considers numerical data to improve the configurations of BN corresponding to different inspection schemes. Each configuration is evaluated by the error of the identified parameter Zidentified with respect to a theoretical value Ztheory as:
Error(Z)= Zidentified− Ztheory
Ztheory 100% (2)
where Z represents the mean or the standard deviation of the parameter to identify and the theoretical values Ztheory are used to generate chloride profiles from eq. (1).
4.1. BN modelling for natural tests
Continuous variables are replaced by discrete variables to avoid using approximate BN algorithms. The priori information and the discretisation of the parameters are described in Table 1. We assume that t’ex = t’0 = 30 days and n = 0.5.
Table 1: A priori information and discretisation of parameters in BN modelling for natural test
Parameter A priori information Intervals per node Cs [kg/m3] Uniform (10-3 – 12) 60 D0 [10-12m/s2] Uniform (0.4 – 3.5) 60 C(x,t) [kg/m3] - 30 Cs C(x )1 Do t . . . C(x )2 C(x )3 C(x )i C(x )n . . . eq BN for natural test (Fig 1) A priori information Cs=Uniform(lb_Cs; ub_Cs) D =Uniform(lb_D ; ub_D ) Posterior information Cs=Post_hist_Cs D =Post_hist_D
Evidences from natural tests
Updating
A priori information
Cs D
Posterior information
Evidences from accelerated tests
Updating
t =Uniform(lb_t ; ub_t )
=Post_hist_Cs =Post_hist_D
Identify exposure time t
BN for accelerated test (Fig 2) eq 0 0 0 0 0 0 eq 0 eq eq
Numerical evidences are generated using Monte Carlo simulations with the parameters given in Table 2. Data from different inspection schemes are combined to update the BN (Table 3). These schemes consider various inspection times with the same number of chloride profiles per scheme. The maximum number of days (900 days) corresponds to the time of exposure of natural tests.
With inspection time smaller than 900 days, chloride content at depth x > 20mm is almost null. Consequently, the total inspection depth is fixed at 22mm. Various configurations of BN corresponding to different number of inspection points dividing the inspection depth into equal interval lengths are analysed to evaluate the identification errors. The interval lengths should not be smaller than 3mm due to the accuracy of the semi-destructive tests for determining chloride profiles.
Table 2: Theoretical values of parameters to identify
Parameter Distribution Mean COV
Cs Lognormal 2.95 (kg/m3) 20%
D0 Lognormal 10-12 (m/s2) 15%
Table 3: Inspection schemes
Inspection scheme Number of chloride profiles
300 days 9000
600 days 9000
900 days 9000
300+600 days 4500 + 4500
300+600+900 days 3000+3000+3000
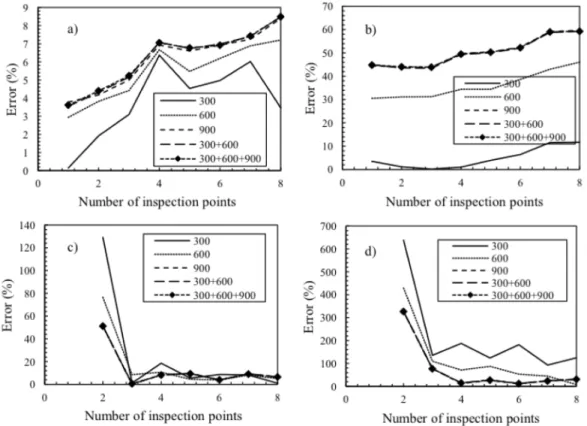
The identification errors for Cs presented in Figure 4a and Figure 4b show that evidences obtained near the surface (x≈0) with early inspection time (tins = 300 days) could minimize the errors in the estimation of mean and standard deviation of Cs (Tran et al. 2014). However, for
D0, combining evidences from different inspection times could improve the identification. This trend can be observed clearly in Figure 4d where the errors of standard
Figure 4: Identification errors: (a) Mean of Cs,(b) Standard deviation of Cs, (c) Mean of D0, (d) Standard
inspection times (300+600) days or (300+600+900) days are reduced significantly. This is because the deterioration model herein takes into consideration the time-dependency of the chloride diffusion coefficient. This finding could very useful when inspection data is limited because by combining these data, we can take advantage of the information. Figure 4c and Figure 4d also reveal that using more inspection points could reduce the gap between identified and theoretical values for D0.
4.2. BN modelling of accelerated test
Both natural and accelerated tests are carried out in the same concrete. Consequently, chloride concentration at surface (Cs) and chloride diffusion coefficient (D0), which are determined from natural tests, could be applied for accelerated test (Figure 3). To avoid any assumption about distribution shapes, posterior histograms of Cs and D0 obtained after updating the BN of natural tests are then used directly as priori distribution in BN modelling of accelerated tests. To minimize the identification errors in natural tests, the histogram of Cs and D were obtained from improved BN configurations as previously discussed in section 4.1. According to Figure 2, the equivalent exposure time (teq) is the variable to identify. It is then modelled as a parent node with the priori distribution shown in Table 4.
Table 4: A priori information and discretisation of parameter in BN modelling for natural test
Parameter Priori information Intervals
Cs [kg/m3] Histogram from natural test (10-3 - 12) 60
D0 [m/s2] Histogram from natural test (4.10-13 - 3.5.10-12) 60
teq [days] (0-3600) Uniform 100
C(x) [kg/m3] - 30
Numerical evidences in the BN for accelerated tests are generated from the theoretical values presented in Table 2 at different inspection times varying from 300 to
3000 days. 9000 chloride profiles are generated for each inspection time. These inspection times correspond to the theoretical teq to be identified. The total inspection depth is 30mm, being sufficient to describe the penetration of chloride at 3000 days of exposure.
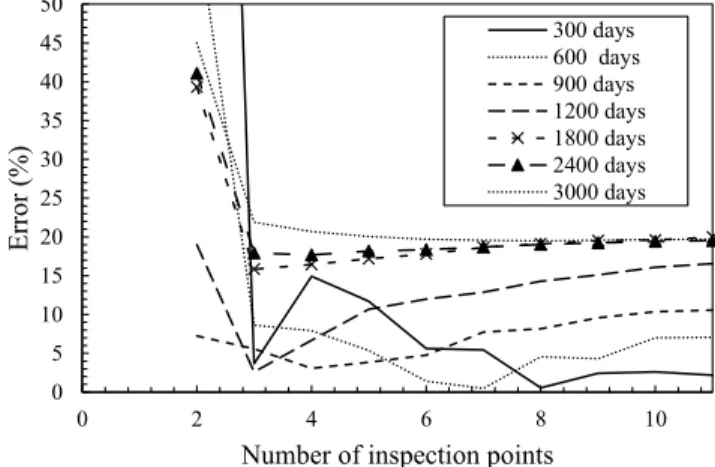
The errors on the identification of the equivalent exposure time from accelerated tests are shown in Figure 5. With a large number of inspection points, the errors for all cases are smaller than 20%. Especially, errors at 300 days, 600 days, and 900 days are smaller than other cases. It is because priori information of Cs and
D0 was obtained from natural tests at these exposure times and then it reduces the identification errors. When dealing with real data, the identified value of equivalent exposure time could be used to calculate a scale factor.
Figure 5: Identification error for the mean teq
5. APPLICATION TO REAL DATA
5.1. Experimental data
Destructive tests were carried out to determine chloride profiles from both natural and accelerated tests at different exposure times (Table 5 and Table 6). Each chloride profile has 42mm in depth and with a discretisation depth of 3mm. This gives a total of 14 inspection points.
Table 5: Number of chloride profiles for natural tests
Natural tests T1 T2 T3 texp (days) 65 207 320 Number of profiles 3 3 3 0 5 10 15 20 25 30 35 40 45 50 0 2 4 6 8 10 Er ror (% )
Number of inspection points
300 days 600 days 900 days 1200 days 1800 days 2400 days 3000 days
Table 6: Number of chloride profiles for accelerated tests
Accelerated tests T1 T2 T3
texp (days) 65 212 436
Number of profiles 6 6 6
5.2. Identification of the scale factor k
A scale factor in accelerated tests can be defined as a ratio between the exposure time in the experiment (texp) and the equivalent exposure time (teq):
k= teq
texp (3)
The experimental exposure times in accelerated tests (texp) are given in Table 6. The equivalent exposure times (teq) are determined by the procedure given in Figure 3. Improved BN configurations defined according to the findings of section 4.1 are used to take advantage of limited data and minimise the identification errors in natural tests. Therefore, data at the surface (x≈0) from chloride profiles obtained at inspection time T1 are introduced in BN updating to obtain posteriori histogram of Cs. Data combining three inspection times (T1 + T2 + T3) with 14 inspection points in depth are used to obtain posterior histogram of D0. These posterior histograms are then used as priori information in BN modeling of accelerated test. Equivalent exposure times are determined by updating the BN with evidences from accelerated tests and scale factors are then computed from Eq. (3).
The results for equivalent exposure times and scale factors are given in Table 7. Identified values of teq show an expected trend that a longer exposure time (texp) in the laboratory will be equivalent to a larger value of teq. By plotting the scale factors with the experimental times (Figure 6), it is noted that the scale factor is not constant. At early inspection time, this factor is high and then it decrease with time. This trend is expected due to the fact that the chloride diffusion coefficient is time-dependent and follow a
values of scale factors could be more accurate if more experimental data is available.
Table 7: Real exposure and equivalent times
Accelerated test T1 T2 T3
texp [days] 65 212 436
teq [days] 725.2 935.9 1050.3
Figure 6: Scale factor for accelerated tests
6. CONCLUSIONS
Chlorides ions are critical agents leading to reinforcement corrosion of RC structures. The characterisation of the performance of cement-based materials under real conditions requires significant experimental times. Consequently, this study proposed a methodology for characterising these materials by using accelerated tests and BN updating. The proposed approach allows determining a scale factor for the accelerated test. Therefore, information about long-term performance of concrete or mortar under real exposure condition could be obtained from accelerated experiments in lab. This information is useful to characterise the performance of new repair techniques or cement-based repair materials.
This paper presented our first findings on this area. Future works will focus on:
• obtaining more experimental data to improve the identification,
• identification of the age factor in the chloride ingress model eq. (1), and • consideration of measurement and model
0 2 4 6 8 10 12 0 100 200 300 400 500 S ca le fa ctor
7. REFERENCES
Bastidas-Arteaga, E., Chateauneuf, A., Sánchez-Silva, M., Bressolette, P., and Schoefs, F. (2011). “A comprehensive probabilistic model of chloride ingress in unsaturated concrete.”
Engineering Structures, 33(3), 720–730.
Bastidas-Arteaga, E., and Schoefs, F. (2012). “Stochastic improvement of inspection and maintenance of corroding reinforced concrete structures placed in unsaturated environments.”
Engineering Structures, 41, 50–62.
Bastidas-Arteaga, E., Schoefs, F., and Bonnet, S. (2012). “Bayesian identification of uncertainties in chloride ingress modeling into reinforced concrete structures.” Third International Symposium on Life-Cycle Civil Engineering, Vienna, Austria.
Cao, Z., and Wang, Y. (2014). “Bayesian model comparison and selection of spatial correlation functions for soil parameters.” Structural
Safety, Elsevier Ltd.
Deby, F., Carcasses, M., and Sellier, A. (2008). “Toward a probabilistic design of reinforced concrete durability: application to a marine environment.” Materials and Structures, 42(10), 1379–1391.
Deby, F., Carcasses, M., and Sellier, A. (2012). “Simplified models for the engineering of concrete formulations in a marine environment through a probabilistic method.” European
Journal of Environmental and Civil
Engineering, 16(3-4), 37–41.
Hong, K. (1998). “Cyclic wetting and drying and its effects on chloride ingress in concrete.” MSc Thesis, University of Toronto.
Kumar Mehta, P. (2004). “High-performance, high-volume fly ash concrete for sustainable development.” International Workshop on
Sustainable Development and Concrete Technology, Beijing, 3–14.
Lounis, D. Z., and Amleh, L. (2003). “Reliability-Based Prediction of Chloride Ingress and Reinforcement Corrosion of Aging Concrete Bridge Decks.” Proceeding of the 3rd
International IABMAS Workshop on Life-Cycle
Cost Analysis and Design of Civil
Infrastructure Systems, Lausanne, Switzerland,
139–147.
Luping, T., and Gulikers, J. (2007). “On the mathematics of time-dependent apparent
chloride diffusion coefficient in concrete.”
Cement and Concrete Research, 37, 589–595.
Poupard, O., L’Hostis, V., Catinaud, S., and Petre-Lazar, I. (2006). “Corrosion damage diagnosis of a reinforced concrete beam after 40 years natural exposure in marine environment.”
Cement and Concrete Research, 36, 504–520.
Richard, B., Adelaide, L., and Cremona, C. (2012). “A Bayesian approach to estimate material properties from global statistical data.”
European Journal of Environmental and Civil Engineering, (March 2013), 37–41.
Robinson, J. W., and Hartemink, A. J. (2010). “Learning Non-Stationary Dynamic Bayesian Networks.” The Journal of Machine Learning
Research, 11, 3647–3680.
Tang, L., and Nilsson, L. (1996). “A numerical method for prediction of chloride penetration into concrete structures.” NATO/RILEM
Workshop on the modelling of Microstructure and its Potential for Studying Transport Properties and Durability, Kluwer, Dordrecht,
The Netherlands, 539–552.
Torres-Luque, M., Bastidas-Arteaga, E., Schoefs, F., Sánchez-Silva, M., and Osma, J. F. (2014). “Non-destructive methods for measuring chloride ingress into concrete: State-of-the-art and future challenges.” Construction and
Building Materials, 68, 68–81.
Tran, T. B., Bastidas-Arteaga, E., Schoefs, F., and Bonnet, S. (2014). “Bayesian updating for optimization of inspection schedules of chloride ingress into concrete.” Proceeding of
the 2nd International Symposium on
Uncertainty Quantification and Stochastic Modeling, Rouen, France.