Published online 20 September 2016 in Wiley Online Library (wileyonlinelibrary.com) DOI: 10.1002/joc.4879
Decrease in climatic conditions favouring floods in the
south-east of Belgium over 1959 – 2010 using the regional
climate model MAR
Coraline Wyard,
a* Chloé Scholzen,
aXavier Fettweis,
aJean Van Campenhout
band Louis François
caLaboratory of Climatology and Topoclimatology, University of Liège, Belgium bLaboratoire d’Hydrographie et de Géomorphologie Fluviatile, University of Liège, Belgium cUnité de Modélisation du Climat et des Cycles Biogéochimiques, University of Liège, Belgium
ABSTRACT:The Ourthe River, in the south-east of Belgium, has a catchment area of 3500 km2 and is one of the main tributaries of the Meuse River. In the Ourthe, most of the flood events (FE) occur during winter and about 50% of them are due to heavy rainfall events combined with an abrupt melting of the snowpack covering the Ardennes massif during winter. This study aims to determine whether trends in extreme hydroclimatic events generating floods can be detected over the last century in Belgium, where a global warming signal can be observed. Hydroclimatic conditions favourable to floods were reconstructed over 1959–2010 using the regional climate model MAR (‘Modèle Atmosphérique Régional’) forced by the ERA-Interim/ERA-40, the ERA-20C and the NCEP/NCAR-v1 reanalyses. Extreme run-off events, which could potentially generate floods, were detected using run-off caused by precipitation events and snowpack melting from the MAR model. In the validation process, the MAR-driven temperature, precipitation and snow depth were successfully compared to daily weather data over the period 2008–2014 for 20 stations in Belgium. MAR also showed its ability to detect up to 90% of the hydroclimatic conditions which effectively generated observed floods in the Ourthe River over the period 1974–2010. Conditions favourable to floods in the Ourthe River catchment present a negative trend over the period 1959–2010 as a result of a decrease in snow accumulation and a shortening of the snow season. This trend is expected to accelerate in a warmer climate. However, regarding the impact of the extreme precipitation events evolution on conditions favouring floods, the signal is less clear because the trends depend on the reanalysis used to force the MAR model.
KEY WORDS regional climate models; Europe; Belgium; Ourthe River; floods; snow; precipitation
Received 14 May 2016; Revised 28 July 2016; Accepted 2 August 2016
1. Introduction
Changes in seasonal snow cover cause concern in many mid- to high-latitudes countries because of its implications in water supply and flood risks (e.g. Barnett et al., 2005; Beniston, 2012a). Over the last decades, a significant general trend toward decreasing snow depth, snow dura-tion and snowfall amount with interdecal variability has been identified in various European regions such as the Alps (e.g. Durand et al., 2009; Valt and Cianfarra, 2010; Beniston, 2012b), Britain (e.g. Kay, 2016), Norway (e.g. Skaugen et al., 2012; Dyrrdal et al., 2013), or Eastern Europe (e.g. Falarz, 2004; Brown and Petkova, 2007; Birsan and Dumitrescu, 2014). This declining snow cover is responsible for a decrease in the intensity and in the frequency of the floods dominated by snowmelt which is predicted to accelerate in the future (e.g. Bell et al., 2016; Vormoor et al., 2016).
* Correspondence to: C. Wyard, Laboratory of Climatology and Topocli-matology, University of Liège, Quartier Village 4, Clos Mercator 3, 4000 Liège, Belgium. E-mail: [email protected]
In Belgium, a low-lying country of western Europe [maximum elevation = 694 m above sea level (a.s.l.)], snow can cover the summits of the Ardennes massif from 1 to 2 months per year on average, and can reach 80 cm with consequences on water management, biodiversity and tourism activities. When combined with heavy rainfall events, the rapid melting of this snow cover is responsible for major floods in the Meuse River catchment, located in the south-east of Belgium. However, despite the afore-mentioned implications, very few studies about the recent evolution of seasonal snow cover have been carried out in Belgium. Moreover, these studies, which do not cover the last two decades (1990–2015), have been conducted either over much shorter periods (Sneyers, 1967a, 1967b; Erpicum et al., 1991) or on a more limited number of weather stations (Sneyers, 1965) to build robust statistics. Therefore, this research aims to assess whether seasonal snow cover and climatic conditions favouring floods have changed over the last 50 years in Belgium. For this pur-pose, the regional climate model (RCM) MAR (for ‘Mod-èle Atmosphérique Régional’ in French) was used over the period 1959–2010, forced by three reanalyses. As snow
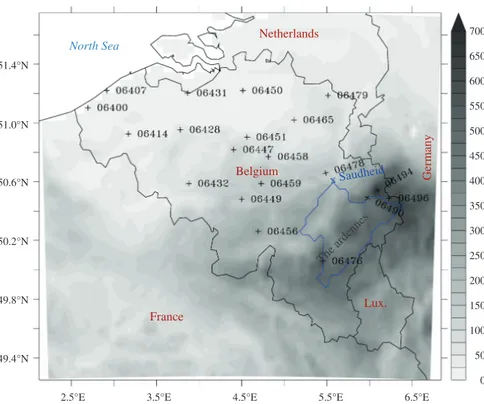
51.4°N North Sea Netherlands Belgium France Lux. The ardenne s Saudheid Ger m an y 700 650 600 550 500 450 400 350 300 250 200 150 100 50 0 51.0°N 50.6°N 50.2°N 49.8°N 49.4°N
2.5°E 3.5°E 4.5°E 5.5°E 6.5°E
Figure 1. Orography of the study area, location of the weather stations used in this study with their WMO identifier, limits of the Ourthe River catchment area upstream of the gauging station of Sauheid. [Colour figure can be viewed at wileyonlinelibrary.com].
cover records over the Belgian territory are patchy, discon-tinuous or made with techniques that change over time, a RCM like MAR, which was specially designed to model snow (Gallée et al., 2001; Fettweis et al., 2013), is a highly valuable tool for studying the recent changes in snow cover at a high-spatial resolution. The other RCM running over Belgium, such as the ALADIN and AROME combined model (ALARO-0 model), are used to model extreme events in summer such as Urban Heat Island (Hamdi et al., 2014) and precipitation (De Troch et al., 2013) while we are focussing here on the winter season and snow.
After a brief description of the study area, the RCM used and the validation data are described in Section 2. Section 3 first presents and discusses the results of the eval-uation of the MAR model over the Belgian territory by comparing the model outputs with daily observations from 20 weather stations of the surface synoptic observations (SYNOP) network over the period 2008–2014. Secondly, Section 3 details the statistical analysis performed to study the evolution of (i) the seasonal snow cover simulated by MAR over the period 1959–2010 and, (ii) the conditions favourable to floods in the catchment area (3500 km2) of
the Ourthe River in the Ardennes region/massif. Conclu-sions and prospects are finally reported in Section 4.
2. Data and methods
2.1. Study area
This study focuses on the Belgian territory (see Figure 1), and more specifically on its south-eastern part where the presence of the Ardennes massif implies a hilly relief. The
summits of the Ardennes consist in high plateaus covered with spruce forests and heathland. The highest summit is the Hautes Fagnes plateau whose altitude reaches 694 m a.s.l. Among the several rivers which drain the Ardennes massif, the largest one is the Ourthe River, with a catch-ment area of about 3500 km2 (Pauquet and Petit, 1993).
This river is also the main tributary of the Meuse River, which is one of the largest rivers of Western Europe, with a catchment area of about 36 000 km2 and a length of
950 km. While the Ourthe River is mainly rain-fed, the snowpack that covers the Ardennes summits during winter also influences its discharge because of its buffering effect (Driessen et al., 2010). The Ourthe reaches its highest level either in winter or in spring when the snowpack is melting. About half of the observed floods are due to abundant rainfall alone. However, the rapid melting of the snowpack that covers the Ardennes summits, combined with heavy rainfall events, are responsible for major floods in the lower part of the Ourthe River, as it was the case in February 1984, March 1988, December 1991 or, more recently, in January 2002 and January 2011 (Pauquet and Petit, 1993; de Wit et al., 2007).
Westerlies bring precipitation in the Ardennes through-out the year, and precipitation is all the more abundant as altitude is high. For example, while the mean annual precipitation amount is on average around 800 mm year−1 in the Low and Middle-Belgium, it can
reach 1400 mm year−1 on the Hautes Fagnes plateau. In
general, the climate in the high plateaus of the Ardennes is wetter, colder and more snowy than in the rest of Belgium. Snowfall events can generate a snow cover that can last from 1 to 2 months per year on average,
and that can reach up to 70–80 cm for the most snowy winters.
This peculiar climate which characterizes the summits of Belgium, especially in the Hautes Fagnes plateau, allows the existence of a remarkable ecosystem at this range of altitude (between 500 and 700 m a.s.l.) and latitude (between 49∘ and 51∘N) (Plunus et al., 2014). This ecosys-tem is characterized by active bogs, wet heathland, alpine and even subarctic animal and plant species. Most of these plant species can survive to extreme cold temperatures in the winter months thanks to the protective snow cover that acts as a thermal insulator. Both the peculiar climate and ecosystem of the Belgian high plateaus also gener-ate tourism activities especially in winter (skiing, hiking, educative walks).
2.2. The MAR model description and experiments The RCM used in this study is the MAR model which, although being initially designed for polar regions (Gallée and Schayes, 1994; Fettweis et al., 2013), was also applied to temperate (Brasseur, 2001; Brasseur et al., 2002) and tropical regions (Brasseur et al., 1998; De Ridder and Gal-lée, 1998; Gallée et al., 2004). MAR is a hydrostatic prim-itive equation model in which convection is parametrized according to Bechtold et al. (2001). The atmospheric part of MAR is completely described in Gallée and Schayes (1994) and Gallée (1995). Furthermore, MAR is coupled to the 1-D surface vegetation atmosphere transfer scheme SISVAT (Soil Ice Snow Vegetation Atmosphere Transfer) which is detailed in De Ridder and Gallée (1998). The snow-ice part of SISVAT is the snow model CROCUS from the CEN (Centre d’Etudes de la Neige) described in Brun et al. (1992). The MAR-SISVAT coupling allows the consideration of three sub-pixel surface characteristics for a same MAR pixel. The coupling also allows interac-tion between surface and atmosphere (energy and moisture transfers), snow accumulation and snow melting on the surface, water percolation into the soil/snow, and run-off of exceeding water.
In this study, the version 3.6 of MAR, which is currently being developed at the Laboratory of Climatology and Topoclimatology of the University of Liège (Liège, Bel-gium), was adapted to the Belgian climate. Simulations were performed at a resolution of 5 km over a domain of 120 × 110 pixels centred on (4.3∘W; 50.4∘N) (see Figure S1, Supporting information). Boundary condi-tions [temperature, wind, humidity and pressure at each pressure level of MAR, and sea surface temperature (SST)] were provided every 6 h by forcing reanalyses. We used the third generation ERA-Interim reanalysis (0.75∘ × 0.75∘ horizontal resolution and 60 vertical levels from the surface to 0.01 hPa) (Dee et al., 2011) from the European Centre for Medium-Range Weather Forecasts (ECMWF) over 1979–2014, completed by the second generation ERA40 reanalysis (1.125∘ × 1.125∘ horizon-tal resolution and 60 vertical levels from the surface to 0.01 hPa) (Uppala et al., 2005) over 1958–1978. The first generation NCEP/NCAR-v1 reanalysis (2.5∘ × 2.5∘
horizontal resolution and 28 vertical levels from the surface to 3 hPa) from the National Centres for Envi-ronmental Prediction/National Centre for Atmospheric Research (NCEP/NCAR) was also used (Kalnay et al., 1996) to force MAR over 1958–2014. In addition, MAR was also forced by the third generation ERA-20C reanal-ysis (1.125∘ × 1.125∘ horizontal resolution and 91 vertical levels from the surface to 0.01 hPa) from the ECMWF (Poli et al., 2013) over 1958–2010. Land cover was derived from the CORINE (Coordination of the informa-tion on the Environment) land cover database from the EEA (European Environment Agency). Regarding the other surface characteristics prescribed in SISVAT, such as vegetation seasonality [provided by the monthly nor-malized difference vegetation Index (NDVI)], vegetation cover fraction [derived from the leaf area index (LAI)] or soil type, we used the same datasets as Gallée et al. (2004). Finally, since the first year of our simulations (1958) is used as spin-up, only results after 1959 are considered in our analyses.
2.3. Evaluation datasets
The observations (near-surface temperature, precipitation amount and snow depth) required for the MAR model evaluation were extracted from SYNOP data (http://www .ogimet.com) emitted every hour by 20 weather stations spread over the Belgian territory. These weather stations are listed in Table 1 and mapped in Figure 1. As the Mont Rigi station [identified by its World Meteorolog-ical Organization (WMO) code 06494 in Table 1 and Figure 1] is the reference station for the Hautes Fagnes plateau, we used snow depth measured at 0000 UTC by a snow depth laser sensor at this weather station. Contrary to manual snow depth measurements, laser sensor-driven snow depth measurements are continuously performed with the same instruments, at the same exact place and, in the case of the Mont Rigi station, within a flat, treeless open plateau, thereby limiting potential site effects which could affect those measurements. However, as SYNOP data from the Mont Rigi station were only available from the end of 2007 onwards, the evaluation period only extends from December 2007 to Novem-ber 2014 for the 20 weather stations considered in this study.
In order to identify FE in the lower part of the Ourthe River, daily flow rates measured in the river flow gauging station of Sauheid (50.6∘N; 5.6∘W) (see Figure 1) were extracted for the period 1974–2010 from the database of the ‘Direction Générale Opérationnelle de la Mobilité et des Voies Hydrauliques de la Région Wallonne’. The Sauheid station was chosen because of its most down-stream location in the Ourthe River before the confluence with the Vesdre and the Meuse. According to Pauquet and Petit (1993), a flow rate of 300 m3s−1is considered as the
flow rate above which the Ourthe River can overflow. For all the datasets used during the validation process, gaps in the observations were not filled, and missing data were omitted in our statistics computations.
Table 1. Weather stations from the SYNOP network used in the validation process, with their WMO code, their true location (Lat. 1, Lon. 1 and Alt. 1) and the location of the centre of the nearest MAR pixel (Lat. 2, Lon. 2, Alt. 2).
WMO code Name Lat. 1 (∘) Lon. 1 (∘) Alt. 1 (m) Lat. 2 (∘) Lon. 2 (∘) Alt. 2 (m)
06400 Koksijde 51.08 2.65 4 51.11 2.65 1 06407 Oostende Airport 51.20 2.87 4 51.20 2.86 0 06414 Beitem 50.91 3.12 25 50.89 3.09 24 06428 Munte 50.93 3.73 55 50.94 3.73 37 06431 Gent/Industrie-Zone 51.18 3.82 10 51.21 3.80 5 06432 Chievres 50.57 3.83 60 50.58 3.80 63 06447 Uccle 50.80 4.36 101 50.80 4.37 101 06449 Charleroi/Gosselies 50.46 4.45 187 50.49 4.44 159 06450 Antwerpen/Deurne 51.20 4.47 12 51.21 4.44 12 06451 Bruxelles National 50.88 4.52 55 50.89 4.51 61 06456 Florennes 50.24 4.65 279 50.26 4.65 286 06458 Beauvechain 50.75 4.77 105 50.76 4.80 120 06459 Ernage 50.57 4.68 155 50.58 4.65 158 06465 Schaffen 51.00 5.07 30 50.98 5.09 33 06476 Saint-Hubert 50.04 5.41 563 50.03 5.42 563 06478 Bierset 50.63 5.45 186 50.62 5.43 141 06479 Keine-Brogel 51.17 5.47 55 51.16 5.45 61 06490 Spa/La Sauveniere 50.48 5.92 470 50.48 5.93 484 06494 Mont-Rigi 50.51 6.08 671 50.52 6.07 671 06496 Elsenborne 50.47 6.18 564 50.47 6.21 576
3. Results and discussion
3.1. Evaluation of the MAR model
Values computed by MAR forced by ERA-Interim (called MAR-ERA hereafter), by MAR forced by ERA-20C (called MAR-ERA-20C hereafter) and by MAR forced by NCEP/NCAR-v1 (called MAR-NCEP1 hereafter) are compared over 2008–2014 to daily observations from the 20 weather stations listed in Table 1 and showed in Figure 1. It should be noticed that the MAR-ERA-20C evaluation period only extends from 2008 to 2010 because ERA-20C is not available after 2010. For each weather sta-tion, the closest pixel to the location of the station is chosen to represent the MAR outputs. This comparison shows the ability of MAR to simulate the daily variability of the Bel-gian climate, especially in winter and in the highest parts of the country.
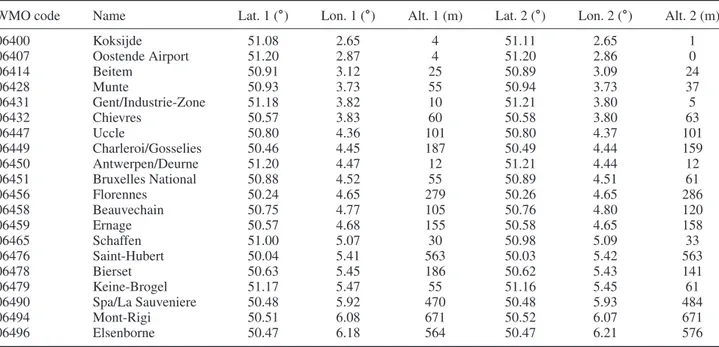
Regarding the daily mean temperature (Tave), MAR accurately simulates the Tave variability in winter at Mont Rigi (the highest Belgian weather station), with correlation coefficients above 0.95 and root mean square error (RMSE) values lower than 40% of the observed
Tave standard deviation (see Figure 2(a)). MAR-ERA provides slightly better results than MAR-NCEP1 and MAR-ERA-20C with better correlation coefficient and RMSE. MAR tends to underestimate Tavein winter with daily biases ranging from +0.01 to −0.61 ∘C at Mont Rigi following the used forcing. The statistics computed for the 20 weather stations confirm these results and show the ability of MAR to accurately simulate the Tavevariability whatever the season (see Figure S2(a)–(d)). They also show that MAR tends to overestimate Tave in spring, autumn, and particularly in summer with biases ranging from +0.95 to +1.84 ∘C (see Figure S2(c)). Consequently, MAR overestimates Tavewith annual daily mean biases of
+0.11 ∘C (MAR-ERA-20C), +0.59 ∘C (MAR-ERA) and +0.70 ∘C (MAR-NCEP1) (see Table 2).
Regarding the daily precipitation amount (PPN) at Mont Rigi, MAR accurately simulates the PPN variability in winter (dominated by stratiform precipitation) with cor-relation coefficients above 0.70 and RMSE values lower than 100% of the observed PPN standard deviation (see Figure 2(b)). MAR-ERA provides again the best results. However, the model overestimates PPN in winter with daily mean biases ranging from +23.2% and +40.0% at Mont Rigi. Nevertheless, the statistics computed for the 20 weather stations show that MAR fails to adequately simulate the PPN variability during the other seasons (see Figure S2(f)–(h)). Moreover, MAR tends to underesti-mate (convective) PPN in summer with biases ranging from −0.1 to −12.9% (see Figure S2(g)). Consequently, MAR slightly underestimates PPN with annual daily mean biases valued at −0.8% (MAR-ERA-20C), −4.3% (MAR-ERA) and −6.4% (MAR-NCEP1) (see Table 3).
Comparison with snow height (SH) measured at the Mont Rigi station in winter (see Figure 2(c)) indicates that MAR simulates very well the daily SH variability, with correlation coefficients larger than 0.80 and RMSE val-ues below 65% of the observed SH standard deviation. However, MAR underestimate SH with biases of around −6 cm day−1which is large compared with the daily mean
snow depth observed at 15 cm. As there is no tempera-ture biases in winter at Mont Rigi (see Figure 2(a)), and because MAR overestimates wintertime daily precipita-tion amounts at Mont Rigi (see Figure 2(b)), these negative daily mean biases in SH could be due to the too large fresh snowfall density (300 kg m−3) used in MAR. A fresh snow-fall density of 300 kg m−3is typical in polar regions, but in
temperate climates, lower values (∼100 kg m−3) are more
(a) (b) (c)
Figure 2. Taylor diagrams showing relative differences between MAR-ERA, MAR-NCEP1 and MAR-ERA-20C in comparison with wintertime observations of (a) daily mean temperature, (b) daily precipitation amount and (c) daily snow height, carried out over 2008–2014 (2008–2010 for
MAR-ERA-20C) at the Mont Rigi weather station. [Colour figure can be viewed at wileyonlinelibrary.com].
Table 2. A total of 20 stations averaged statistics of the daily mean temperature observations and model results over the period 2008–2014: correlation (R), standard deviation (𝜎), root mean squared error (RMSE), daily mean biases and annual daily mean
temperature.
R 𝜎 (∘C) RMSE (∘C) Mean biases (∘C) Mean (∘C)
OBS – 6.40 (6.73) – – 10.30 (9.69) MAR-ERA 0.97 7.22 1.47 +0.59 10.89 MAR-NCEP1 0.96 7.23 1.65 +0.70 11.00 MAR-ERA-20C (0.96) (7.51) (1.42) (+0.11) (9.80) ERA-Interim 0.99 6.42 0.93 +0.32 10.62 NCEP/NCAR-v1 0.95 6.65 1.71 +0.70 11.00 ERA-20C (0.95) (6.50) (1.55) (−0.24) (9.45)
Percentage of usable observations: 98.9 %
The values under brackets indicate that the evaluation period only extents from 2008 to 2010. Finally, the ability of the MAR model to simulate
climatic conditions favourable to floods in the Ourthe
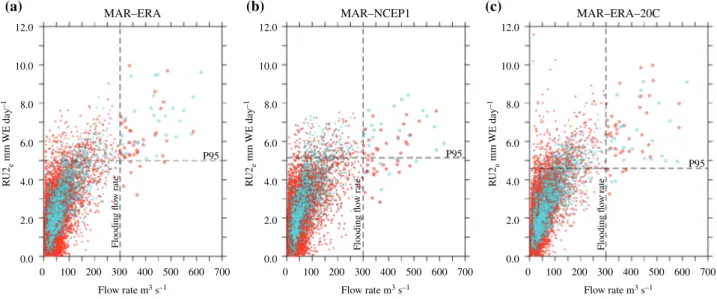
catchment is assessed by comparing observed flood days with potential flood days and periods computed from the MAR results. On the one hand, 28 FE were identi-fied between January 1974 and December 2010 on the basis of flow rates measured in Sauheid (flooding flow rate> 300 m3s−1), which represents a total of 67 flood
days. On the other hand, in order to identify potential flood periods, run-off (RU) computed by MAR is integrated over the Ourthe catchment upstream of Sauheid, which represents an area of ∼2900 km2 (see Figure 1). RU is
then averaged over the 2 days preceding the flood event (RU2), because the typical response time of the Ourthe River to precipitation ranges from 1 to 2 days (Hazenberg
et al., 2008). The MAR-driven run-off partly consists of
precipitation water and of water from melting snow that flow on the ground because of the saturation of the soil in the MAR model. In order to only consider the part of RU2 which really contributes to the river discharge, evaporation computed by MAR is removed from RU2 (RU2e). At last, as there are two types of floods in the Ourthe River, we also distinguish two types of RU2e: RU2e produced by precipitation alone (see the red/dark grey dots in Figure 3)
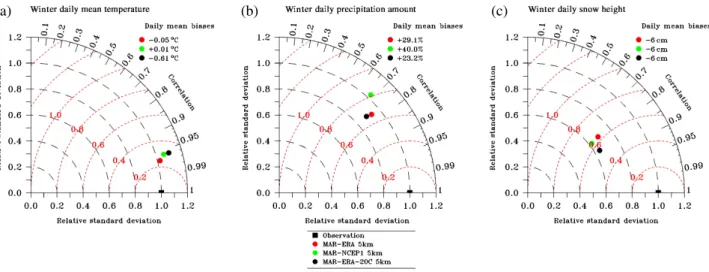
and RU2eproduced by precipitation combined with snow-pack melting (see the blue/light grey dots in Figure 3). We consider 1 day as favourable to floods if RU2e is statistically extreme, i.e. if RU2e is larger than its 95th percentile computed over 1961–1990. The 95th percentile is used because it is commonly used in the literature to define extreme event. Moreover, the trends computed in Section 3.2.2.. do not change following the considered percentile (P90, P95, P99 or P99.5). Thereby, about 90% (60/67) of the observed flood days correspond to potential flood days computed by MAR-ERA and MAR-ERA-20C (see Figure 3(a) and (c)), while this pro-portion only reaches ∼ 60 % (41/67) with MAR-NCEP1 (see Figure 3(b)). Similarly, results in terms of FE indicate that about 90% (25/28) of the observed floods correspond to periods identified as favourable to floods according to MAR-ERA-20C and MAR-ERA. By contrast, this proportion only reaches 64% (18/28) with MAR-NCEP1. However, MAR largely overestimates the number of days which could have generated floods over 1974–2010 with excess of 327, 434 and 702 days for MAR-NCEP1, MAR-ERA and MAR-ERA-20C, respectively (see Figure 3). Indeed, floods also depend on non-climatic factors which are not represented in our estimation, such
Table 3. A total of 20 stations averaged statistics of the daily precipitation amount observations and model results over the period 2008–2014: correlation (R), standard deviation (𝜎), root mean squared error (RMSE), daily mean biases and annual daily mean
precipitation amount.
R 𝜎 (mm day−1) RMSE (mm day−1) Mean biases (mm day−1) Mean (mm day−1)
OBS – 4.85 (5.02) – – 2.30 (2.26) MAR-ERA 0.59 3.47 4.03 −0.10 (− 4.3%) 2.20 MAR-NCEP1 0.49 3.28 4.39 −0.15 (− 6.4%) 2.15 MAR-ERA-20C (0.55) (3.82) (4.35) (−0.02 (−0.8%)) (2.24) ERA-Interim 0.73 3.44 3.46 −0.17 (− 7.2%) 2.13 NCEP/NCAR-v1 0.56 2.96 4.17 −0.50 (−21.7%) 1.80
ERA-20C n.a. n.a. n.a. n.a. n.a.
Percentage of usable observations: 95.6 %
n.a., the data were not available to compute the statistic analysis. The values under brackets indicate that the evaluation period only extents from 2008 to 2010.
as the initial state of the soil prior to an intense run-off event, the infiltration of water into the water tables, the evolution of the surface permeability over time (as a con-sequence of the conversion of natural land surfaces into impervious surfaces, due to urbanization), the surface, subsurface and underground flow. The coupling between the climate model MAR and a hydrological model would allow a better representation of these mechanisms and thus a better comparison with observations. However, the aim of this work in not to study the floods evolution but only the climatic conditions favouring floods.
In view of these results, we can conclude that what-ever the reanalysis forcing the MAR model, the climate variability is well represented by the model over the Belgian territory, although MAR-ERA seems more fitting than MAR-ERA-20C and particularly MAR-NCEP1. MAR-ERA-20C and MAR-NCEP1 overall exhibit lower correlations and higher RMSE values than MAR-ERA in comparison with observed daily temperature and pre-cipitation. In addition, MAR-ERA allows to find more observed floods than MAR-ERA-20C and MAR-NCEP1. We explain the better results of MAR-ERA by the dif-ference between the assimilation system of all three reanalyses (Kalnay et al., 1996; Dee et al., 2011; Poli
et al., 2013). Indeed, all the available data are assimilated
in ERA-Interim. All except satellite data are assimilated in NCEP/NCAR-v1, while only surface pressure and surface marine winds are assimilated in ERA-20C. Moreover, NCEP/NCAR-v1 horizontal and vertical resolution is coarser than the resolution of ERA-20C and particularly ERA-Interim. Furthermore, when directly comparing all three reanalyses with daily mean temperature and daily precipitation amount from weather stations (see Figure S2), the correlations and the RMSE values are better than those obtained with our MAR model forced by the same reanalyses. Actually, the weather station-based data used in this study is the same data that had been assimilated into the reanalyses (except ERA-20C), which explains the dependence between the reanalyses and the data. Nevertheless, because of the low-spatial resolution of the reanalyses, MAR forced by the reanalyses exhibits lower biases especially in winter (see Figures S2(a) and (e)). It is therefore better to use the MAR model instead of the raw
reanalyses, which in addition do not adequately simulate the snow pack.
Besides the biases due to the forcing conditions, some discrepancies can also be related to the MAR model itself. For instance, as a result of the underestimation of the cloud cover in MAR, MAR underestimates temperature in win-ter and overestimate it in summer. Moreover, daily PPN variability is better reproduced in winter (when stratiform precipitation dominates) than in summer (when convec-tive precipitation dominates). Surface and soil properties could also contribute to the MAR model biases through their reflectivity or their water exchanges with the atmo-sphere.
3.2. Trend analysis over the period 1959–2010
3.2.1. Changes in the Belgian climate
A linear trend analysis is performed for the period 1959–2010 over the entire Belgian territory. This period is the longest common period between all three reanalyses forcing the MAR model. Trend significance is assessed by using the uncertainty range of Snedecor for the 95th confidence interval (Snedecor and Cochran, 1967) (Appendix S1) as used by Fettweis (2007). The trend of a time series is significant if its value is higher than its uncertainty range, which mainly corresponds to the interannual variability of the considered time series. The trend analysis particularly focuses on the winter period [December-January-February (DJF)], as more than 70% of the floods in the Ourthe River occur during this season. Only the trends computed using the MAR-ERA results are displayed because the evaluation of the MAR model showed that the MAR-ERA results are the closest to obser-vations (see Section 3.1.). The trends computed using the MAR-ERA-20C results and the MAR-NCEP1 results are however available from Figure S5 to Figure S14.
Mean winter temperature exhibits an increasing trend
ranging from +0.6 ∘C (52 years)−1to +1.0 ∘C (52 years)−1
in the Ourthe catchment (see Figure S3(a)). However, the mean winter temperature trend is non-significant while mean annual temperature exhibits a signifi-cant increasing trend between +0.8 ∘C (52 years)−1
and +1.0 ∘C (52 years)−1 in the Ourthe catchment (see
MAR–ERA 12.0 (a) (b) (c) 10.0 8.0 P95 P95 P95 6.0 RU 2e mm W E da y –1 Floodin g flo w rate Floodin g flo w rate Floodin g flo w rate RU 2e mm W E da y –1 RU 2e mm W E da y –1 4.0 2.0 0.0 0 100 200 300 400 Flow rate m3 s–1 500 600 700 0 100 200 300 400 Flow rate m3 s–1 500 600 700 0 100 200 300 400 Flow rate m3 s–1 500 600 700 12.0 10.0 8.0 6.0 4.0 2.0 0.0 12.0 10.0 8.0 6.0 4.0 2.0 0.0 MAR–NCEP1 MAR–ERA–20C
Figure 3. Two-day averaged run-off integrated over the Ourthe River catchment area upstream of Sauheid (RU2e) computed from (a) MAR-ERA,
(b) MAR-NCEP1 and (c) MAR-ERA-20C, in relation to the flow rate measured in Sauheid. Each point represents 1 day between 1 January 1974 and 31 December 2010. The blue/light grey dots indicate that run-off is generated by snowpack melting combined with rainfall events. The red/dark grey dots indicate that run-off is generated by rainfall events alone. The 95th percentile of RU2erepresented in the graphs is the limit above which the days
are considered as favourable to floods. A flooding flow rate of 300 m3s−1is considered. [Colour figure can be viewed at wileyonlinelibrary.com].
temperature (the 5th percentile of the daily minimum temperature, in agreement with Van de Vyver (2012)) are non-significant everywhere but show a positive signal in the Ardennes (see Figure S3(c)). Extreme maxi-mum temperature in winter (the 95th percentile of the daily maximum temperature, in agreement with Van de Vyver (2012)) also exhibits non-significant trends but show a homogeneous positive signal between +0.6 and +1.4 ∘C (52 years)−1 in the Ardennes (see Figure
S3(d)). The absence of a clear trend in winter temper-ature is also highlighted by Van de Vyver (2012), who found a non-statistically significant linear growth in winter extremes for the period 1952/1953– 2009 over Belgium. In addition, similar results are found using the MAR-NCEP1 outputs (see Figure S5). However, the trends computed from MAR-ERA-20C are positive, larger and significant in any part of Belgium (see Figure S10). It is easily explained by the fact that air temperature is not assimilated in ERA-20C (Poli et al., 2013), which overestimates the global warming in Europe.
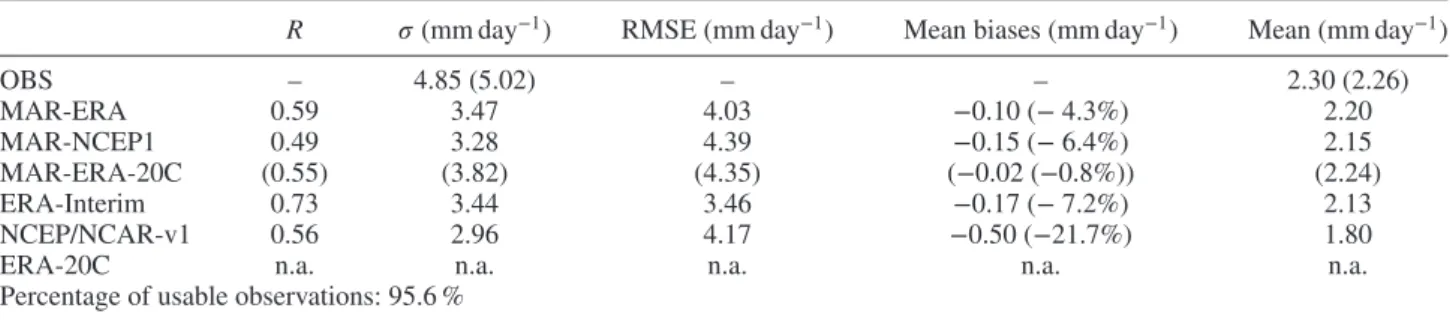
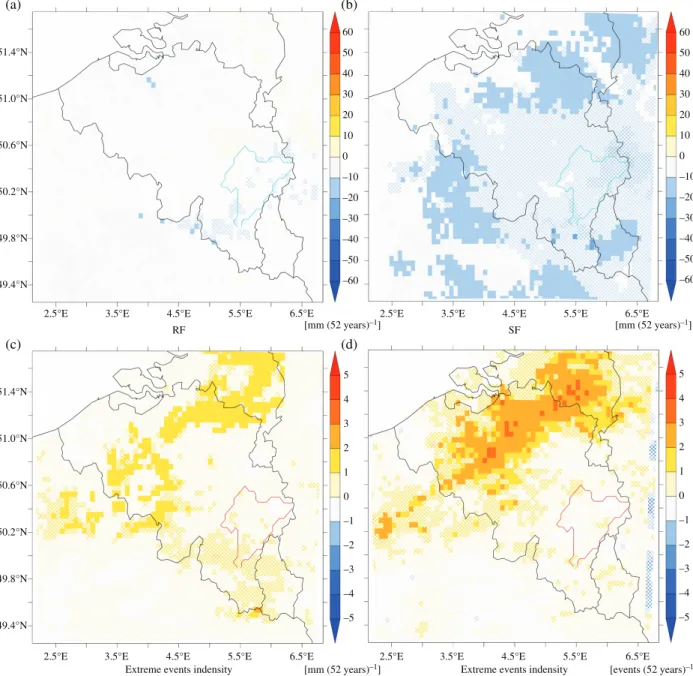
Regarding precipitation changes in winter, no sig-nificant trend is found in the Ourthe catchment. However, Figure 4(a) and (b) show a negative signal in both total rainfall and particularly snowfall valued at −10 mm (52 years)−2at least. Figure 4(c) and (d) display
a positive signal in both extreme precipitation events intensity (trend in the 95th percentile of the daily pre-cipitation amount in winter) and frequency (trend in the number of days with daily precipitation amount larger than its 95th percentile computed over 1960–1991) up to +2 mm years−2and up to +2 events years−2, respectively according to MAR-ERA. The trends computed using the MAR-ERA-20C outputs are similar but larger and thus statistically significant in some parts of the Ourthe catchment (see Figure S11). MAR-NCEP1 simulates
opposite trends in comparison with MAR-ERA and MAR-ERA-20C (see Figure S6). Therefore comparison with previous studies covering Belgium is needed to check the relevance of our results. Most of these studies identify an increase in the winter precipitation amount, along with an increase in both intensity and frequency of extreme precipitation events during winter (Gellens, 2000; Vaes et al., 2002; De Jongh et al., 2006; Ntegeka and Willems, 2008; Willems, 2013a, 2013b; Royal Mete-orological Institute of Belgium (RMI), 2015). However, because the significance of these trends depends both on the length of the time series and on the duration of the precipitation events, the aforementioned studies conclude that no statistically robust trend can be acknowledged regarding precipitation in Belgium. Despite the absence of significant long-term trends, these studies identify multidecadal oscillations characterized by drier periods in the 1900s, around 1920 and in the mid-1970s (De Jongh
et al., 2006; Willems, 2013a; 2013b) alternating with
wetter periods in the 1910–1920s, the 1950–1960s and in the 1990–2000s (Ntegeka and Willems, 2008; Willems, 2013a; 2013b).
By analysing the evolution of the seasonal snow cover in winter, a significant decreasing trend is identified in all three MAR simulations. According to MAR-ERA, the maximum of daily SH significantly decreases by 5 to 10 cm (52 years)−1 in the Ardennes, and by more
than 15 cm (52 years)−1 in the Hautes Fagnes Plateau
(see Figure 5(a)). Considering snow days as days with a snow cover of at least 5 cm of thickness, in agreement with Erpicum et al., (1991), the number of snow days significantly decreases up to −15 days (52 years)−1 (see
Figure 5(b)). The onset of the snow cover season (the first day of the year with a snow cover height of at least 1 cm) is delayed up to +60 days (52 years)−1 in some parts of
51.4°N (a) (b) (c) (d) 60 50 40 30 20 10 0 –10 –20 –30 –40 –50 –60 5 4 3 2 1 0 –1 –2 –3 –4 –5 5 4 3 2 1 0 –1 –2 –3 –4 –5 60 50 40 30 20 10 0 –10 –20 –30 –40 –50 –60 51.0°N 50.6°N 50.2°N 49.8°N 49.4°N 51.4°N 51.0°N 50.6°N 50.2°N 49.8°N 49.4°N
2.5°E 3.5°E 4.5°E
Extreme events indensity [mm (52 years)–1] Extreme events indensity [events (52 years)–1]
5.5°E 6.5°E 2.5°E 3.5°E 4.5°E 5.5°E 6.5°E
2.5°E 3.5°E 4.5°E
RF [mm (52 years)–1] SF [mm (52 years)–1]
5.5°E 6.5°E 2.5°E 3.5°E 4.5°E 5.5°E 6.5°E
Figure 4. Trends computed from MAR-ERA over 1959–2010 in (a) the rainfall amount (RF) in winter (DJF), (b) the snowfall amount (SF) in winter, (c) the intensity of extreme precipitation events in winter (trend in the 95th percentile of daily precipitation amount in winter), and (d) the frequency of extreme precipitation events in winter (trend in the number of days in winter with daily precipitation amount larger than its 95th percentile computed over 1961–1990). Filled pixels indicate the places where the trends are statistically significant. [Colour figure can be viewed at
wileyonlinelibrary.com]. the Ourthe catchment (see Figure 5(c)). By contrast, the
end of the snow cover season (the last day of the year with a snow cover height of at least 1 cm) is shortened up to −60 days (52 years)−1 only in a small part of the Ourthe
catchment area (see Figure 5(d)). Therefore, the duration of the snow cover season seems to shorten throughout the last 52 years. Similar results are found using the outputs of MAR-NCEP1 (see Figure S7) and MAR-ERA-20C (see Figure S12). These results are in agreement with studies carried out in other regions in Europe, such as the low- and medium-elevated parts of the Alps (e.g. Durand
et al., 2009; Valt and Cianfarra, 2010; Beniston, 2012b),
or the lowland and coastal regions of Norway (Skaugen
et al., 2012; Dyrrdal et al., 2013).
Changes in the winter atmospheric regional circulation partly explains the trends found in our results. In Western Europe, these circulation changes are often assessed by analysing changes in the North Atlantic Oscillation (NAO) Index (e.g. Hurrell, 1995; Slonosky and Yiou, 2001; Philipp et al., 2007). The NAO Index is defined as the difference of the atmospheric surface pressure between the Azores High and the Icelandic Low, which corresponds to the normalized difference of sea level surface pressure measured in Lisbon (Portugal) and in Stykkisholmur/Reykjavik (Iceland). In the wintertime, the NAO Index is known for its high influence on the weather of Western Europe and for its high day-to-day and year-to-year variability. For instance, negative NAO
51.4°N (a) (b) (c) (d) 60 20 15 10 50 0 –5 –10 –15 –20 20 15 10 50 0 –5 –10 –15 –20 50 40 30 20 10 0 –10 –20 –30 –40 –50 –60 60 50 40 30 20 10 0 –10 –20 –30 –40 –50 –60 51.0°N 50.6°N 50.2°N 49.8°N 49.4°N 51.4°N 51.0°N 50.6°N 50.2°N 49.8°N 49.4°N
2.5°E 3.5°E 4.5°E
Si [days (52 years)–1] Sf [days (52 years)–1]
5.5°E 6.5°E 2.5°E 3.5°E 4.5°E 5.5°E 6.5°E
2.5°E 3.5°E 4.5°E
SHmax [mm (52 years)–1] SD [days (52 years)–1]
5.5°E 6.5°E 2.5°E 3.5°E 4.5°E 5.5°E 6.5°E
Figure 5. Trends computed from MAR-ERA over 1959–2010 in (a) the maximum daily snow depth (SD) in winter (DJF), (b) the number of days per winter with a snow cover of at least 5 cm of thickness (SD), (c) the first day of the year with a snow depth of at least 1 cm (Si), and (d) the last day of the year with snow depth of at least 1 cm (Sf). Filled pixels indicate the places where trends are statistically significant. [Colour figure can be
viewed at wileyonlinelibrary.com]. Index values usually correspond to cold and snowy winters
in Belgium such as the winter 2009–2010 (Cattiaux et al., 2010), while positive NAO Index values are associated with mild and rainy winters.
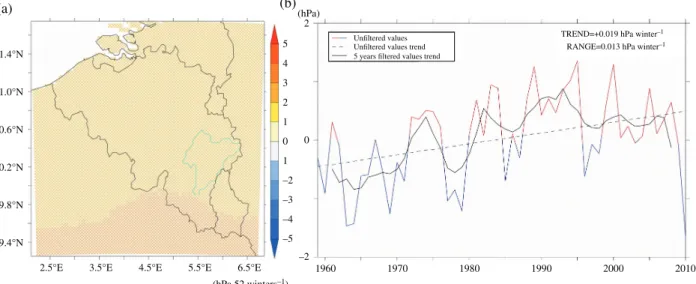
As outlined by Van de Vyver (2012), the absence of clear trends in the winter temperatures of Belgium could be due to the perturbation of the warming signal by the high variability of the regional atmospheric circulation in winter, assessed from the variation of the NAO Index in winter (see Figure 6(b)).
Furthermore, as the decrease in snowfall does not bring more rainfall, it suggests that the (non-significant) increas-ing mean winter temperature would not be responsible for this declining snowfall trend and the resulting decrease
in snow accumulation. Thus, changes in the winter atmo-spheric regional circulation explain in part this decline of both precipitation amount and snow accumulation. Figures 6(a), S8(a) and S13(a) show that whatever the reanalysis forcing the MAR model, an increasing trend in the daily mean surface pressure in winter of about 1 to 3 hPa (52 years)−1 is found, suggesting an increase in the
occurrence of anticyclonic conditions in winter over the Belgian territory. In addition, Figure 6(b) shows a signif-icant long-term increasing trend in the NAO Index during winter over the studied period, suggesting a strengthening in the Azores High. These more anticyclonic-like condi-tions in winter are likely to cause the decrease in total precipitation amount including snowfall, leading thus to
(b) (a) 51.4°N 51.0°N 50.6°N 50.2°N 49.8°N 49.4°N
2.5°E 3.5°E 4.5°E 5.5°E 6.5°E 1960 (hPa) 2 5 4 3 2 1 0 1 –2 –3 –4 –5 Unfiltered values Unfiltered values trend 5 years filtered values trend
TREND=+0.019 hPa winter–1
RANGE=0.013 hPa winter–1
0
–2
1970 1980 1990 2000 2010
(hPa 52 winters–1)
Figure 6. Trends over 1959–2010 of (a) the mean surface pressure in winter (DJF) computed from MAR-ERA, and (b) the mean NAO index recorded in winter. Filled pixels indicate the places where the trends are statistically significant. [Colour figure can be viewed at wileyonlinelibrary.com]. reduced snow accumulation. However, the MAR
integra-tion domain used in this study is not large enough to further investigate hypothetical circulation changes over Western Europe.
However, this decrease in the precipitation amount over the studied period may also depend on the period selected for conducting the trend analysis as the climate of Belgium is affected by multidecadal oscillations (e.g. Ntegeka and Willems, 2008; Willems, 2013a; 2013b).
Nonetheless, it should be noted that the decreasing trends in both precipitation amount and snow accumulation sim-ulated by MAR in winter are in part biased by the inability of MAR to properly simulate convective precipitation (see Section 3.1.). Indeed, the MAR simulates an increase in convective precipitation during winter especially if MAR is forced by NCEP/NCAR-v1 (see Figure S9(b)). There-fore, the decrease in precipitation in winter simulated by MAR could be resulting from an inadequate convective scheme in the model, given that MAR is a hydrostatic model running at a resolution of 5 km. In addition, the raw reanalyses and previous studies using weather station observations have opposite conclusions.
In any case, the increase in convective precipitation in winter remains to be explained. As this increase is the greatest in coastal regions (see Figure S9(b)), warmer sea surface temperatures could have enhanced instability of the perturbations which usually cross the country from north-west to south-east and thereby bring convective pre-cipitation. The North Sea is indeed acknowledged to be one of the seas belonging to the north-east Atlantic region which have recorded the fastest warming over the last 25 years (Joyce, 2006; Sherman et al., 2007).
Lastly, it should also be noticed that the signal of the trends in both the intensity and the frequency of extreme precipitation events is not clear. The trends obtained from the MAR-NCEP1 outputs (negative signal) more particularly contrast with the signal obtained from the MAR-ERA and the MAR-ERA-20C outputs, as well as
with conclusions of previous studies. It brings to light that the reanalysis data (in particular NCEP/NCAR-v1) may be too coarse to allow to MAR to capture extreme precipita-tion events in an accurate way because we directly force the MAR model with the reanalysis.
3.2.2. Changes in conditions favourable to floods
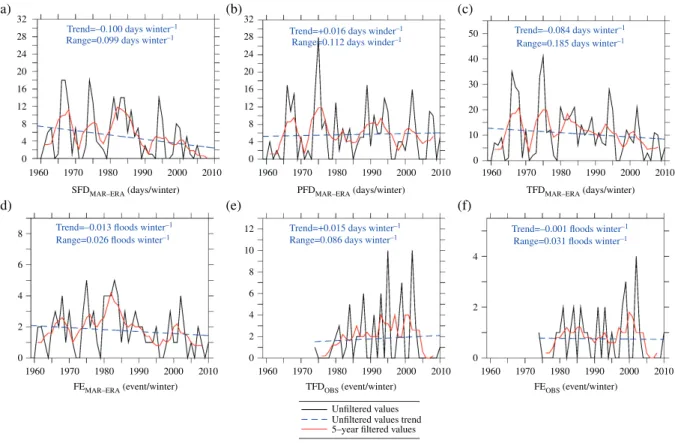
Because more than 70% of the floods in the Ourthe River occurred in winter, changes in conditions favourable to floods are investigated by focusing on this season. Days favourable to floods (as defined in Section 3.1.) computed from the MAR-ERA results are summed for each winter of 1959–2010 [see total flood says (TFD) in Figure 7(c)]. A distinction is also made between days favourable to floods resulting from snowpack melting combined with precipitation [see (snowmelt-induced flood days SFD) in Figure 7(a)], and days favourable to floods from precipi-tation only [see precipiprecipi-tation-induced flood days (PFD) in Figure 7(b)]. Then, for each of these time series, trends and their significance are computed following the method described in Appendix S1. Finally, a 5-year running mean is applied to the time series. The same work is also repeated for the MAR-NCEP1 and MAR-ERA-20C outputs and is available in Figures S15 and S16.
First of all, long-term linear trends show that MAR-ERA exhibits a significant decreasing trend in SFD of −0.100 days/winter (see Figure 7(a)). Results obtained using MAR-NCEP1 and MAR-ERA-20C confirm the decreasing trend in SFD. However, regarding PFD, the results contrast following the reanalysis forcing the MAR model because MAR-ERA shows no trend (see Figure 7(b)), MAR-NCEP1 shows a significant decreas-ing trend and MAR-ERA-20C computes a non-significant increasing trend. As a result, regarding TFD, MAR-ERA shows a non-significant decreasing trend valued at −0.084 days/winter (see Figure 7(c)), MAR-NCEP1 exhibits a significant decrease in TFD over the studied
32
(a) (b) (c)
(d) (e) (f)
Trend=–0.100 days winter–1
Range=0.099 days winter–1 Trend=+0.016 days winder
–1
Range=0.112 days winder–1
Trend=–0.084 days winter–1
Range=0.185 days winter–1
Trend=–0.013 floods winter–1
Range=0.026 floods winter–1
Trend=+0.015 days winter–1
Range=0.086 days winter–1 Trend=–0.001 floods winter
–1
Range=0.031 floods winter–1
28 24 20 16 12 8 4 0 1960 1970
SFDMAR–ERA (days/winter) PFDMAR–ERA (days/winter) TFDMAR–ERA (days/winter)
FEMAR–ERA (event/winter) TFDOBS (event/winter) Unfiltered values Unfiltered values trend 5–year filtered values
FEOBS (event/winter) 1980 1990 2000 2010 1960 1970 1980 1990 2000 2010 1960 1970 1980 1990 2000 2010 1960 1970 1980 1990 2000 2010 1960 1970 1980 1990 2000 2010 1960 1970 1980 1990 2000 2010 8 12 10 8 6 4 2 0 6 4 2 0 4 2 0 32 50 40 30 20 10 0 28 24 20 16 12 8 4 0
Figure 7. Unfiltered values, 5-year filtered values and trends computed from MAR-ERA over 1959–2010 of (a) the number of days per winter (DJF) favourable to floods due to snowpack melting combined with rainfall events (SFDMAR-ERA), (b) the number of days per winter favourable to floods due to rainfall events alone (PFDMAR − ERA), (c) the total number of days per winter favourable to floods (TFDMAR − ERA), (d) the number of flood events favourable to floods per winter (FEMAR − ERA). Unfiltered values, 5-year filtered values and trends computed from observations in Sauheid are also displayed with (e) the number of observed flood days per winter (TFDOBS), and (f) the number of observed flood events per winter (FEOBS).
[Colour figure can be viewed at wileyonlinelibrary.com]. period while MAR-ERA-20C exhibits no trend.
Obser-vations of effective flood days (TFDOBS) in Sauheid, based on flow rate measurements between 1974 and 2010, show no trend (see Figure 7(e)). In terms of (FE), only MAR-NCEP1 exhibits a significant trend valued at −0.042 floods/winter (see Figure S15(d)) while no significant trend can be found in the observations (see Figure 7(f)). However, as MAR underestimates convec-tive precipitation, especially if the model is forced by NCEP/NCAR-v1, extreme run-off events generated by this kind of precipitation are probably underestimated. Therefore, the trends in conditions favourable to floods computed from the MAR results are likely to be slightly overestimated, given that the ratio of convective precip-itation events versus stratiform precipprecip-itation has been increasing since 1959 (see Figure S9(b)).
On the basis of FE observed over 1974–2010 in Sauheid, two periods of higher flood occurrence are identified in the 1980s, in agreement with Pauquet and Petit (1993), and also in the 2000s (see the 5-year running mean (fil-tered) values in Figure 7(f)). The period of higher flood occurrence in the 1980s seems to be partly induced by an increase in hydroclimatic conditions favourable to floods, as a peak is also simulated by all three MAR configura-tions during this period in SFD (see the 5-year running mean values in Figure 7(a)). The higher observed flood occurrence in the 2000s could also be partly related to
an increase in favourable hydroclimatic conditions, as all three MAR simulations, and more particularly MAR-ERA and MAR-ERA-20C, show a new peak in simulated SFD (see the 5-year running mean values in Figure 7(a)) and especially in simulated PFD (see the 5-year running mean values in Figure 7(b)). Although observations about FE frequency are available only after 1974, we identify another peak in the 1960s in SFD (see the 5-year run-ning mean values in Figure 7(a)), PFD (see the 5-year running mean values in Figure 7(b)). Since this peak coin-cides with the higher flood frequency period of the 1960s observed by Pauquet and Petit (1993), we assume that this period of higher floods frequency was also induced by favourable hydroclimatic conditions. In addition, previous studies identified the 1960s as a wetter period (Ntegeka and Willems, 2008; Willems, 2013a, 2013b).
4. Conclusions and prospects
The main objectives of this paper were first to determine whether significant trends in snow cover evolution exist over the period 1959–2010 in the Belgian Ardennes. Sec-ondly, since most of the floods that take place in the Ardennes rivers occur in winter as a result of rapid snow-pack melting and/or heavy rainfall events, this paper also aimed to assess the changes in hydroclimatic conditions
that could generate floods in the Ourthe, a river of the Ardennes. The recent changes in climate were recon-structed using the RCM MAR forced by several reanal-ysis datasets: ERA-Interim (1979–2014) completed by ERA40 (1958–1978), NCEP/NCAR-v1 (1958–2014) and ERA-20C (1958–2010).
Trends over the period 1959–2010 were computed from the MAR outputs by focusing on the winter months. In the Ourthe catchment area, neither MAR-ERA nor MAR-NCEP1 show any significant trends whether in winter mean temperature or in extreme (P5 and P95) tem-perature. Regarding precipitation in winter, MAR-NCEP1 and MAR-ERA-20C show a significant decrease in large part of the Ourthe catchment ranging from −10 and −40 mm (52 years)−2. Trends in both intensity and
fre-quency of extreme precipitation events show a positive signal with MAR-ERA and with MAR-ERA-20C reaching +4 mm (52 years)−2 and +4 extreme events (52 years)−2
in some parts of the Ourthe catchment. All MAR configu-rations exhibit a significant decrease in the maximum SH reached during winter in the Ardennes over 1959–2010, with trends valued between −5 and −15 cm (52 years)−1
in the Ourthe catchment. The number of days with at least 5 cm of snow accumulation is reduced up to −15 days (52 years)−1, and the beginning of the snow sea-son is delayed up to −60 days (52 years)−1 in the highest parts of the Ourthe catchment. Because the NAO is known to highly impact the weather of European winters, the large interannual variability of the NAO Index explains the absence of significant trends in winter temperature in Belgium in comparison with the observed global warming. The general increase of the NAO index observed since 1959 suggests a higher occurrence of anticyclonic condi-tions, which could be responsible for the decrease in winter precipitation and consequently for the decrease in snow accumulation. However, the multidecadal oscillations in Belgian precipitation could also explain the absence of clear trend in precipitation amount and extremes.
Regarding hydroclimatic conditions favouring floods in winter in the Ourthe catchment, the number of days favourable to floods due to snow melting combined with rainfall events is decreasing over 1959–2010 whatever the MAR simulations. This results from a decrease in snow accumulation in winter and from a shortening of the snow season over the studied period. Regarding the number of days favourable to floods due to intense rainfall alone, the signal depends on the reanalysis used as forcing. It is due to the fact that the signal and the pattern of the trends in both the intensity and the frequency of extreme precipitation events differ depending on the MAR forcing. In a warmer climate, we could assume that the current trend of decreas-ing floods due to abrupt meltdecreas-ing of the snowpack should accelerate. Yet, this decreasing trend favouring less floods in Belgium could be compensated by an increase in the occurrence of extreme rainfall events and by an increase in precipitation amount in autumn and winter as highlighted by Baguis et al. (2010), Willems (2013c) or Tabari et al. (2015). Similar simulations using global models from the CMIP5 (Coupled Model Intercomparison Project Phase 5)
database as forcing should help to better predict potential changes at the end of this century. It would allow to pro-vide dynamic downscaling results to enhance the statistical downscaling findings (Tabari et al., 2015).
This study brings to light the differences and the lim-its of the reanalyses used to force the MAR model. Indeed, the comparison of the model results with observa-tions over 2008–2014 showed that MAR-ERA produces slightly better results than MAR-ERA-20C and particu-larly MAR-NCEP1. In addition, the trend study shows that the results differ according the reanalysis forcing MAR. It also shows that given the unclear signal for the impact of extreme precipitation evolution on conditions favouring floods, the reanalysis data is maybe too coarse to allow to MAR to capture those events in an accurate way. A quick comparison with the literature allows to determine which reanalysis forcing the MAR model is the best to study each variables.
• When used as MAR forcing, NCEP/NCAR-v1 pro-duces the worst results when compared with observa-tions, especially in terms of precipitation amount mea-surements and consequently floods dates. The trend study shows that MAR forced by this reanalysis pro-duces trends in opposition with previous studies and the two other MAR simulations regarding the wintertime extreme events intensity and frequency, as well as con-ditions favourable to floods generating by intense rain-fall events. However, MAR-NCEP1 produces consistent results regarding trends in temperature, snow accumula-tion and snow season. The weaknesses of MAR-NCEP1 could be explained by the low-spatial resolution of the NCEP/NCAR-v1 reanalysis as the MAR model is directly forced by this reanalysis. Therefore, using MAR-NCEP1 simulations performed at an intermediate resolution as forcing of the 5 km MAR would possibly improve the results. However, it should be noticed that Kay et al. (2015) found that the direct use of data from the intermediate resolution is generally better for hydro-logical modelling.
• ERA-20C produces good results when compared with observations. However, the trends in winter tempera-ture computed from MAR-ERA-20C are overestimated as well as the trends in snow season. Despite bet-ter spatial resolution than NCEP/NCAR-v1, air tem-perature data are not assimilated in ERA-20C which potentially explains this bias in temperature. However, MAR-ERA-20C produces consistent results regarding trends in extreme precipitations events, trends in snow accumulation and consequently trends in hydroclimatic conditions favourable to floods.
• ERA-Interim produces the best results when compared with observations and conclusions of previous studies. It is due to a better data assimilation system and a better spatial resolution in comparison with NCEP/NCAR-v1 or ERA-20C.
Finally, this study highlights the strengths and the weak-nesses of the MAR model running over a temperate region.
Regardless of the reanalysis used as forcing, MAR showed its ability to reconstruct the variability of the Belgian cli-mate, especially the daily variability of temperature and snow depth. However, MAR underestimates temperature in winter and conversely, it overestimates temperature in summer. MAR also underestimates snow depth. More-over, MAR shows difficulties to simulate precipitation in terms of daily variability and amount. Last of all, although the model allows to reconstruct hydroclimatic conditions favouring floods in the Ourthe catchment, it largely over-estimates the number of days which could have generated floods over 1974–2010. Therefore, in the view of these discrepancies, improvements in the model are required such as:
• The re-parametrization of the fresh snowfall density would correct the negative bias in snow accumulation. Indeed, we used a fresh snowfall density of 300 kg m−3
which is typical in polar regions while lower values are more relevant in temperate climates (∼100 kg m−3).
• The improvement of the convective scheme parametrized in MAR would partly correct precipi-tation biases as well as temperature biases in summer. However, it should be noticed that studies using convection-permitting RCM have shown that, while some aspects of precipitation are improved, some are not improved or can even be worse (e.g. Kendon et al., 2012; Chan et al., 2013).
• The improvement of the surface and soil properties of MAR would also partly correct precipitation and tem-perature biases because test simulations demonstrate that wetter soils allow to correct the temperature biases in summer. Currently, only the first metre of soil is resolved in MAR. A deeper soil (10 m) could improve the results. In addition, the coupling of MAR with a vegetation model would allow MAR to have dynamic surface properties.
• The two-way coupling between MAR and a hydrologi-cal model would allow to improve floods detection and simulation by taking into account mechanisms which are too simplified or not represented in the RCMs. More-over, it would possibly reduce the temperature and pre-cipitation biases by enhancing energy and water fluxes between the surface/soil and the atmosphere (e.g. Larsen
et al., 2016; Wagner et al., 2016).
Acknowledgements
The authors acknowledge the Fund for Research Training in Industry and Agriculture of Belgium for funding this study. The authors are also grateful to the Consortium
des Équipements de Calculs Instensifs for providing
high-performance scientific computing facilities and resources. The authors take this opportunity to thank the team of the Laboratoire d’Hydrographie et de
Géomor-phologie Fluviatile of the University of Liège (Belgium)
and Marc Van Diepenbeeck from the Royal Meteorolog-ical Institute (Uccle, Belgium) for their collaboration.
Weather data used in this study was obtained from the OGIMET website: www.ogimet.com. Flow rate mea-surements were provided by the Direction Générale
Opérationnelle de la Mobilité et des Voies Hydrauliques de la Région Wallonne. The ERA40, ERA-Interim and
ERA-20C reanalyses used in this study were obtained from the ECMWF data server: http://apps.ecmwf.int/ datasets, while the NCEP/NCAR-v1 reanalysis was obtained from the NOAA/ESRL Physical Sciences Divi-sion website: http://www.esrl.noaa.gov/psd/data/gridded/ data.ncep.reanalysis.html.
Supporting information
The following supporting information is available as part of the online article:
Appendix S1: Linear regression and uncertainty range for the 95% confidence interval of Snedecor.
Figure S1: The MAR model integration domain and orog-raphy.
Figure S2: Taylor diagrams showing relative differences between MAR-ERA, MAR-NCEP1, MAR-ERA-20C, ERA-Interim, NCEP/NCAR-v1 and ERA-20C in compar-ison with seasonal observations of daily mean temperature and daily precipitation amount over 2008–2014.
Figure S3: Trends computed from MAR-ERA over
1959–2010 in the mean winter temperature, the yearly mean temperature, the extreme minimum temperature in winter (DJF) and the extreme maximum temperature in winter, over Belgium.
Figure S4: Trends computed from MAR-ERA over
1959–2010 in the percentage of stratiform and convective precipitation amount in winter (DJF), over Belgium.
Figure S5: Same as Figure S3 but for MAR-NCEP1.
Figure S6: Trends computed from MAR-NCEP1 over
1959–2010 in the rainfall and snow fall amount in winter (DJF), the intensity of extreme precipitation events in winter and the frequency of extreme precipitation events in winter, over Belgium.
Figure S7: Trends computed from MAR-NCEP1 over
1959–2010 in the maximum daily snow height in winter (DJF), the number of days with a snow cover of at least 5 cm of thickness in winter, the first day of the year with a snow cover of at least 1 cm and the last day of the year with a snow cover of at least 1 cm, over Belgium.
Figure S8: Trends computed from the MAR-NCEP1
out-puts over 1959–2010 in the mean surface pressure in win-ter (DJF) over Belgium and trend in the mean NAO Index recorded in winter over the same period.
Figure S9: Same as Figure S4 but for MAR-NCEP1.
Figure S10: Same as Figure S3 but for MAR-ERA-20C.
Figure S11: Same as Figure S6 but for MAR-ERA-20C.
Figure S12: Same as Figure S7 but for MAR-ERA-20C.
Figure S13: Same as Figure S8 but for MAR-ERA-20C.
Figure S14: Same as Figure S4 but for MAR-ERA-20C.
Figure S15: Unfiltered values, 5-year filtered values and trends computed from the wintertime MAR-NCEP1 results over 1959–2010 of the number of days favourable to floods due to snowpack melting associated with intense
rainfall events, the number of days favourable to floods due to intense rainfall events, the total number of days favourable to floods, the number of events favourable to floods, in the Ourthe catchment. Flood days and events observed in Sauheid in winter are also displayed.
Figure S16: Same as Figure S15 but for MAR-ERA-20C.
References
Baguis P, Roulin E, Willems P, Ntegeka V. 2010. Climate change scenarios for precipitation and potential evapotranspiration over central Belgium. Theor. Appl. Climatol. 99(3–4): 273–286, doi: 10.1007/s00704-009-0146-5.
Barnett TP, Adam JC, Lettenmaier DP. 2005. Potential impacts of a warming climate on water availability in snow-dominated regions.
Nature 438: 303–309, doi: 10.1038/nature04141.
Bechtold P, Bazile E, Guichard F, Mascart P, Richard E. 2001. A mass-flux convection scheme for regional and global models. Q. J.
R. Meteorol. Soc. 127(573): 869–886, doi: 10.1002/qj.49712757309.
Bell VA, Kay AL, Davies HN, Jones RG. 2016. An assessment of the possible impacts of climate change on snow and peak river flows across Britain. Clim. Change 136(3): 539–553, doi: 10.1007/s10584-016-1637-x.
Beniston M. 2012a. Impacts of climatic change on water and associated economic activities in the Swiss Alps. J. Hydrol. 412: 291–296, doi: 10.1016/j.jhydrol.2010.06.046.
Beniston M. 2012b. Is snow in the Alps receding or disappearing? Wiley
Interdiscip. Rev. Clim. Chang. 3(4): 349–358, doi: 10.1002/wcc.179.
Birsan MV, Dumitrescu A. 2014. Snow variability in Romania in con-nection to large-scale atmospheric circulation. Int. J. Climatol. 34(1): 134–144, doi: 10.1002/joc.3671.
Brasseur O. 2001. Development and application of a physical approach to estimating wind gusts. Mon. Weather Rev. 129: 5–25.
Brasseur O, Tricot C, Ntezimana V, Gallée H, Schayes G. 1998. Impor-tance of the convective adjustment scheme in the simulation of the diurnal cycle of convective activity in Africa. In Proceedings of the
International Conference: “Tropical Climatology, Meteorology and Hydrology”, Demarée G, Alexandre J, De Dapper M (eds). The Royal
Meteorological Institute of Belgium: Brussels, Belgium, 299–312. Brasseur O, Gallée H, Creutin JD, Lebel T, Marbaix P. 2002. High
reso-lution simulations of precipitations over the Alps with the perspective of coupling with a hydrological model. In Climate Change:
Implica-tions for the hydrological cycle and for water management. Advances in Global Change Research 10, Beniston M (ed). Kluwer Academic
Publisher: Dordrecht, the Netherlands and Boston, MA, 75–100. Brown RD, Petkova N. 2007. Snow cover variability in Bulgarian
moun-tainous regions, 1931–2000. Int. J. Climatol. 27(9): 1215–1229, doi: 10.1002/joc.1468.
Brun É, David P, Sudul M, Brunot G. 1992. A numerical model to simu-late snow-cover stratigraphy for operational avalanche forecasting. J.
Glaciol. 38(128): 13–22.
Cattiaux J, Vautard R, Cassou C, Yiou P, Masson-Delmotte V, Codron F. 2010. Winter 2010 in Europe: a cold extreme in a warming climate.
Geophys. Res. Lett. 37(20): L20704, doi: 10.1029/2010GL044613.
Chan SC, Kendon EJ, Fowler HJ, Blenkinsop S, Ferro CAT, Stephenson DB. 2013. Does increasing the spatial resolution of a regional climate model improve the simulated daily precipitation? Clim. Dyn. 41: 1475–1495, doi: 10.1007/s00382-012-1568-9.
De Jongh IL, Verhoest NE, De Troch FP. 2006. Analysis of a 105-year time series of precipitation observed at Uccle, Belgium. Int. J.
Clima-tol. 26(14): 2023–2039, doi: 10.1002/joc.135.
De Ridder K, Gallée H. 1998. Land surface-induced regional climate change in southern Israel. J. Appl. Meteorol. 37: 1470–1485. De Troch R, Hamdi R, Van de Vyver H, Geleyn JF, Termonia P.
2013. Multiscale performance of the ALARO-0 model for simulat-ing extreme summer precipitation climatology in Belgium. J. Clim. 26(22): 8895–8915, doi: 10.1175/JCLI-D-12-00844.1.
De Wit MJM, Peeters HA, Gastaud PH, Dewil P, Maeghe K, Baumgart J. 2007. Floods in the Meuse basin: event descriptions and an inter-national view on ongoing measures. Int. J. River Basin Manage. 5(4): 279–292, doi: 10.1080/15715124.2007.9635327.
Dee DP, Uppala SM, Simmons AJ, Berrisford P, Poli P, Kobayashi S, Andrae U, Balmaseda MA, Balsamo G, Bauer P, Bechtold P, Beljaars ACM, van de Berg L, Bidlot J, Bormann N, Delsol C, Dragani R, Fuentes M, Geer AJ, Haimberger L, Healy SB, Hersbach H, Hólm
EV, Isaksen L, Kållberg P, Köhler M, Matricardi M, McNally AP, Monge-Sanz BM, Morcrette J-J, Park B-K, Peubey C, de Rosnay P, Tavolato C, Thépaut J-N, Vitart F. 2011. The ERA-Interim reanalysis: configuration and performance of the data assimilation system. Q. J.
R. Meteorol. Soc. 137(656): 553–597, doi: 10.1002/qj.828, 2011.
Driessen TLA, Hurkmans RTWL, Terink W, Hazenberg P, Torfs PJJF, Uijlenhoet R. 2010. The hydrological response of the Ourthe catch-ment to climate change as modelled by the HBV model. Hydrol. Earth
Syst. Sci. 14(4): 651–665, doi: 10.5194/hess-14-651-2010.
Durand Y, Giraud G, Laternser M, Etchevers P, Mérindol L, Lesaf-fre B. 2009. Reanalysis of 47 years of climate in the French Alps (1958–2005): Climatology and trends for snow cover. J. Appl.
Mete-orol. Climatol. 48(12): 2487–2512, doi: 10.1175/2009JAMC1810.1.
Dyrrdal AV, Saloranta T, Skaugen T, Stranden HB. 2013. Changes in snow depth in Norway during the period 1961–2010. Hydrol. Res. 44: 169–179, doi: 10.2166/nh.2012.064.
Erpicum M, Mabille G, Vlassis P. 1991. Variabilité spatiale et temporelle de l’enneigement du sol en Belgique. Publ. Assoc. Int. Climatol. 4: 267–273.
Falarz M. 2004. Variability and trends in the duration and depth of snow cover in Poland in the 20th century. Int. J. Climatol. 24(13): 1713–1727, doi: 10.1002/joc.1093.
Fettweis X. 2007. Reconstruction of the 1979–2006 Greenland ice sheet surface mass balance using the regional climate model MAR.
Cryosphere 1: 27–40, doi: 10.5194/tc-1-21-2007.
Fettweis X, Franco B, Tedesco M, Van Angelen JH, Lenaerts JTM, Van den Broeke MR, Gallée H. 2013. Estimating Greenland ice sheet surface mass balance contribution to future sea level rise using the regional atmospheric climate model MAR. Cryosphere 7: 469–489, doi: 10.5194/tc-7-469-2013.
Gallée H. 1995. Simulation of the mesocyclonic activity in the Ross Sea, Antarctica. Mon. Wea. Rev. 123: 2051–2069.
Gallée H, Schayes G. 1994. Development of a three-dimensional meso-primitive equation model: katabatic winds simulation in the area of Terra Nova Bay, Antarctica. Mon. Weather Rev. 122: 671–685. Gallée H, Guyomarch G, Brun E. 2001. Impact of snow drift on the Antarctic ice sheet surface mass balance: possible sensitivity to snow-surface properties. Bound.-Layer Meteorol. 99(1): 1–19, doi: 10.1023/A:1018776422809.
Gallée H, Moufouma-Okia W, Bechtold P, Brasseur O, Dupays I, Marbaix P, Messager C, Ramel R, Lebel T. 2004. A high-resolution simulation of a West African rainy season using a regional climate model. J. Geophys. Res. 109: D05108, doi: 10.1029/2003JD004020. Gellens D. 2000. Trend and correlation analysis of k-Day extreme
precipitation over Belgium. Theor. Appl. Climatol. 66(1–2): 117–129, doi: 10.1007/s007040070037.
Hamdi R, Vyver H, Troch R, Termonia P. 2014. Assessment of three dynamical urban climate downscaling methods: Brussels’s future urban heat island under an A1B emission scenario. Int. J. Climatol. 34(4): 978–999, doi: 10.1002/joc.3734.
Hazenberg P, Leijnse H, Uijlenhoet R, Delobbe L. 2008. Hydrological modeling of the Ourthe catchment using both radar and raingauge data. In Proceedings of the International Symposium on Weather Radar and
Hydrology, Grenoble, France, 10–15 March 2008.
Hurrell JW. 1995. Decadal trends in the North Atlantic Oscillation: regional temperatures and precipitation. Science 269(5224): 676–679. Joyce, A. E. (2006). The coastal temperature network and ferry route programme: long-term temperature and salinity observations. Science
Data Report No. 43. Centre for Environment Fisheries and
Aquacul-ture Science (CEFAS): Lowestoft, UK, 129 pp. https://www.cefas.co .uk/publications/files/datarep43.pdf (accessed 1 May 2016). Judson A, Doesken N. 2000. Density of freshly fallen snow in the central
Rocky Mountains. Bull. Am. Meteorol. Soc. 81(7): 1577–1587, doi: 10.1175/1520-0477(2000)081<1577:DOFFSI>2.3.CO;2.
Kalnay E, Kanamitsu M, Kistler R, Collins W, Deaven D, Gandin L, Iredell M, Saha S, White G, Woollen J, Zhu Y, Leetmaa A, Reynolds B, Chelliah M, Ebisuzaki W, Higgins W, Janowiak J, Mo K, Ropelewski C, Wang J, Jenne R, Joseph D. 1996. The NCEP/NCAR 40-year reanalysis project. Bull. Am. Meteorol. Soc. 77: 437–471, doi: 10.1175/1520-0477(1996)077<0437:TNYRP>2.0.CO;2.
Kay AL. 2016. A review of snow in Britain: the historical picture and future projections. Prog. Phys. Geogr. : 1–23, doi: 10.1177/03091333 16650617.
Kay AL, Rudd AC, Davies HN, Kendon EJ, Jones RG. 2015. Use of a very high resolution climate model data for hydrological modelling: baseline performance and future flood changes. Climate Change 133(2): 193–208, doi: 10.1007/s10584-015-1455-6.