HAL Id: hal-02409435
https://hal.archives-ouvertes.fr/hal-02409435
Submitted on 26 Nov 2020Electronic Stark Effect in Isolated Ion Pairs
Jeremy Donon, Sana Habka, Vanesa Vaquero-Vara, Valerie Brenner, Michel
Mons, Eric Gloaguen
To cite this version:
Jeremy Donon, Sana Habka, Vanesa Vaquero-Vara, Valerie Brenner, Michel Mons, et al.. Electronic Stark Effect in Isolated Ion Pairs. Journal of Physical Chemistry Letters, American Chemical Society, 2019, 10 (23), pp.7458-7462. �10.1021/acs.jpclett.9b02675�. �hal-02409435�
Electronic Stark Effect in Isolated Ion Pairs
Jeremy Donon,a Sana Habka,a Vanesa Vaquero-Vara,a Valérie Brenner,a Michel Mons,a Eric Gloaguena,*
aLIDYL, CEA, CNRS, Université Paris Saclay; CEA Saclay, Bât 522, 91191 Gif-sur-Yvette,
France.
AUTHOR INFORMATION
Corresponding Author
ABSTRACT Stark spectral shifts of a molecular probe are commonly used to estimate the local
electric field in condensed media. The very large fields reported, typically in the 0.1-10 GV m-1 range, are however difficult to reproduce in a controlled manner, limiting the calibration of these
molecular probes to ranges below 0.1 GV m-1. In this context, we investigated gas phase, isolated, molecular ion pairs, where a phenyl ring is immersed in the electric field produced by
the nearby ionic groups. The intensity of the electric field is chemically tuned in the 1 GV m-1 range by changing the nature of the cations, and the phenyl ring response is monitored by UV
spectroscopy. A quadratic Stark effect is observed, demonstrating the possibility to characterize
molecular probes in a solvent-free environment and in the very large field range they typically
meet in condensed media such as biological environments.
The Stark effect refers to the modification of the spectroscopy of a molecular system when it is
immersed in an external electric field.1 This effect is at the origin of Stark spectroscopy which consists in applying an external electric field to a sample, either in gas or condensed phases, and
monitoring the resulting spectral changes (shifts, broadening...).1 More generally, any molecular system surrounded by an environment that generates an electric field (e.g. solvent, solutes) is
subject to Stark effects. For example, Stark effects on electronic transitions (or electronic Stark
effect, ESE) are useful to rationalize the photophysics of UV-Vis chromophores, including
fluorescent proteins,2-3 or polyenes.4 ESE can be recorded, for instance, to follow charge migration processes such as in photosynthesis1 or ion pair formation,5 or to design fluorescence sensors based on electrochromism.6 In turn, Stark effects can also be used to measure the electric field at the particular location of a molecular probe by simply recording its spectroscopy.
Although ESE is appropriate for this application, the vibrational Stark effect (VSE), i.e. the shift
of vibrational transitions of a molecular probe subject to an electric field, is useful to measure the
local electric field in the vicinity of the vibrational probe in complex environments,7 provided that a calibration of the probe enables to translate the vibrational frequency into an electric field.8 This strategy presents the outmost advantage to convert vibrational frequencies, which are
difficult to calculate precisely, into local electric field values, which can be computed more
easily.9 Being sensitive to ligand binding, amino acid mutation, catalysis or charge transfer, VSE is of interest for many biological issues.1, 9-10 VSE is also useful to rationalize solvatochromism9 or characterize ionic liquids.11 In summary, Stark effects provide a convenient way to detect and measure the electric fields in condensed media, where values in the 0.1-10 GV m-1 range typically lead to measurable shifts of ~1-100 cm-1.9 However, such high electric fields are difficult to reproduce experimentally in a controlled manner, hindering the characterization of
VSE or ESE, and thus the calibration of molecular probes in the GV m-1 range. Indeed, ~0.1 GV m-1 is the highest achievable electric field produced by a capacitor-based experiment,1,
8-9 and investigations of higher ranges thus require an alternative experimental approach.
In this context, we report here the UV spectra (Fig. 1) of a series of isolated ion pairs based on
the phenylacetate (PA-) anion, namely (Na+, PA-), (K+, PA-), (Rb+, PA-) and (Cs+, PA-) (Fig. 2 left) obtained by resonant two-photon ionization (R2PI), together with that of phenylacetic acid
(PAA), and that of (Li+, PA-) already published.12 These systems will be referred to as the MPA series with M = H–Cs in the rest of this article. R2PI-UV spectra of the ion pairs (Fig. 1) all
consists of one main transition, revealing that the conformational distributions of these systems
are dominated by a single conformer, identified by conformer-selective IR spectroscopy and
frequency calculations at the DFT-D level13 (Fig. 2 left and Fig. S1). Large red-shifts (up to ~350 cm-1) are observed when going down the group of alkali atoms (Fig. 1), which reveals the high sensitivity of the * electronic transition to the nature of the alkali cation. This large red-shift may seem paradoxical since the phenyl ring is free of any contact. In other words, an
intramolecular solvation of the phenyl ring, e.g. through a cation-π interaction,12 cannot be invoked to explain such a shift,and is not considered further. However, the phenyl group lies in
close proximity of the strong dipole, and higher-order multipoles, formed by the cation and the
carboxylate group. The cation-anion distance increasing from Li to Cs, the phenyl ring is then
plunged into an increasing electric field that is potentially strong enough to polarize the phenyl
Figure 1. Gas phase R2PI-UV spectra of (M+, PA-) isolated ion pairs for M = Li–Cs. The UV
spectrum of phenyl acetic acid (PAA) is also shown (see also section S2).
In order to support this interpretation, and by analogy with a Stark spectroscopy experiment
where a molecule experiences an external electric field, one needs here to consider the electric
field E at the phenyl chromophore location produced by the rest of the ion pair, and then
compare it to the variations of the * electronic transition along the MPA series. E is then defined as the field produced by the (-CH2-COOM) moiety of the MPA systems. In order to
estimate E, one needs to rely on high level quantum chemistry calculations capable to faithfully
reproduce the structure of the system. Although the RI-B97-D3/dhf-TZVPP level14-15 has proven to quantatively reproduce gas phase IR spectra of flexible systems,13 making it a reliable method to describe the molecular structure, the electric field E appeared to be very sensitive to the
position of the cation relatively to the carboxylate group (see below). This is the reason why, the
and further partially optimized at the BSSE-corrected-Full-RI-CCSD(T)/dhf-TZVPP level
(Fig. S1).15-19 Then, the electric field produced by the (CH
2-COOM) radical (Erad) in the same
geometry as the (-CH2-COOM) moiety in MPA was calculated at the B97-D3/def2-QZVPP14, 20
level in the region occupied by the phenyl ring (Fig. 2 right). A natural bond orbital (NBO)
analysis21 conducted at the same level (Fig. 2, Tables S1 and S2) shows that the charge distribution of the radical is very similar to that of the (-CH2-COOM) moiety in the MPA series,
supporting that Erad can be a good approximation of E. ||Erad|| has been calculated at the center
of the ring as well as at the location of each carbon atom of the phenyl ring (Table 1). At large
distances, the radical is equivalent to an electric dipole, which increases from H to Cs (Fig. S2).
An increase of ||Erad|| is indeed observed at all locations but the Cipso one. This case aside, ||Erad||
is of the order of a few GV m-1, and is slightly decreasing from Cortho to Cpara reflecting the
inhomogeneous field experienced by the phenyl group. The specific case of Cipso, however, can
be explained by considering the edge effects intrinsic to its proximity with the radical moiety,
and the value of E at this location is expected to strongly depend on the model used for its
estimation. For this reason, the ||Erad|| value calculated at Cipso is thus considered meaningless for
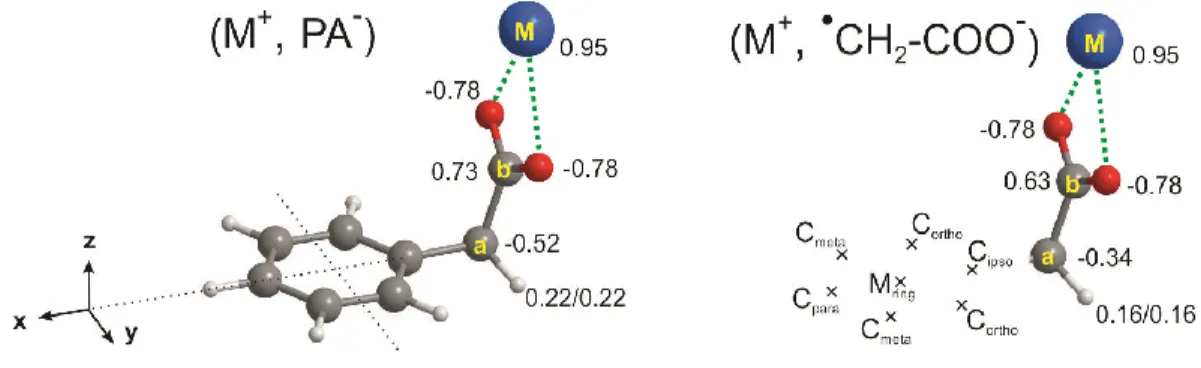
Figure 2. Charge distributions obtained by a NBO analysis conducted at the
B97-D3/def2-QZVPP level on the BSSE-corrected-Full-RI-CCSD(T)/dhf-TZVPP partially optimized
geometry (see text and Fig. S1) of (M+, PA-) (left) and the (CH
2-COO-, M+) radical (right)
frozen in the same geometry as the (-CH2-COO-, M+) moiety of the (M+, PA-) ion pair for M=K.
The electric field generated by the radical was calculated at the locations where each carbon
atom (Cipso, Cortho, Cmeta, Cpara) and the center (Mring) of the phenyl ring would lie in the (M+, PA-)
system (Table 1).
Table 1 ||Erad||, the norm of the electric field generated by the (CH2-COOM) radical (see text),
in GV m-1 for M = H–Cs at the locations described in Fig. 2 right, calculated at the
B97-D3/def2-QZVPP level. M H Li Na K Rb Cs Cipso 19.0 15.9 14.2 12.9 12.6 12.2 Cortho 0.6/0.7a 1.9 3.0 3.9 4.0 4.1 Mring 0.3 1.7 2.6 3.3 3.4 3.5 Cmeta 0.2/0.3 a 1.1 1.7 2.1 2.1 2.1 Cpara 0.2 0.8 1.3 1.6 1.6 1.6
a For asymmetry reasons, both corresponding locations are not equivalent, leading to two different values.
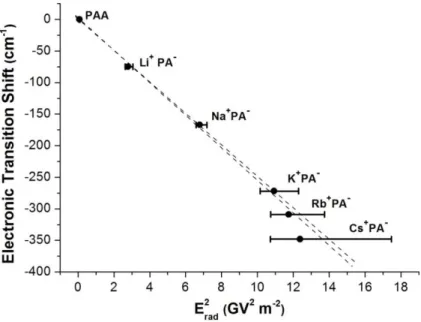
Figure 3. Electronic shift as a function of the square of the electric field produced by the (CH
2
-COOM) radical (Erad) at the center of the phenyl ring, Mring (see Fig. 2), for M=H-Cs. Error bars
reflect the potential error on Erad due to the uncertainty on the structure (see text and section S6).
Two dashed lines show the extreme linear fits compatible with these data.
Figure 3 shows the shift of the electronic transition as a function of Erad2 calculated at Mring for
each system. The good correlation supports indeed the assignment of the electronic shift to a
quadratic ESE. Similarly good correlations are observed when Erad is considered at the Cortho,
Cmeta and Cpara locations (Fig. S3). Analysis of the
BSSE-corrected-Full-RI-CCSD(T)/dhf-TZVPP potential energy surface of the (M+, PA-) ion pairs reveals a rather flat surface along two intermolecular coordinates, the CbM distance and the CaCbM angle (Fig. 2), especially for the
order to estimate the sensitivity of Erad to structure calculation errors (Section S6). The results,
presented as error bars in Figure 3, demonstrate that the corresponding uncertainty on the
calculated electric field can be of the order of ~10-20% for the largest cations. In this context, the
deviation from the straight line seen in Figure 3 for the M = Rb and Cs is not significant, i.e. the
whole data are consistent with a pure quadratic Stark effect experienced by the phenyl group
along the MPA series for M = H‒Cs.
According to the classical treatment of the Stark effect,1, 22 the Stark shift in frequency () of a molecular transition induced by a homogeneous electric field E can be described by power series
expansions in E, as shown by equation (1) up to the second order:
(1)
where h is the Planck's constant, is the difference between the dipole moments of the excited (') and the ground () states of the molecular probe, and is the difference between the polarizability tensors of its excited (') and ground () states. Considering that Erad is largely
aligned with the x axis for all the ion pairs investigated (Table S5), equation (1) can be limited to
its components involving the x axis only:
(2)
A pure quadratic ESE is then expected if x=0, and was already observed for the S0S1
excitation of isolated benzene molecules in the 0 – 25 MV m-1 range.23 In the case of the phenyl
ring, x is non-zero for asymmetry reasons,but is probably weak due to the fact that the phenyl
excitation. This view is supported by RI-CC2/cc-pVTZ calculations of for ethylbenzene, taken as a model molecule: with =0.05 D, the contribution of the linear term of eq. 1 would then be ~2 cm-1 every 1 GV m-1, which is indeed negligible compared to the shifts observed (Fig. 3). In conclusion, it is legitimate to consider the electronic shift as resulting mainly from a
quadratic Stark effect. Other effects such as a linear Stark effect or a remote solvation of the phenyl ring by the cation (see above) also contribute to the shift in a very minor way, and could
be involved in the apparent deviation seen on Figure 3 for the largest cations. However, the
uncertainty on the calculated electric fields (error bars) does not allow us to assert the existence
of this deviation.
The slope of the fit of Figure 3 thus corresponds to -xx/2, leading to a value of 10.1 ± 0.2 10-40
J m2 V-2 (or C2 m2 J-1) for xx of the phenyl ring. Literature provides very few data that can be
compared to this measurement. In the gas phase, xx was measured for isolated benzene
molecules23 (xxyy = 0.3 10-40 and zz = 2.5 10-40 J m2 V-2), and appears very different
from that of the phenyl ring. However, the same study shows that xx becomes the strongest
component of in isolated naphtalene molecules (4.1 10-40 , 0.2 10-40 and 0.3 10-40 J m2 V-2 for
xx, yy and zz respectively). In the condensed phase, , defined as (xx + yy +
zz)/3, was also obtained for toluene24 (2.9 ± 2.3 10-40 J m2 V-2) from solvatochromic
measurements in n-alkanes. Considering that xx is likely to be the strongest component of
complicating the comparison between both systems. Another aspect to keep in mind is the
inhomogeneity of the electric field in which the phenyl ring is immersed in our experiment.
Fig. S2 shows indeed that the field varies by a factor ~2 between Mring and Cpara. However, the
theoretical model employed above assumes a homogeneous field, and should be adapted to
inhomogeneous cases in order to make this approach more quantitative. In addition, independent
measurements of xx of phenyl rings would be desirable for comparison purposes, in order to
evaluate to what extent the approach followed in this work can be considered as quantitative.
Finally, the same analysis carried out on the more affordable RI-B97-D3/dhf-QZVPP optimized
geometries instead of the BSSE-corrected-Full-RI-CCSD(T)/dhf-TZVPP ones lead to similar
values of xx (10.7 10-40 J m2 V-2), making the theoretical approach applicable to larger
systems.
In conclusion, we demonstrated that isolated ion pairs can be used to investigate the electronic
response of a phenyl ring immersed in very large electric fields in the 0.2 - 4 GV m-1 range. This approach has several advantages: (i) it enables the exploration of a range of electric fields
typically encountered in many applications, but difficult to reproduce in a controlled
capacitor-based experiment, where 0.1 GV m-1 is considered as the maximum field achievable; (ii) the electric field has a fixed orientation relative to the molecule, greatly facilitating the interpretation
of the results ; (iii) the experiment is carried out in the gas phase where the intrinsic properties of
the probed system can be investigated, and direct comparison with theoretical data is possible.
From an ideal Stark spectroscopy experiment perspective, the inhomogeneity of the field can be
viewed as a drawback of this approach, but could also be seen as an opportunity to test a probe
intended to be used in inhomogeneous environments. In addition, despite this inhomogeneity,
extensions of this work to other systems can be anticipated in a near future, including, for
instance, the characterization and the calibration at very large fields of both VSE and ESE of
p-cyanophenylalanine probes,10 which are a prototypical example of the current refinements used to measure the local electric field in a protein.
Experimental and Computational Methods.
Experimentally, R2PI-UV spectra were recorded in a pulsed molecular beam experiment (10 Hz)
described elsewhere,25 where a 7:3 He:Ne mixture at 18 bar was used as a carrier gas, and a laser-desorption setup was used to vaporized the sample made of the desired system mixed with
graphite.12 R2PI spectra were recorded by scanning the wavelength of a 500 J UV laser pulse in the spectral region of the first * state of the phenyl ring, and by monitoring the mass-selected ion signal with a reflectron time-of-flight mass spectrometer.
Theoretically, geometry optimizations, NBO analyses, harmonic frequency and electric field
ASSOCIATED CONTENT
Supporting Information. SI contains the set of optimized structures resulting from geometry
optimization (S1); Additional comments on UV spectroscopy (S2) ; NBO charges (S3) ; the
||Erad|| profile along the x axis (S4) ; Correlations between the electronic shift and ||Erad|| at
several locations (S5) ; ||Erad|| calculations at the center of the phenyl ring for different
geometries (S6).
AUTHOR INFORMATION
Contact: [email protected]
The authors declare no competing financial interests.
ACKNOWLEDGMENT
EG acknowledges the work of undergraduate students A. Ghandri, S. Goursaud, S. Bourg and
S. de Lima-Barbosa. EG gratefully thanks ANR (grant ANR-16-CE29-0017), GENCI-TGCC
(projects A0050807524 and p615) and Labex PALM (ANR-10-LABX-0039-PALM) for their
support.
REFERENCES
(1) Boxer, S. G. Stark Realities. J. Phys. Chem. B 2009, 113, 2972-2983.
(2) Drobizhev, M.; Tillo, S.; Makarov, N. S.; Hughes, T. E.; Rebane, A. Color Hues in Red Fluorescent Proteins Are Due to Internal Quadratic Stark Effect. J. Phys. Chem. B 2009, 113, 12860-12864.
(3) Chattoraj, M.; King, B. A.; Bublitz, G. U.; Boxer, S. G. Ultra-Fast Excited State Dynamics in Green Fluorescent Protein: Multiple States and Proton Transfer. Proc. Natl. Acad.
Sci. U. S. A. 1996, 93, 8362-8367.
(4) Premvardhan, L. L.; Wachsmann-Hogiu, S.; Peteanu, L. A.; Yaron, D. J.; Wang, P. C.; Wang, W.; MacDiarmid, A. G. Conformational Effects on Optical Charge Transfer in the Emeraldine Base Form of Polyaniline from Electroabsorption Measurements and Semiempirical Calculations. J. Chem. Phys. 2001, 115, 4359-4366.
(5) Westerlund, F.; Elm, J.; Lykkebo, J.; Carlsson, N.; Thyrhaug, E.; Akerman, B.;
Sorensen, T. J.; Mikkelsen, K. V.; Laursen, B. W. Direct Probing of Ion Pair Formation Using a Symmetric Triangulenium Dye. Photochem. Photobiol. Sci. 2011, 10, 1963-1973.
(6) Klymchenko, A. S.; Demchenko, A. P. Electrochromic Modulation of Excited-State Intramolecular Proton Transfer: The New Principle in Design of Fluorescence Sensors. J. Am.
Chem. Soc. 2002, 124, 12372-12379.
(7) Suydam, I. T.; Snow, C. D.; Pande, V. S.; Boxer, S. G. Electric Fields at the Active Site of an Enzyme: Direct Comparison of Experiment with Theory. Science 2006, 313, 200-204.
(8) Suydam, I. T.; Boxer, S. G. Vibrational Stark Effects Calibrate the Sensitivity of Vibrational Probes for Electric Fields in Proteins. Biochemistry 2003, 42, 12050-12055.
(9) Fried, S. D.; Boxer, S. G. Measuring Electric Fields and Noncovalent Interactions Using the Vibrational Stark Effect. Acc. Chem. Res. 2015, 48, 998-1006.
(10) Slocum, J. D.; Webb, L. J. Measuring Electric Fields in Biological Matter Using the Vibrational Stark Effect of Nitrile Probes. Annu. Rev. Phys. Chem. 2018, 69, 253-271.
(13) Habka, S.; Very, T.; Donon, J.; Vaquero-Vara, V.; Tardivel, B.; Charnay-Pouget, F.; Mons, M.; Aitken, D. J.; Brenner, V.; Gloaguen, E. Identification of Ion Pairs in Solution by Ir Spectroscopy: Crucial Contributions of Gas Phase Data and Simulations. Phys. Chem. Chem.
Phys. 2019, 21, 12798-12805.
(14) Grimme, S.; Antony, J.; Ehrlich, S.; Krieg, H. A Consistent and Accurate Ab Initio Parametrization of Density Functional Dispersion Correction (Dft-D) for the 94 Elements H-Pu.
J. Chem. Phys. 2010, 132, 19.
(15) Schäfer, A.; Huber, C.; Ahlrichs, R. Fully Optimized Contracted Gaussian-Basis Sets of Triple Zeta Valence Quality for Atoms Li to Kr. J. Chem. Phys. 1994, 100, 5829-5835.
(16) Boys, S. F.; Bernardi, F. Calculation of Small Molecular Interactions by Differences of Separate Total Energies - Some Procedures with Reduced Errors. Mol. Phys. 1970, 19, 553-566.
(17) Raghavachari, K.; Trucks, G. W.; Pople, J. A.; Headgordon, M. A Fifth-Order Perturbation Comparison of Electron Correlation Theories. Chem. Phys. Lett. 1989, 157, 479-483.
(18) Weigend, F.; Häser, M.; Patzelt, H.; Ahlrichs, R. Ri-Mp2: Optimized Auxiliary Basis Sets and Demonstration of Efficiency. Chem. Phys. Lett. 1998, 294, 143-152.
(19) Weigend, F.; Baldes, A. Segmented Contracted Basis Sets for One- and Two-Component Dirac-Fock Effective Core Potentials. J. Chem. Phys. 2010, 133, 174102.
(20) Rappoport, D.; Furche, F. Property-Optimized Gaussian Basis Sets for Molecular Response Calculations. J. Chem. Phys. 2010, 133.
(21) Reed, A. E.; Curtiss, L. A.; Weinhold, F. Intermolecular Interactions from a Natural Bond Orbital, Donor-Acceptor Viewpoint. Chem. Rev. 1988, 88, 899-926.
(22) Wagie, H. E.; Woehl, J. C.; Geissinger, P. A Systematic, Quantum-Mechanical, Finite-Order Approach for the Quantitative Determination of Molecular Internal Electric Fields
(23) Okruss, M.; Muller, R.; Hese, A. High-Resolution Ultraviolet Laser Spectroscopy on Jet-Cooled Benzene Molecules: Ground and Excited Electronic State Polarizabilities Determined from Static Stark Effect Measurements. J. Chem. Phys. 1999, 110, 10393-10402.
(24) Renge, I. On the Determination of Molecular Polarizability Changes Upon Electronic Excitation from the Solvent Shifts of Absorption-Band Maxima. Chem. Phys. 1992, 167, 173-184.
(25) Gloaguen, E.; Valdes, H.; Pagliarulo, F.; Pollet, R.; Tardivel, B.; Hobza, P.; Piuzzi, F.; Mons, M. Experimental and Theoretical Investigation of the Aromatic-Aromatic Interaction in Isolated Capped Dipeptides. J. Phys. Chem. A 2010, 114, 2973-2982.
(26) Turbomole V7.2 2017, a Development of University of Karlsruhe and
Forschungszentrum Karlsruhe Gmbh, 1989-2007, Turbomole Gmbh, since 2007; Available from Http://Www.Turbomole.Com, Accessed Oct 2019.