Science Arts & Métiers (SAM)
is an open access repository that collects the work of Arts et Métiers Institute of
Technology researchers and makes it freely available over the web where possible.
This is an author-deposited version published in:
https://sam.ensam.eu
Handle ID: .
http://hdl.handle.net/10985/9417
To cite this version :
Juan Sebastian CASALLAS, James H. OLIVER, Jonathan W. KELLY, Frédéric MERIENNE,
Samir GARBAYA - Using relative head and hand-target features to predict intention in 3D
moving-target selection - In: IEEE Virtual Reality, Etats-Unis, 2014-03-29 - IEEE Virtual Reality - 2014
Any correspondence concerning this service should be sent to the repository
Administrator :
[email protected]
Using Relative Head and Hand–Target Features to Predict Intention in 3D
Moving-Target Selection
Juan Sebasti ´an Casallas∗
Iowa State University Arts et M ´etiers ParisTech
James H. Oliver†
Virtual Reality Applications Center Iowa State University
Jonathan W. Kelly‡
Department of Psychology Iowa State University
Fr ´ed ´eric Merienne§ Institut Image Arts et M ´etiers ParisTech
Samir Garbaya¶ Institut Image Arts et M ´etiers ParisTech
ABSTRACT
Selection of moving targets is a common, yet complex task in hu-man–computer interaction (HCI) and virtual reality (VR). Predict-ing user intention may be beneficial to address the challenges inher-ent in interaction techniques for moving-target selection. This arti-cle extends previous models by integrating relative head-target and hand-target features to predict intended moving targets. The fea-tures are calculated in a time window ending at roughly two-thirds of the total target selection time and evaluated using decision trees. With two targets, this model is able to predict user choice with up to ∼ 72% accuracy on general moving-target selection tasks and up to ∼ 78% by also including task-related target properties.
Index Terms: H.5.2 [Information interfaces and presentation]: User Interfaces—Interaction Styles, Theory and methods. I.3.7 [Computer Graphics]: Three-Dimensional Graphics and Realism— Virtual Reality. I.5.4 [Pattern Recognition]: Applications.—
1 INTRODUCTION
Selection of moving targets is a common manipulation in hu-man–computer interaction (HCI) and more specifically in virtual reality (VR). Targets may move autonomously, as in interactive video [12, 14, 36] or air traffic control displays [12, 22], and, as pointed by Mould and Gutwin [22], targets may move with respect to the user, like in VR or Augmented Reality navigation [41]. In some applications, including video games [22, 31] and interactive 3D simulations [12, 22], both kinds of movements are present.
In spite of the many applications of moving-target selection, HCI and VR studies have largely focused on static-target selection. In the seminal book for 3D User Interfaces (3DUI) [3], a taxonomy for 3D manipulation (itself based on a previous 2D taxonomy [8]) is presented, in which none of the canonical tasks—Selection, Po-sitioning and Rotation—include target motion among their parame-ters. This example is, perhaps, reflective of the numerous HCI stud-ies on static selection based on Fitts’ Law [7] (for a compendium, see, for example [10]), which continues to be “extended” and dis-puted [35].
Recently, however, new performance models [1] and interaction techniques [12, 29, 41] have been proposed to address the speci-ficities of moving-target selection. Interestingly, these models and interaction techniques are inspired or derived on their static Fitts’ counterparts. ∗e-mail: [email protected] †e-mail:[email protected] ‡e-mail:[email protected] §e-mail:[email protected] ¶e-mail:[email protected]
Moving-target selection poses special challenges compared to static selection. The nature of the task requires the user to con-tinually and simultaneously track targets and plan to reach for them [12], even if the targets’ motions may be unpredictable [12, 14, 29, 31, 41]. Furthermore, common HCI challenges, such as end-to-end latency, are exacerbated in moving-target selection [31]. In general, moving-target selection techniques, such as Comet and Ghost [12], enhance pointing by expanding selectable targets or creating easier-to-reach proxies for each target, respectively. Never-theless, these techniques may suffer from clutter and overlap when the number of selectable objects is increased [12]. A possible solu-tion to these limitasolu-tions, also present in static selecsolu-tion, is to predict the intended targets [12, 20]. Unfortunately, to the authors’ knowl-edge, most predictive techniques are tailored toward static-target selection, except for [5, 29].
Based on the promising results of using target size [5] and dis-tance [29] to predict intended moving-targets, the present work ex-plores the integration of head pose with target size and distance to generate a new moving-target predictive model. Due to the inherent visuomotor nature of moving-target selection, it is expected that this model will outperform the existing predictive models. The scope of this work, however, is limited to the simple, two-target-with-linear-trajectory selection task from [5]. The data from [5] is reevaluated and its predictive model, together with the one from [29] are used as a baseline for the new, proposed model.
2 RELATED WORK
2.1 Predictive techniques
Predicting intended targets has been proposed as a solution to clut-ter and overlap in target selection techniques. Current static-target prediction techniques are based on the trajectory and velocity profiles of the pointer [19, 20, 28, 40]. The peak accuracy rates for prediction using these techniques require a wide window of user input—at least 80% of the pointing movement—but some of them are intended to predict endpoints [19, 40], rather than intended targets [20, 28]. These techniques, however, are not adapted for moving-target prediction, in particular due to the apparent depen-dency of the users’ velocity profiles on the targets’ movement [4].
The studies from de Haan et al. [6] and Ortega [29] have demon-strated the feasibility of predicting intended moving-targets in com-plex VR scenes. Their predictive model assigns a score to each tar-get during execution based on their angular and euclidean distance from the virtual pointer, respectively.
These functions are easy to implement and their scoring is en-hanced as the user follows each target with the pointer; however, as it happens with the task in the present work, users may not always be following the intended target with their pointer. Additionally, there is no concrete data on the predictive accuracy (i.e., the per-centage of correctly predicted targets) of such functions, or how such accuracy is affected by the target distance—it is possible that users may have made their decision before starting their pointer movement, so the prediction could be done in advance.
Taking this idea to the extreme, Casallas and colleagues [5] for-mulated a moving-target prediction technique based only on the initial physical states of both the user and the targets. With two targets, their model predicts user choice with approximately 71% accuracy. However, since targets changed only in size and position, this prediction technique is not generalizable to targets with other, or, additional parameters.
Expanding on the work from [5], the present work introduces rel-ative head-target and hand-target features calculated during a time window, to predict intended target. These features can be general-izable to different moving-target selection tasks. Ortega’s scoring function is used as a baseline to validate the predictive accuracy of these features.
Additionally, these features are integrated with the previous initial-target-state model [5] to demonstrate enhanced predictive performance.
2.2 Gaze
Knowing where a person is looking is considered as an indicator of what is at the “top of the stack” of a cognitive process [17]. With respect to object manipulation, research has shown that gaze leads hand (or effector) motions [15]. Gaze is composed of head orienta-tion and eye orientaorienta-tion relative to the head [39].
In the context of target selection, eye gaze has proven to be ben-eficial in assisting users during static-target selection tasks, con-currently with “traditional” input, such as a mouse [2, 42]. Eye-trackers, however, are expensive and may be technically challeng-ing to integrate in CAVE-like immersive VR systems [23], like the one in this experiment. Furthermore, this integration may be cum-bersome, due to the complex calibration procedures required or the cabling limitations of certain eye trackers [23]. Some modern so-lutions address these problems and allow eye-tracking in VR, but their adoption is still limited and costly.
Head tracking, on the other hand, is readily available in most CAVE-like systems and has been successfully integrated in large-display [24], video-conference [38], mobile [37], surface [9] and floor-projected [32] interactive systems. In a real-life scenario, Stiefelhagen and Zhu [38] showed that head orientation contributed 68.9% to the overall gaze direction and could estimate attention focus with 88.7% accuracy. Additionally, Nickel and Stiefelha-gen [25] demonstrated that head orientation was a good estimate of pointing direction, with 75% accuracy.
3 METHODS
The methods described in this section are the same as those from [5].
3.1 Participants
Twenty-six unpaid participants—18 males and 8 females—were re-cruited for the experiment. Their ages ranged from 23 to 47 years old (mean 30.8, median 29); two of them were left handed.
3.2 Apparatus
The experimental application was developed in VR Jugglua [30] and deployed in a 3 × 3 × 2.67 m, 4-sided—left, front, right, and floor—CAVE-like environment. Each face was projected with 1160 × 1050 pixels, passive Infitec [16] stereo. Each participant’s head and wand were tracked using reflective markers mounted on Infitec glasses and an ART Flystick2, respectively, using four ART cameras.
3.2.1 Coordinate system
A y-up coordinate system was used, with its origin placed in the middle of the virtual environment at ground level, z decreasing to-wards the front wall, and x increasing toto-wards the right wall.
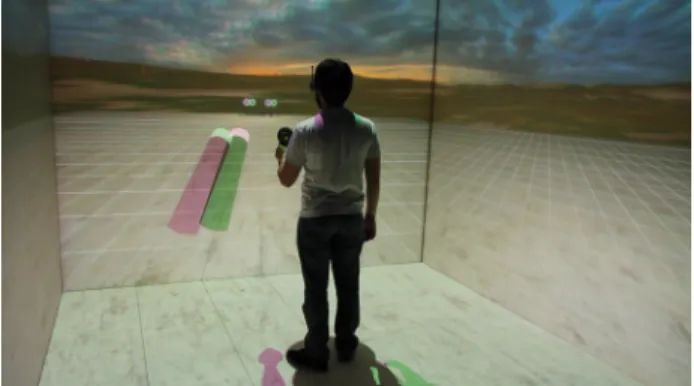
Figure 1: Experimental setup with an array of two spheres
3.3 Procedure
After filling a small survey, each participant was asked to stand on a circular landmark (r = 0.25 m) placed at (0, 0, 0), facing the front wall, and complete a series of target reaching tasks. In each trial, a horizontal array of spherical targets would appear in front of the participant and start moving towards him in z. In order to avoid distracting the participant from the primary task of undirected target selection, targets only varied in radius and position; a single texture was used for all targets, scaled according to their radius.
The participant was instructed to touch each of the targets be-fore it got past his head, by extending his arms to reach each target, without stepping out of the landmark. Each target would disappear after being touched by the participant or getting 0.5 m past the par-ticipant’s head in z. Once all spheres disappeared, the trial would end.
To motivate each participant and indicate his performance, visual and auditory feedback were used. Whenever a target was touched, a sound would be played at the target’s center; when one or more targets got past the participant, a different sound would be played, co-localized with the overall centroid of the remaining targets. Ad-ditionally, the number of missed targets was displayed on a virtual counter placed at ground level, 5 m in front of the participant; the counter was reset to zero at the start of each block of trials.
During each trial, at each frame of the application, the elapsed time (t), head pose (Ph, Qh), wand pose (Pw, Qw), target positions
(Pi) and possible collisions between the wand and the targets were
recorded.
3.4 Design
A within-subjects factorial design was used, with two blocks of tri-als, Each block had a different number of conditions, each pre-sented in a random order. In each trial, spheres appeared 5 m in front of the participant, 0.3 m below his initial head position (Pi,y= Ph,y− 0.3, Pi,z= −5).
In the first block, one target per trial was presented. Factors were target radius (r1= [0.1, 0.2]), and target position (left: P1,x= −0.5,
center: P1,x= 0, and right: P1,x= 0.5); in every trial, the target
moved with a constant velocity of (0, 0, 2.5) m/s. There were five trials for each of the 6 conditions (30 total). This block was in-tended to familiarize the participant with the environment and the moving-target reaching task.
In the second block, two targets per trial were presented, sph1,
and sph2. Factors were target radius (ri= [0.1, 0.2]), and
target-pair position [left: (P1,x= −0.5, P2,x= 0), center: P1,x= −0.25,
P2,x= 0.25), and right: P1,x= 0, P2,x= 0.5)] (see Fig. 2); in every
trial, both targets moved concurrently with a constant velocity of (0, 0, 1.5) m/s. There were five trials for each of the 12 conditions (60 total).
Figure 2: Possible row positions: left, center and right, with respect to the user in the two-sphere block. Based on Fig. 2 from [5].
4 ANALYSIS
A between–subjects analysis was done, based on each of the per-formed trials. Trials in which participants did not touch any sphere were discarded. At each frame, measurements that could relate the target positions to the participant’s head pose (Ph, Qh) and wand
po-sition (Pw) were calculated. Posteriorly, the mean of these
measure-ments in a time window was computed and different feature–sets were evaluated to predict the intended sphere.
4.1 Relative user–target features
First, the head vector (~H) was calculated, based on the head orien-tation (Qh). For this, consider that the zero-rotation corresponds to
a person looking at (0, 0, −1), thus, to calculate ~H, the unit vector −ˆk must be rotated by the current head orientation1,
~
H= rotate(−ˆk, Qh) (1)
Next, the sphere positions in head coordinates (P1h,P2h) were
cal-culated,
Pih= Pi− Ph (2)
Subsequently, instead of calculating the angle between ~Hand P1h,
and between ~Hand P2h, the dot products between the normalized
vectors were calculated,
doti= ˆH· ˆPih (3)
The dot product (doti) has the advantage of being an easy to
in-terpret, normalized scalar: the closer it gets to 1, the more the user’s head orientation is aligned with sphi. Furthermore, since
the spheres are not overlapping in the user’s field of view, the dot-product difference was calculated,
∆dot = dot1− dot2 (4)
This quantity serves to determine the relative pose of the user’s head with respect to the spheres: the closer the quantity gets to 1, the more the user’s head is aligned with sph1; the closer the quantity
gets to -1, the more the user’s head is aligned with sph2—0 implies
that the user’s head is oriented right in the middle of both spheres. Finally, the wand–sphere distances (Di) were calculated, as
in [5], as well as a distance difference (∆D),
Di= |Pw− Pi| (5)
∆D = D1− D2 (6)
Similar to ∆dot, ∆D serves to determine the relative position of the user’s wand with respect to the spheres: a positive quantity im-plies that the wand is farther from sph1; a negative quantity
im-plies that the wand is farther from sph2—0 implies that the wand is
equidistant from both spheres.
1The rotate(~V, Q) function was implemented in R, based on OpenScene-Graph’s osg :: Quat :: operator∗(osg :: Vec3) method
4.1.1 Distance Score Feature
To validate the usefulness of the proposed features, their predictive accuracy is compared to the distance scoring function proposed by Ortega [29] Following his methodology, at each frame (t) of the application, each target is ordered ascendingly by distance, its or-der is given by j. The scores for each of the N closest targets are increased following,
dScorej(t) = dScorej(t − 1) + (N − j)∆t; i f ( j < N) (7)
where t − 1 is the previous frame and ∆t is the time elapsed be-tween t − 1 and t.
For the remaining targets, their scores are instead decreased fol-lowing,
dScorej(t) = dScorej(t − 1) − (0.9N)∆t; i f ( j ≥ N) (8)
dScorej(t) ≥ 0
Since the experimental environment was composed of two tar-gets, N = 1 is chosen, such that only the closest target’s score is increased. Note that the decay rate (0.9N) in Equation (8) is much higher than that of Ortega’s original formulation (N/2). This is be-cause the chosen task involved a big amount of time in which par-ticipants were waiting for the target to be reachable, so most of the movement happened late in the trial; therefore, a big decay rate was necessary to minimize the score inertia when starting the reaching motion.
4.2 Time-window selection
Due to the instability and inaccuracy of human movements [34] it is best to average the values for both ∆dot and ∆D in a time window, instead of using discrete values.
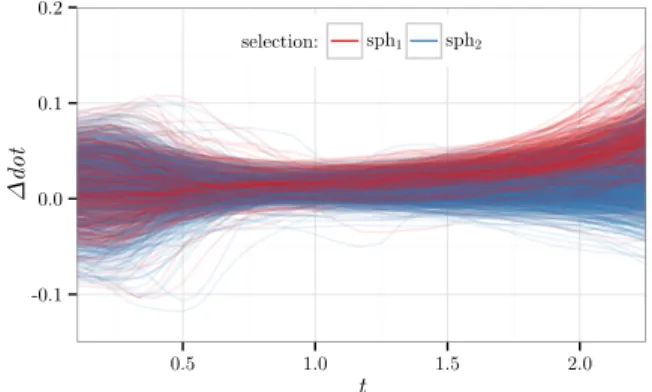
In interactive usage contexts, both the feature averaging and the scoring function start running upon user activation. Since the present analysis is done post-hoc, the functions are applied to the data during a graphically determined time window. Ideally, the time window would start before the beginning of the reaching action, while the user is specifying his intentions and actions [27], and end before the target is reached. In the scope of this study, the ∆dot profile was analyzed graphically over time, to determine an appro-priate window heuristically, as shown in Figure 3. Other possible approaches are discussed in the future work section.
-0.1 0.0 0.1 0.2 0.5 1.0 1.5 2.0 t Δ dot selection: sph1 sph2
Figure 3: ∆dot vs. time. Each line corresponds to a trial, colored according to the selected sphere. The graphic has been trimmed to the 5thpercentile of the selection times (2.35s).
Because there is no time between trials, the starting non-zero ∆dot values in Figure 3 are probably due to participants fixating
the last sphere they touched on the previous trial. The subsequent convergence towards zero, between 0 and 1 seconds suggests that their regard is shared between both spheres, probably while making their decision. After 1 second, ∆dot starts diverging again, sug-gesting that participants’ heads are oriented towards one of the two spheres; if this is the case, the increased divergence could be related to the increased separation of the spheres in the participant’s field of view, as they get closer to him. Furthermore, after one second, sphere 1 and 2 selection labels seem to be more clearly clustered above and below zero, respectively.
This graphical evidence suggests that roughly 1 second is a good start for the time window; based on that, 1.5 seconds was chosen empirically as the ending time for the window. These times roughly correspond to 42.5% and 63.8% of the 5thpercentile of the selection times (2.35s).
Within this window, both the mean dot product difference (∆dot) and the mean wand–target distance (∆D) were calculated. The dScorescoring function is also run through the time window. Based on its final score, each target i is ranked 0 or 1.
4.3 Evaluation
Feature-sets {∆dot}, {∆D}, {∆dot, ∆D}, {∆dot, r1, r2},
{∆D,r1,r2} and {∆dot, ∆D,r1,r2} were evaluated to predict the first
sphere selected by the user (sphi).
The results are compared to the accuracy of previous classifiers separately. Models generated from generalizable user–target fea-tures (i.e., the feature-sets 1–3) are compared to the scoring classi-fier bestDRank, which always predicts the chosen sphere as the one with the best dRank given by Equations (7) and (8).
In the case of target-based features (i.e., feature-sets 4–6), which are specific to this task, the baseline classifier is the decision tree generated from “best” features of [5], i.e. target radii, {r1,r2}.
Consistently with [5], all the feature-sets were evaluated using the J48 classifier (open source implementation of the C4.5 decision tree algorithm [33]) from the Weka machine-learning suite [11]. The classifier chooses its decision nodes recursively, based on the feature that yields the greatest Information Gain (a general overview of how the classifier works is given in [5]).
The advantage of this classifier is that it produces easy to in-terpret rules, choosing the simplest decision tree from the input attributes. Additionally, the C4.5 algorithm is robust to attribute errors, which may originate from noisy sensor readings. In this study’s scope, the decision trees allowed representation and analy-sis of the possible participant strategies to solve each task.
The performance of bestDRank is simply evaluated by calculat-ing the predictive accuracy, i.e. the proportion of correct predic-tions over the number of trials. The accuracy of each decision-tree classifier, on the other hand, is estimated using 10-fold cross vali-dation. According to Mitchell [21, p. 141], given that numTrials ≥ 30, the 95% Confidence Interval of the accuracy (acc) of each model can be approximated using
acc± z95
r
acc∗ (1 − acc)
numTrials (9)
5 RESULTS AND DISCUSSION
5.1 Generalizable moving-target features
As shown in Table 1, all feature-sets performed better than chance and a frequentist predictor2(∼ 64% ± 2.4%). In average, all of the proposed feature-sets performed better than the bestDRank baseline classifier, however, since all the confidence intervals overlap, it was necessary to do an additional test to verify whether or not these differences are significant. Based on Equation (5.13) from [21, p.
2A frequentist predictor always predicts the most frequent class, with an accuracy equivalent to the relative frequency of the class.
144] the 95% Confidence Interval for the difference between the accuracies of two classifiers is given by
(acca− accb) ± z95 r acca∗ (1 − acca) numTrials + accb∗ (1 − accb) numTrials (10) If the resulting interval does not contain 0, the null hypothesis that the accuracies are the same, should be rejected. Note, however, that all feature-sets are tested on the same trials, thus, the Confi-dence Intervals given by Equation (10) may be too conservative [21, p. 144]. Results are presented in Table 2.
Table 1: Tree size, number of leaves, accuracy and 95% confidence intervals for the evaluated generalizable moving-target feature-sets
Feature-set Size Leaves acc 95% CI bestDRank 1 1 68.09% [65.77%, 70.42%]
∆dot 3 2 70.69% [68.42%, 72.96%] ∆D 5 3 68.42% [66.10%, 70.74%] ∆dot, ∆D 11 6 71.72% [69.48%, 73.97%]
Table 2: Accuracy difference and 95% confidence intervals for the evaluated generalizable moving-target feature-sets. Asterisks (*) de-note a significant difference (α = 0.05).
Feature-seta Feature-setb ∆acc 95% CI bestDRank ∆dot 2.59% [−5.85%, 0.65%] bestDRank ∆dot, ∆d 3.63% [−6.87%, −0.40%]*
∆dot ∆dot, ∆D 1.04% [−2.16%, 4.23%] ∆D ∆dot, ∆D 3.31% [−6.54%, −0.08%]*
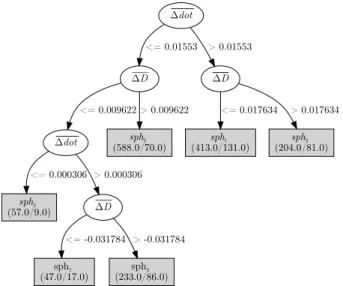
Even though the model generated using feature ∆dot did not prove to be significantly better than the model using ∆D, the lat-ter yielded less average accuracy with a more complex tree, making it less practical and perhaps over-fitted to the data [21, p. 67]. The combination of both features in feature-set {∆dot, ∆D}, however, yielded a significantly better result than the isolated ∆D feature. This model is presented in Figure 4.
∆dot ∆D <= 0.01553 ∆D > 0.01553 ∆dot <= 0.009622 sph2 (588.0/70.0) > 0.009622 sph2 (57.0/9.0) <= 0.000306 ∆D > 0.000306 sph1 (47.0/17.0) <= -0.031784 sph2 (233.0/86.0) > -0.031784 sph1 (413.0/131.0) <= 0.017634 sph2 (204.0/81.0) > 0.017634
Figure 4: Generated decision tree for feature-set {∆dot, ∆D}. The numbers in parenthesis within the leaves represent the total num-ber of instances that fall into that leaf, over the numnum-ber of incorrectly predicted instances among these instances.
The fact that feature-set {∆dot, ∆D} yielded the greatest aver-age accuracy, which was significantly better than both the baseline bestDRankand feature ∆D confirms the value of using head–target and wand–target relative features to predict intention in moving-target selection. As previously statede, this is probably due to the inherent visuomotor nature of the moving-target selection tasks, where users need to fixate on the chosen target while moving their hands towards them.
Due to the task and evaluation differences with previous work, the results are not directly comparable to the latter, but suggest a great potential of the presented approach. The time-window limits are likely to change according to the task (for example, if the user has to search for his intended target in a cluttered environment), but it may be possible to detect patterns similar to Figure 3 when the intended target is fixated upon, which is better than considering a large portion of the entire pointer trajectory. Furthermore, in other tasks the generated tree nodes will likely have different split values than those presented in Figure 4, although it is possible that these split values will also be close to zero in binary selection tasks.
Finally, using a single head–target relative parameter, such as ∆dot, and a single wand–target relative parameter, such as ∆D, may not be useful or viable in tasks with more and differently positioned targets. A solution could be to create similar features for every possible pair of targets.
5.2 Target-based features
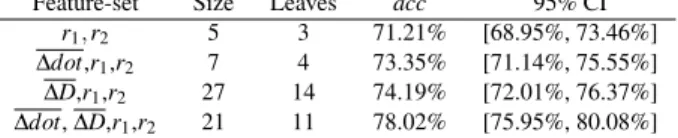
Tables 3 and 4 3 show that Feature-set {∆dot, ∆D,r1,r2} performed
significantly better than all of the other feature-sets, surpassing the baseline {r1, r2} average accuracy by almost 7%. Unfortunately,
the generated tree was too big (21 nodes) to fit in this paper. Surprisingly, and contrary to the results from the previous sec-tion, combining the ∆dot relative feature with the sphere radii (r1,r2) did not yield better accuracy than feature-set {∆D,r1,r2}.
The fact that feature-set {∆D,r1,r2} performed marginally
bet-ter than the baseline could be complementary to the hypothesis from [5], that suggests that a function of target size and distance can adequately predict the selected sphere in this type of task. In the results from Casallas and colleagues, however, the distance D0—measured at the beginning of each trial—was deemed to yield
less information gain than the sphere radii. The apparent increase in information gain by integrating ∆D, observed in the present work, reflects a correlation between wand and object position (as sug-gested by [29]), but only after a certain preparation time [26].
Table 3: Tree size, number of leaves, accuracy and 95% confidence intervals for the evaluated target-based feature-sets.
Feature-set Size Leaves acc 95% CI r1, r2 5 3 71.21% [68.95%, 73.46%] ∆dot,r1,r2 7 4 73.35% [71.14%, 75.55%] ∆D,r1,r2 27 14 74.19% [72.01%, 76.37%] ∆dot, ∆D,r1,r2 21 11 78.02% [75.95%, 80.08%]
Table 4: Accuracy difference and 95% confidence intervals for the target-based feature-sets. Asterisks (*) denote a significant differ-ence (α = 0.05), dots (.) denote a marginal differdiffer-ence (α = 0.1).
Feature-seta Feature-setb ∆acc 95% CI r1, r2 ∆dot, r1, r2 2.14% [−5.30%, 1.02%] r1, r2 ∆D, r1, r2 2.98% [−6.13%, 0.16%]. ∆dot, r1, r2 ∆D, r1, r2 0.84% [−3.95%, 2.26%] ∆D, r1, r2 ∆dot, ∆D,r1,r2 3.83% [−6.83%, −0.82%]∗
6 CONCLUSION ANDFUTUREWORK
The feasibility of integrating relative head–target and wand–target features (∆dot and ∆D, respectively) for predicting user intention in moving-target selection tasks was demonstrated. The features were calculated within a time-window ending at about two-thirds of the selection time. Combined, the features yielded a signifi-cantly better accuracy (∼ 4%) than the baseline scoring predictor from [29]. The combined features also yielded significantly bet-ter accuracy (∼ 3%) than the isolated ∆D. These results should be generalizable to different moving-target selection tasks, provided that additional factors (like number of objects) are taken into con-sideration. Further work should evaluate such extended models on multiple-target-with-changing-trajectory selection tasks like [29].
Additionally, the integration of these features in the model pro-posed by [5], significantly improved their prediction accuracy in moving-target selection by almost ∼ 7%. Future work in this type of task should explore variations different from physical size, like color, on otherwise identical objects; it is possible that the results from [5] could be further generalized to object salience, rather than object size.
The relative head–target feature, ∆dot, proved to be useful not only for prediction, but also for establishing the adequate time win-dow. Currently, the window is established empirically, from the ∆dot vs. t plot (Figure 3). Future work could explore automat-ing this process by findautomat-ing the optimal start and end window limits, by measuring different inputs. Furthermore, these times could be related to existing models, such as Hick-Hyman’s Law [13].
Alternatively, instead of choosing a time window, predictions could be done using a temporal learner, such as TClass [18]. This type of learner seems relevant for the evaluated task, since it can process multiple inputs that vary in time.
These results show the flexibility and usefulness of decision trees for predicting intended targets in 3D moving-target selection.Their biggest advantage in this study was their ability to integrate mul-tiple inputs to enhance predictive accuracy. Decision trees can be interpreted as simple if-else rules, allowing them to be implemented in real-time. However, if the predictions were to be adapted during execution, the major difficulty would be to recalculate the trees in real-time without impacting performance. This is still a mayor ar-gument in favor of the usage of scoring functions, which add a very small computational overhead to real-time applications.
An interesting trade-off, however, would be to integrate the scor-ing functions in a decision tree model, to make predictions more robust within each trial and between all trials. That way, real-time predictions could adapt to each user and be integrated with different moving-target selection techniques, like [12, 29, 41].
ACKNOWLEDGEMENTS
The authors wish to thank the reviewers for their valuable feed-back.
REFERENCES
[1] A. Al Hajri, S. Fels, G. Miller, and M. Ilich. Moving target selection in 2D graphical user interfaces. In P. Campos, N. Graham, J. Jorge, N. Nunes, P. Palanque, and M. Winckler, editors, Proceedings of the 13th IFIP TC 13 international conference on Human-computer inter-action - Volume Part II - INTERACT’11, pages 141–161, Lisboa, Por-tugal, 2011. Springer-Verlag.
[2] R. Blanch and M. Ortega. Rake cursor: improving pointing perfor-mance with concurrent input channels. In Proceedings of the SIGCHI Conference on Human Factors in Computing Systems - CHI ’09, CHI ’09, pages 1415–1418, Boston, Massachusetts, USA, 2009. ACM. [3] D. A. Bowman, E. Kruijff, J. J. LaViola, and I. Poupyrev. 3D User
Interfaces: Theory and Practice. Addison-Wesley Professional, 2004. [4] H. Carnahan and B. J. McFadyen. Visuomotor control when reaching toward and grasping moving targets. Acta Psychologica, 92(1):17–32, 1996.
[5] J. S. Casallas, J. H. Oliver, J. W. Kelly, F. Merienne, and S. Gar-baya. Towards a model for predicting intention in 3D moving-target selection tasks. In D. Harris, editor, Proceedings of the 10th in-ternational conference on Engineering psychology and cognitive er-gonomics, pages 13–22, Las Vegas, Nevada, USA, 2013. Springer Berlin Heidelberg.
[6] G. de Haan, M. Koutek, and F. H. Post. IntenSelect: using dynamic object rating for assisting 3D object selection. In Proceedings of the 11th Eurographics conference on Virtual Environments, EGVE’05, pages 201–209, Aalborg, Denmark, 2005. Eurographics Association. [7] P. M. Fitts. The information capacity of the human motor system in
controlling the amplitude of movement. (1954). Journal of Experi-mental Psychology: General, 121(3):262–269, Sept. 1992.
[8] J. D. Foley, V. L. Wallace, and P. Chan. The human factors of com-puter graphics interaction techniques. Comcom-puter Graphics and Appli-cations, IEEE, 4(11):13–48, 1984.
[9] J. Francone and L. Nigay. Using the user’s point of view for interaction on mobile devices. In 23rd French Speaking Conference on Human-Computer Interaction - IHM ’11, IHM ’11, pages 4:1–4:8, Sophia Antipolis, France, 2011. ACM.
[10] Y. Guiard and M. Beaudouin-Lafon. Fitts’ law 50 years later: ap-plications and contributions from human-computer interaction. Inter-national Journal of Human-Computer Studies, 61(6):747–750, Dec. 2004.
[11] M. Hall, H. National, E. Frank, G. Holmes, B. Pfahringer, P. Reute-mann, and I. H. Witten. The WEKA Data Mining Software : An Update. SIGKDD Explorations Newsletter, 11(1):10–18, 2009. [12] K. Hasan, T. Grossman, and P. Irani. Comet and Target Ghost:
Tech-niques for Selecting Moving Targets. In Proceedings of the SIGCHI Conference on Human Factors in Computing Systems - CHI ’11, pages 839–848, Vancouver, British Columbia, Canada, 2011. ACM. [13] R. Hyman. Stimulus information as a determinant of reaction time.
Journal of experimental psychology, 45(3):188–96, Mar. 1953. [14] M. V. Ilich. Moving Target Selection in Interactive Video. PhD thesis,
The University of British Columbia, 2009.
[15] R. S. Johansson, G. Westling, A. B¨ackstr¨om, and J. R. Flanagan. Eye-hand coordination in object manipulation. The Journal of neu-roscience, 21(17):6917–32, Sept. 2001.
[16] H. Jorke, A. Simon, and M. Fritz. Advanced Stereo Projection Using Interference Filters. In 3DTV Conference: The True Vision - Capture, Transmission and Display of 3D Video, 2008, pages 177–180, Istan-bul, Turkey, May 2008. IEEE.
[17] M. A. Just and P. A. Carpenter. The role of eye-fixation research in cognitive psychology. Behavior Research Methods & Instrumenta-tion, 8(2):139–143, 1976.
[18] M. W. Kadous. Temporal classification: Extending the classification paradigm to multivariate time series. PhD thesis, The University of New South Wales, 2002.
[19] E. Lank, Y.-C. N. Cheng, and J. Ruiz. Endpoint prediction using mo-tion kinematics. In Proceedings of the SIGCHI conference on Human factors in computing systems - CHI ’07, pages 637–646, San Jose, California, USA, 2007. ACM.
[20] M. J. McGuffin and R. Balakrishnan. Fitts’ law and expanding tar-gets: Experimental studies and designs for user interfaces. ACM Transactions on Computer-Human Interaction (TOCHI), 12(4):388– 422, 2005.
[21] T. M. Mitchell. Machine learning. McGraw-Hill, Boston, MA, 1997. [22] D. Mould and C. Gutwin. The effects of feedback on targeting with multiple moving targets. In Proceedings of Graphics Interface 2004, GI ’04, pages 25–32, School of Computer Science, University of Wa-terloo, WaWa-terloo, Ontario, Canada, 2004. Canadian Human-Computer Communications Society.
[23] N. Murray, D. Roberts, A. Steed, P. Sharkey, P. Dickerson, and J. Rae. An assessment of eye-gaze potential within immersive virtual environ-ments. ACM Trans. Multimedia Comput. Commun. Appl., 3(4):8:1– 8:17, Dec. 2007.
[24] M. Nancel, O. Chapuis, E. Pietriga, X.-D. Yang, P. P. Irani, and M. Beaudouin-Lafon. High-precision pointing on large wall displays using small handheld devices. In Proceedings of the SIGCHI Confer-ence on Human Factors in Computing Systems, CHI ’13, pages 831–
840, Paris, France, 2013. ACM.
[25] K. Nickel and R. Stiefelhagen. Pointing gesture recognition based on 3D-tracking of face, hands and head orientation. In Proceedings of the 5th international conference on Multimodal interfaces - ICMI ’03, ICMI ’03, pages 140–146, Vancouver, British Columbia, Canada, 2003. ACM.
[26] K. Nieuwenhuizen, J.-B. Martens, L. Liu, and R. V. Liere. Insights from Dividing 3D Goal-Directed Movements into Meaningful Phases. IEEE Computer Graphics and Applications, 29(6):44–53, Nov. 2009. [27] D. A. Norman. The Design of Everyday Things. Basic Books, New
York, New York, USA, 2002.
[28] D. Noy. Predicting user intentions in graphical user interfaces using implicit disambiguation. In CHI ’01 extended abstracts on Human factors in computing systems, pages 455–456, Seattle, Washington, USA, 2001. ACM.
[29] M. Ortega. Hook: Heuristics for Selecting 3D Moving Objects in Dense Target Environments. In Proceedings of the IEEE 8th Sym-posium on 3D User Interfaces (3DUI 2013), Orlando, Florida, USA, 2013. IEEE.
[30] R. A. Pavlik and J. M. Vance. VR JuggLua: A framework for VR applications combining Lua, OpenSceneGraph, and VR Juggler. In 2012 5th Workshop on Software Engineering and Architectures for Realtime Interactive Systems (SEARIS), pages 29–35, Singapore, Mar. 2012. IEEE.
[31] A. Pavlovych and C. Gutwin. Assessing Target Acquisition and Track-ing Performance for Complex MovTrack-ing Targets in the Presence of La-tency and Jitter. In Proceedings of the 2012 Graphics Interface Con-ference, pages 109–116, Toronto, Ontario, Canada, 2012. Canadian Information Processing Society.
[32] S. Pierard, V. Pierlot, A. Lejeune, and M. Van Droogenbroeck. I-see-3D! An Interactive and Immersive System that dynamically adapts 2D projections to the location of a user’s eyes. In International Confer-ence on 3D Imaging (IC3D), Li`ege, Belgium, 2012.
[33] J. R. Quinlan. C4.5: Programs for Machine Learning. Morgan Kauf-mann, San Mateo, California, USA, 1993.
[34] R. Shadmehr, M. A. Smith, and J. W. Krakauer. Error correction, sensory prediction, and adaptation in motor control. Annual Reviews of Neuroscience, 33:89–108, 2010.
[35] G. Shoemaker, T. Tsukitani, Y. Kitamura, and K. S. Booth. Two-Part Models Capture the Impact of Gain on Pointing Per-formance. ACM Transactions on Computer-Human Interaction (TOCHI), 19(4):28:1—-28:34, Dec. 2012.
[36] J. a. Silva, D. Cabral, C. Fernandes, and N. Correia. Real-time an-notation of video objects on tablet computers. In Proceedings of the 11th International Conference on Mobile and Ubiquitous Multimedia - MUM ’12, MUM ’12, pages 19:1–19:9, Ulm, Germany, 2012. ACM. [37] M. Spindler, W. B¨uschel, and R. Dachselt. Use your head: tangible windows for 3D information spaces in a tabletop environment. In Proceedings of the 2012 ACM international conference on Interactive tabletops and surfaces - ITS ’12, ITS ’12, pages 245–254, Cambridge, Massachusetts, USA, 2012. ACM.
[38] R. Stiefelhagen and J. Zhu. Head orientation and gaze direction in meetings. In CHI ’02 Extended Abstracts on Human Factors in Computing Systems, CHI EA ’02, pages 858–859, Minneapolis, Min-nesota, USA, 2002. ACM.
[39] H. R. Wilson, F. Wilkinson, L. M. Lin, and M. Castillo. Perception of head orientation. Vision research, 40(5):459–72, Jan. 2000. [40] J. Wonner, J. Grosjean, A. Capobianco, and D. Bechmann. SPEED :
Pr´ediction de cibles. In 23rd French Speaking Conference on Human-Computer Interaction - IHM ’11, pages 19:1–19:4, Sophia Antipolis, France, 2011. ACM.
[41] C.-W. You, Y.-H. Hsieh, and W.-H. Cheng. AttachedShock: facili-tating moving targets acquisition on augmented reality devices using goal-crossing actions. In Proceedings of the 20th ACM international conference on Multimedia - MM ’12, MM ’12, pages 1141–1144, Nara, Japan, 2012. ACM.
[42] S. Zhai, C. Morimoto, and S. Ihde. Manual and gaze input cascaded (MAGIC) pointing. In Proceedings of the SIGCHI conference on Hu-man Factors in Computing Systems - CHI ’99, CHI ’99, pages 246– 253, Pittsburgh, Pennsylvania, USA, 1999. ACM.