Science Arts & Métiers (SAM)
is an open access repository that collects the work of Arts et Métiers Institute of
Technology researchers and makes it freely available over the web where possible.
This is an author-deposited version published in: https://sam.ensam.eu Handle ID: .http://hdl.handle.net/10985/15638
To cite this version :
Bastien TOUBHANS, Fabien VIPREY, Guillaume FROMENTIN, Habib KARAOUNI - Prediction of form error during face turning on flexible Inconel 718 workpiece - In: 17th CIRP Conference on Modeling of Machining Operations, Royaume-Uni, 2019-06-13 - Procedia CIRP - 2019
Any correspondence concerning this service should be sent to the repository Administrator : [email protected]
ScienceDirect
Procedia CIRP 00 (2019) 000–000
www.elsevier.com/locate/procedia
2212-8271 © 2019 The Authors. Published by Elsevier B.V.
Peer-review under responsibility of the scientific committee of The 17th CIRP Conference on Modelling of Machining Operations, in the person of the Conference Chair Dr Erdem Ozturk and Co-chairs Dr Tom Mcleay and Dr Rachid Msaoubi.
17th CIRP Conference on Modelling of Machining Operations
Prediction of form error during face turning on flexible Inconel 718
workpiece
Bastien Toubhans
a,b*, Fabien Viprey
a, Guillaume Fromentin
a, Habib Karaouni
baArts et Métiers ParisTech, LaBoMaP,UBFC, F-71250 Cluny, France bSafran S.A., Research & Technology Center, F-78772 Magny-les-Hameaux, France * Corresponding author. E-mail address: [email protected]
Abstract
Complex workpieces may contain thin sections that are more likely to deform during machining due to cutting forces. It may result in form errors on the final product. Then, it is important to anticipate such defects when programing tool paths. A mechanist formulation of the cutting forces model, considering tool wear, is proposed in association with a part flexibility model to determine elastic deformation during face turning of thin Inconel 718 discs. A specific experimental methodology has been developed to validate the simulation results by performing in-situ measurements of form error.
© 2019 The Authors. Published by Elsevier B.V.
Peer-review under responsibility of the scientific committee of The 17th CIRP Conference on Modelling of Machining Operations, in the person of the Conference Chair Dr Erdem Ozturk and Co-chairs Dr Tom Mcleay and Dr Rachid Msaoubi.
Keywords: Elastic deformation; Cutting forces; Modelling; Turning; Inconel 718
1. Introduction
1.1. Context of the study
Parts with complex geometries can contain thin sections with lower rigidity. This may lead to form errors following machining operations due to three major mechanical phenomena. Firstly, under cutting forces, these thin sections are prone to elastic deformation during machining. It creates an undercut defect. Secondly, high removal rates cause the rebalancing of internal stresses, present in the material prior to machining, which often results in distortions of the workpiece. Thirdly, machining induced stresses in a thin layer under the machined surface may also cause distortions. These are frequent issues when machining complex aeronautical parts such as blisks, turbine discs or turbine blades. In addition, these parts are often made of nickel based alloys like Inconel 718. This alloy is widespread in such application for its high strength and corrosion resistance at elevated service temperatures. This material is also known to have a low
machinability, characterized by rapid tool wear and poor surface integrity in terms of machining induced residual stress profiles. It is critical for manufacturers of high added value parts to ensure the geometrical accuracy of the process. Therefore, there is a need for means of anticipation of geometrical errors during machining.
1.2. Literature review
In order to predict the workpiece deflection during machining, it is necessary to model the cutting forces acting on it. It is common to use a local cutting law as defined in [1] to model global cutting forces by using the edge discretisation methodology as developed in [2]. To be more relevant, the cutting force model must take into account tool wear, as cutting forces are sensitive to it [4, 5]. Especially the passive cutting force Fp, normal to the workpiece, which can vary up
to a factor 4 during a normal tool life [3] and was identified in [5] to be the major cause for deflection. The main wear mechanism when machining Inconel 718 in finishing cutting
2 Toubhans / Procedia CIRP 00 (2019) 000–000
conditions with carbide tools are adhesion and abrasion. The wear manifestations are mainly flank wear, notching, flaking and material loss on the rake face [6]. The tool life criterion to consider a tool worn is a flank wear Vb greater than 0.3 mm,
which can be measured following the ISO 3685:1993 [7]. Despite the low repeatability of wear, satisfying correlation has been found in literature between flank wear and cutting forces during the normal lifetime of the tool [3]. A threshold value around Vb = 0.15 mm is found to be the starting point of
rapid degradation of the cutting edge with steeper increase of cutting forces and multiplication of surface damage occurrences [3], [8].
The simulation of machining processes have known a growing interest in the past decades as the productivity and machining accuracy are critical for manufacturers. Workpiece deflection compensation methodologies have been developed, mainly in milling due to the complex part geometries leading to heterogeneous workpiece rigidity along the tool path. The majority of these methodologies are based on the coupling of a cutting force model and a workpiece deflection model. The edge discretisation method is used in [5] to model global cutting forces coupled with the plate theory to model the deflection of a turbine blade. FEM is used in [9] to model part deflection coupled with generalized Hooke’s law to homogenize the part deflection along the tool path. FEM is used in [10] to simulate the workpiece deflection coupled with a cutting force model, it takes into account the form error generated at the previous pass in the current pass calculation.
This study focuses on the simulation of elastic deformation of the part during face-turning of Inconel 718 flexible discs. It presents the coupling of a mechanist cutting force model, considering tool wear, and a workpiece flexibility model determined by FEM. The simulated data are compared to experimental observations based on a specific experimental methodology.
2. Experimental approach
2.1. Experimental setup
A specific experimental setup has been developed in order to observe the three previously mentioned major phenomena responsible for geometrical inaccuracies and to separate their respective impact. The instrumented cutting tests are performed on a NC lathe with flood cooling conditions. The case study is the face-turning of Inconel 718 discs, with an initial thickness of 3 mm and a 137 mm outer diameter (OD).
The cutting tool is a round tungsten carbide insert with rε = 4 mm. It is coated with PVD TiAlN+TiN, specially
designed for the finishing of super alloys. When mounted on the tool holder, the cutting geometry is αn = 7°, γn = 0° and
λn = 0°.
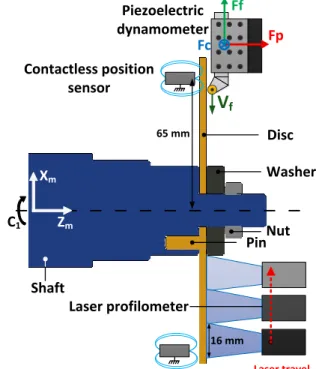
A global view of the experimental setup and instrumentation is shown in Fig. 1. Cutting forces (Fc, Ff, Fp)
are measured with a Kistler 9121 piezoelectric dynamometer. In-process workpiece deflection is measured by two eddy currents contactless sensors (Kaman 1S) located behind the workpiece close to its OD (X = 65 mm). In-situ measurement of the machined surface is performed with a laser profilometer (Keyence LJ_V7060) at every step of the process (before and after clamping, after each tool pass) to characterize form error. Global and local information about the effective depth
of cut can be retrieved after treatment of the raw laser measurements. The laser profilometer is fastened on the turret slide (X-axis of the lathe).
Fig. 1. Experimental setup for the face turning of a disc.
2.2. Observations
Three face turning passes are carried out on a disc with a cutting speed Vc = 35 m/min, a feedrate f = 0.1 mm/rev and a nominal depth of cut apn = 0.5 mm. The disc is clamped to the
shaft with a 40 mm washer and the tool stops at the diameter 49 mm during the first pass (Fig. 1). Upon receipt, the disc presents a 0.15 mm flatness defect. The workpiece origin is set close to the OD on the disc’s front face. Thus, due to the flatness defect, the average nominal depth of cut is 0.35 mm for the first pass which explains why the cutting force level is lower during this pass Fig. 2. During the passes, the passive cutting force increases due to tool wear and the fact that the part becomes more rigid the closer the tools gets to the disc’s anchor point.
Fig. 2. Evolution of the passive cutting force Fp during face turning passes.
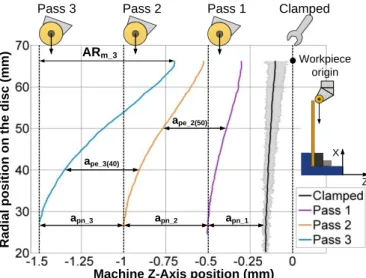
In Fig. 3, each curve represents the mean profile of the machined surface at different steps of the process. It is the average of 360 profiles measured by the laser profilometer on the entire machined surface (one profile every degree). Under the passive cutting force, the disc bends away from the tool resulting in an undercut defect, meaning that the effective depth of cut ape is lower than apn. Indeed, the disc is thicker
Pin Shaft Contactless position sensor Laser profilometer Piezoelectric dynamometer Fp Ff Fc 16 mm 65 mm Laser travel Zm C1 Washer Nut Disc
V
f XmRadial tool position (mm)
F p ( N ) Pass1 Pass 2 Pass 3
around the OD. The undercut defect adds up at each pass leading to great unevenness of the disc’s thickness after three passes. The nominal depth of cut is only respected at the very bottom of the disc where it is the most rigid. The initial flatness defect of the disc measured on the machined surface is shown by the grey envelope formed by the two extrema profiles.
Fig. 3. Average profile of the machined surface after each pass.
The geometrical errors are evaluated after each pass with the three following criteria (Table 1). The circular axial runout (CARb) and the axial bend (ABb) are both measured
close to the outer diameter on the backside of the disc with the bottom contactless sensor. Evolutions of the disc geometry on its back surface are linked to stress relaxation and machining induced stress as no material is removed here. CARb depicts
the warping of the disc whereas ABb describes the bending of
the disc as displayed in Fig. 4. Indeed, in addition to the increase of the warpage measured on the back surface, the disc bends away from the contactless sensors to the extent of 100 µm (measured at the OD) after three tool passes.
Fig. 4. Geometrical errors criteria measured on the backside of the disc.
The third criterion is the axial runout measured between the minimum and maximum diameter on the mean profile of the machined surface (ARm) which depicts the total error
including all three phenomena responsible for geometrical errors (cf. Fig. 3).
Table 1. Evolution of geometrical error during the process. Geometrical errors Before
Pass 1 After Pass 1 After Pass 2 After Pass 3 CARb (µm) 70 90 120 156 ABb (µm) 0 8 36 100 ARm (µm) 56 196 474 800
With the hypothesis that the machined surface is bent and warped in the exact same manner as the back surface after each pass, it is possible to separate the geometrical defects caused by elastic deformation and the ones due to stress relaxation and stress introduction during machining by subtracting ABb from ARm. Further work shall allow the
decoupling of the effect of stress relaxation and machining induced stress by using stress-free blanks for example.
In conclusion, after three tool passes, the geometrical error attributed to stress relaxation and machining induced stress represents between 56 µm and 144 µm at the OD depending on the angular position on the disc (cf. Eq. 1). It is the result of the bending and warping of the disc according to Fig. 4. The geometrical error attributed to elastic deformation of the part during machining is evaluated to 700 µm (ARm_3 _ ABb_3), it represents the average undercut defect
measured close to the OD.
𝐴𝐵𝑏_3±
(𝐶𝐴𝑅𝑏_3− 𝐶𝐴𝑅𝑏_𝑖𝑛𝑖𝑡𝑖𝑎𝑙)
2 = 100 ±
156 − 70
2 = [56 ; 144] (1)
These first observations prove that the three phenomena identified previously are responsible for the apparition of geometrical errors. In this particular case, the elastic deformation represents 80% of the machining inaccuracy. This study focuses on the prediction of the machining inaccuracy due to elastic deformation only.
3. Cutting force model and part flexibility model
3.1. Cutting force model
The cutting forces model is based on Armarego’s mechanist approach and the edge discretisation methodology which was improved in [11, 12]. The principle of this methodology is summed up in Fig. 5. The local forces are formulated in Eq. 2. 𝑓ℎ,𝑖= 𝑏(𝑘𝑐ℎ. ℎ𝑖+ 𝑘𝑒ℎ) 𝑓𝑣,𝑖 = 𝑏(𝑘𝑐𝑣. ℎ𝑖+ 𝑘𝑒𝑣) 𝑓𝑜,𝑖 = 𝑘𝑜. 𝜂𝑐𝑓,𝑖 . ℎ𝑖 𝜂𝑐𝑓,𝑖= 𝜃𝑐𝑓− 𝜃𝑖 (2)
In this formulation, b is the cut width of each segment, hi is
the local uncut chip thickness considered constant in the ith segment, θi is the angular position of the ith segment and θcf is
the chip flow direction calculated following Eq. 3.
𝜃𝑐𝑓 = ∫θmaxℎ(𝜃). 𝜃 𝑑𝜃 θmin ∫θmaxℎ(𝜃) 𝑑𝜃 θmin (3)
The global forces are obtained by projection and addition
Pass 1 Pass 2 Pass 3 Clamped Workpiece origin apn_3 ARm_3 apn_2 apn_1
Machine Z-Axis position (mm)
R a d ia l p o s it io n o n t h e d is c ( m m ) Z X ape_2(50) ape_3(40) Warping Max(R) Min(R) CARb(R)=Max(R)-Min(R) Bending Original Disc ABb
4 Toubhans / Procedia CIRP 00 (2019) 000–000
of all local forces in the machine coordinate system [12].
Fig. 5. Cutting geometry and edge discretisation methodology.
The coefficients of the local forces have been identified by least square minimisation of the absolute error between modeled and measured forces. The cutting tests consist in short face turning operations on a rigid part at a constant cutting speed of 35 m/min using 9 feedrate and depth of cut couples exploring the following maximum uncut chip thickness range hmax = [0.04 mm ; 0.15 mm]. This model
allows the prediction of the passive cutting force Fp with
precision as shown in Table 2.
Table 2. Results of cutting force model identification. Model coefficients Errors on Fp
kch = 2730 N/mm² Mean relative error (%) 2,7 keh = 112 N/mm Maximum relative error (%) 6,3 kcv = 2790 N/mm² Mean absolute error (N) 8 kev = 60 N/mm Maximum absolute error (N) 16 ko = -1520 N/mm² Residual degree of freedom (Fp) 15
This model is used to predict the cutting forces when using a fresh tool. Cutting forces are known to increase with tool wear. To assess the effect of tool wear on the cutting forces, long face turning operations are performed on a rigid part with Vc = 35 m/min, f = 0.1 mm/rev and ap = 0.5 mm in order
to match the cutting conditions used on the disc (see paragraph 2.2). Usual wear trend is observed on Fig. 6 where the dots represent measured data. A break-in period of rapid initial wear causes the cutting force to steeply increase during the first pass. During the following passes, the wear steady state region is reached characterised by a uniform wear rate. To take this observation into account in the cutting force model, the local forces formulations are modified using the following Eq. 4. Lm is the machined length which represents
the total length of the chip generated during machining. Only the edge effect formulation is modified as flank wear is the principal wear manifestation. The influence of Lm is modeled
with a power function according to experimental observations.
𝑓ℎ,𝑖= 𝑏(𝑘𝑐ℎ. ℎ𝑖+ 𝑘𝑒ℎ(1 + 𝑘𝐿𝑚ℎ. 𝐿𝑚𝑛𝐿𝑚ℎ))
𝑓𝑣,𝑖= 𝑏(𝑘𝑐𝑣. ℎ𝑖+ 𝑘𝑒𝑣(1 + 𝑘𝐿𝑚𝑣. 𝐿𝑚𝑛𝐿𝑚𝑣)) (4)
Fig. 6. Evolution of the cutting forces during the early tool life.
The four new coefficients are identified using the same least square algorithm presented previously. The results are exposed in Fig. 6 and Table 3 where the solid lines represent the modeled cutting forces. Further experimentations will allow for the generalisation of the effect of tool wear with different cutting parameters. To reach this goal, the amount of flank wear Vb will replace Lm in the local cutting forces
formulation.
Table 3. Tool wear influence on the cutting force model. Wear coefficients Errors on Fp
kLmv = 0.688 Mean relative error (%) 2.4 nLmv = 0.174 Maximum relative error (%) 5.5 kLmh = 0.822 Mean absolute error (N) 9 nLmh = 0.123 Maximum absolute error (N) 19
In this study, the goal is to be able to accurately predict the cutting forces in the specific cutting conditions used to machine the disc in paragraph 2.2. This new restrictive model reaches this goal as it allows for the prediction of the passive cutting force with satisfying precision during the early life of the tool.
3.2. Workpiece flexibility model
The workpiece’s flexibility in front of the cutting tool is modeled in order to predict its deflection during machining. To do so, FE static elastic simulations are carried out on the disc geometry to obtain the deflection of the part in front of the tool when a concentrated force is applied at different radii. The FE simulations are performed in 3D as the application of a concentrated force on a radius of the disc does not allow for 2D axisymmetric simplification. Linear tetrahedral elements are used with five elements in the disc’s thickness. Preliminary studies showed that only the passive force Fp,
normal to the machined surface, plays a role in deflecting the workpiece. Hence, the force is applied parallel to the workpiece axis. The disc geometry is considered flat and no dynamical effect or warping is simulated. The deflection is computed for five tool positions along one radius of the disc. For each tool position, the disc’s geometry is updated to match the machined surface average profile by removing the same amount of material as measured during the cutting tests. The simulated flexibility S is then modelled by a power function of the tool position X along the radius of the disc according to Eq. 5 using the same minimisation function as presented in the paragraph 3.1.
𝑆(𝑋) = 𝑘1∗ 𝑋𝑘2 (5) rε f ap θcf θi hmax Pr Zoom 𝑍𝑚 𝑋𝑚 b Segment i considered Segment i + 1 Segment i - 1 hi fo,i fh,i fv,i Round Insert Workpiece
Break-in period Steady state region
1 2 3 4
Pass n°
Mod Exp
The methodologies to model the passive cutting force Fp
and the workpiece’s flexibility are used in the following section to simulate face turning passes on a thin Inconel 718 disc.
4. Simulation of face turning passes based on the coupling of the cutting force and flexibility models
4.1. Cutting force and workpiece flexibility coupling algorithm
Accurate prediction of the passive cutting force and workpiece flexibility in front of the tool allows for the simulation of the effective depth of cut during a face-turning operation. The two models are coupled in the algorithm detailed in Fig. 7. The cutting force model entries are the radius of the round insert rε, the nominal depth of cut apn, the
feedrate f and the five previously identified coefficients of the local force model. The workpiece flexibility model entries are the two coefficients of the power function (cf. Eq. 5). For each position Xi of the tool, the algorithm iterates by changing
the simulated effective depth of cut aps in order to minimise
the difference between the simulated passive force Fp and the
simulated deflection force Fd until the equilibrium is reached.
Fig. 7. Cutting force and workpiece flexibility coupling algorithm.
4.2. Simulation of face turning passes
The simulations of three consecutive face turning passes are carried out using the previous algorithm (cf. Fig. 7). The simulated effective depth of cut is then compared to the experimental effective depth of cut measured along the radius of the disc using the experimental methodology described in
paragraph 2.1. The cutting tests described in section 2.1 are performed at a cutting speed and a feedrate equal to 35 m/min and 0.1 mm/rev respectively. As mentioned in section 2.1, apn = 0.35 mm for the first pass due to the flatness defect of
the disc and apn = 0.5 mm for the second and third pass.
To model the part’s flexibility in front of the tool, the implemented geometry in FE simulations is a plane 3 mm thick disc with material removed according to the laser measurements done during the cutting trials. The identified flexibility models for each pass are presented in Table 4.
Table 4. Flexibility models identification results.
Coefficients Pass 1 Pass 2 Pass 3
k1 7.42.10-11 6.29.10-11 3.69.10-11
k2 3.91 4.01 4.21
For every pass, the initial geometry is built from measurements on the real geometry. Therefore, the simulations of each passes are independent and the errors are not adding up. The goal is to validate the fit of purpose of the coupling algorithm for three geometries with various flexibilities.
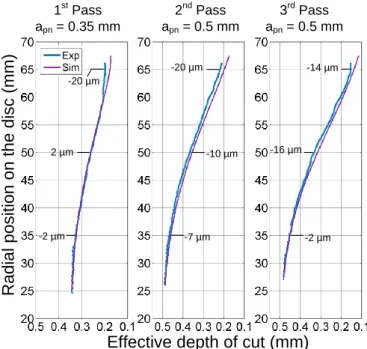
Both experimental and simulated effective depths of cut are presented in Fig. 8 with blue and purple curves respectively. The experimental curves are obtained by subtracting two consecutive average profiles of the machined surface (cf. Fig. 3). Therefore, the bending defect ABb linked
to the two mechanical phenomena as explained in section 2.2 are contained in these blue curves. Further developments will permit to fully separate the geometrical defects linked to elastic deformation during machining and the ones linked to mechanical phenomena. In this particular case, the algorithm is able to accurately predict the average undercut defect for the three passes. The deviation between the simulated and experimental effective depth of cut is illustrated in Fig. 8 at three radial positions which are 35, 50 and 65 mm.
Fig. 8. Simulated depth of cut for three consecutive face turning passes.
The simulated profiles of the machined surface are shown in Fig. 9 with purple curves. They are obtained by subtracting
Cutting force model Fp(aps)
rε,f, apn
kch, keh, ko, kLmh, nLmh
Deflection force model Fd(ds)
Flexibility model S(Xi)
Workpiece geometry
For every tool position Xi
Converging towards equilibrium: apn = aps(Xi) + ds(Xi) Fp(aps(Xi)) = Fd(ds(Xi)) Pass is over? aps(X), ds(X) Increment tool position Xi Yes No aps(Xi-1) ds(Xi) = apn - aps(Xi) aps(Xi) = aps(Xi-1) Fp computation | Fd - Fp|≤ ε? No Fd ≥ Fp ? Yes aps(Xi), ds(Xi) Yes No Increase aps(Xi) Decrease aps(Xi) aps(Xi), ds(Xi) Yes Model entries Details Fd =ds(Xi)/S(Xi) 1st Pass apn = 0.35 mm 2nd Pass apn = 0.5 mm
Effective depth of cut (mm)
3rd Pass apn = 0.5 mmR
a
d
ia
l
p
o
s
it
io
n
o
n
t
h
e
d
is
c
(
m
m
)
-7 µm -10 µm -20 µm -20 µm 2 µm -2 µm -2 µm -14 µm -16 µm6 Toubhans / Procedia CIRP 00 (2019) 000–000
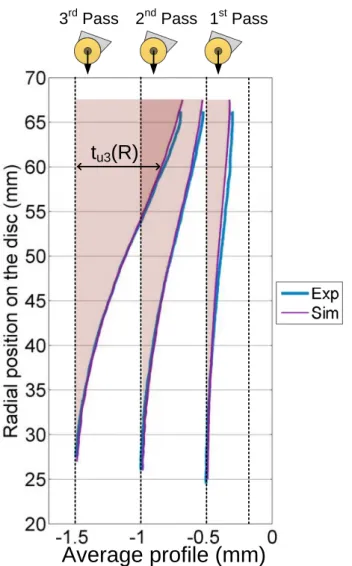
the simulated effective depth of cut aps and the previous
machined surface profile (cf. Eq. 6). The simulated undercut thickness defect tu is represented with a red patch on Fig. 9.
The blue curves represent the mean profile of the machined surface measured with the laser profilometer after each pass. 𝑃𝑟𝑜𝑓𝑖𝑙𝑒𝑖= 𝑃𝑟𝑜𝑓𝑖𝑙𝑒𝑖−1− 𝑎𝑝𝑠𝑖 (6)
Fig. 9. Simulated undercut defect for three consecutive face turning passes.
The simulated undercut defect tu is consistent with the
experimental data. However, the methodology developed in this study does not take into account the geometrical defect linked to the mechanical phenomena cited in introduction which explains the differences between the experimental and simulated curves. Furthermore, the disc is considered perfectly flat in the simulations and the methodology is based on the average profile of the machined surface. In reality, the disc is warped which causes the effective depth of cut to fluctuate depending on the angular position. Further work will tackle the effect of the rebalancing of internal stress and machining induced stress on the apparition of geometrical defects. The methodology developed in this article allows for the prediction of the average undercut defect during the face turning of flexible Inconel 718 workpieces.
5. Conclusions
This research work is a contribution to the development of compensation methodologies in order to reduce form errors in finishing turning operations of flexible Inconel 718 parts. Based on the coupling of a cutting forces model, and a part flexibility model, it has been shown that it is possible to simulate the undercut defect due to the workpiece deflection during machining. The cutting force model was modified to take tool wear into account. This restrictive model permits to predict the evolution of the cutting forces with tool wear in the conditions used to machine the disc. It will be generalised to a wider range of cutting conditions with future cutting trials. The experimental observations shows that the form error generated by the rebalancing of both internal stresses and machining induced residual stresses cannot be neglected when dealing with a flexible workpiece and will be tackled in future works.
Acknowledgements
The authors thank the Région Bourgogne Franche-Comté for the financial support of this study.
References
[1] Armarego EJA, Whitfield RC, Computer Based Modelling of Popular Machining Operations for Force and Power Prediction, CIRP Ann., 1985, 34 (1) : 65–69.
[2] Campocasso S, Costes J-P, Fromentin G, Bissey-Breton S, Poulachon G, A generalised geometrical model of turning operations for cutting force modelling using edge discretisation, Appl. Math. Model., 2015, 39 (21) : 6612–6630.
[3] Arrazola PJ, Garay A, Fernandez E, Ostolaza K, Correlation between tool flank wear, force signals and surface integrity when turning bars of Inconel 718 in finishing conditions, Int. J. Mach. Mach. Mater. 7, 2014, 15 (1–2) : 84–100.
[4] Grzesik W, Niesłony P, Habrat W, Sieniawski J, Laskowski P, Investigation of tool wear in the turning of Inconel 718 superalloy in terms of process performance and productivity enhancement, Tribol.
Int., 2018, 118 (Supplement C) : 337–346.
[5] Yan Q, Luo M, Tang K, Multi-axis variable depth-of-cut machining of thin-walled workpieces based on the workpiece deflection constraint, Comput.-Aided Des., 2018, 100 : 14–29.
[6] Devillez A, Schneider F, Dominiak S, Dudzinski D, Larrouquere D, Cutting forces and wear in dry machining of Inconel 718 with coated carbide tools, Wear, 2007, 262 (7) : 931–942.
[7] ISO 3685:1993 Tool-life testing with single-point turning tools. 1993. [8] Iturbe A, Hormaetxe E, Garay A, Arrazola PJ, Surface Integrity
Analysis when Machining Inconel 718 with Conventional and Cryogenic Cooling, 3rd CIRP Conf. Surf. Integr., 2016, 45 : 67–70. [9] Ma J, He G, Liu Z, Qin F, Chen S, Zhao X, Instantaneous
cutting-amount planning for machining deformation homogenization based on position-dependent rigidity of thin-walled surface parts, J. Manuf.
Process., 2018, 34 (Part A) : 401–411.
[10] Chen W, Xue J, Tang D, Chen H, Qu S, Deformation prediction and error compensation in multilayer milling processes for thin-walled parts, Int. J. Mach. Tools Manuf., 2009, 49 (11) : 859–864. [11] Dorlin T, Fromentin G, Costes J-P, Generalised cutting force model
including contact radius effect for turning operations on Ti6Al4V titanium alloy, Int. J. Adv. Manuf. Technol., 2016, 86 (9) : 3297– 3313.
[12] Chérif I, Dorlin T, Marcon B, Fromentin G, Karaouni H,
Phenomenological study of chip flow/formation and unified cutting force modelling during Ti6Al4V alloy turning operations, Procedia
CIRP, 2018, 77 : 351–354.