Published by Canadian Center of Science and Education
An Economic Analysis of Traditional Agriculture Products: The Case
of Chicken in Thua Thien Hue Province, Vietnam
Long Hoang Thanh1,2, Thi Minh Hop Ho2, Philippe Burny2, Thomas Dogot2, Nguyen Dang Hao1 & Philippe Lebailly2
1 University of Economics, Hue University, Vietnam
2 Economic and Rural Development, Gembloux Agro-Bio Tech, University Liege, Belgium
Correspondence: Long Hoang Thanh, University of Economics, Hue University, Vietnam. Tel: 84-91-584-1595. E-mail: hoangthanhlong@hce.edu.vn
Received: September 19, 2019 Accepted: September 23, 2019 Online Published: September 29, 2019 doi:10.5539/ass.v15n10p149 URL: https://doi.org/10.5539/ass.v15n10p149
Abstract
Agriculture and traditional agriculture products plays a significant role in the livelihoods of smallholder farmers in developing countries, including Vietnam. Cost-benefit Analysis and a mixed methodology were applied to evaluate the economic performance of traditional chicken production in Thua Thien Hue province, Vietnam by region and scale. The data were drawn respectively from 64 sample households in Huong Thuy and Nam Dong district in 2017. The Cost-benefit analysis shows that Huong Thuy tends to have a lower production cost and thus a higher production benefit as compared to those of Nam Dong district. This study also indicates evidence of the importance of veterinary, mortality rate, scale of production and region on the performance of chicken farmer in the province.
Keywords: traditional agriculture products, cost-benefit analysis, chicken, Thua Thien Hue, Vietnam 1. Introduction
Traditional agriculture products (TAPs) play a significant element of cultures, history, and lifestyles devoting to the development and sustainability of rural regions (Trichopoulou, Soukara, & Vasilopoulou, 2007). Regardless of the globalization of the food market, a diversity of dietary patterns among nations can be observed (Naska et al., 2006; Slimani et al., 2002). The demand for TAPs has still been increasing in line with the overall customer positive attributes (Almli, Verbeke, Vanhonacker, Næs, & Hersleth, 2011). Thus, researches on TAPs provide an essential awareness of dietary patterns and how these have been changed over times (Trichopoulou et al., 2007). Traditional agriculture products have been defined as locally produced and consumed, and provides the main source of food for the world’s 1 billion poor (Kremen, Iles, & Bacon, 2012). Belongs to a defined space, and it is part of a culture that implies the cooperation of the individuals operating. Linked to a territory, and it must also be part of a set of traditions. Means proven usage in the community market for a time period showing transmission between generations. Methods of processing, storage, and ripening are consolidated with time according to uniform and constant local use (Verbeke, Guerrero, Almli, Vanhonacker, & Hersleth, 2016).
Agriculture and TAPs in particular, especially in developing countries, including Vietnam, have importantly contributed on creating jobs, generating incomes and improving life quality, (Burgos, Hinrichs, Otte, & Roland-Holst, 2008; Desvaux, Ton, Phan Dang, & Hoa, 2008; Epprecht, Vinh, Otte, & Roland-Holst, 2007; Miers, 2008; Tu, 2001). In Thua Thien Hue province, agricultural sector plays a very important role in social - economic development, which occupy many key resources, 77.9% of the total area, 32.8% of the total labor force, 11.3% of the total GDP (Nguyên, 2015). In addition, Thua Thien Hue province has also long been well-recognized for home to many traditional agriculture products, namely Huong Thuy and Nam Dong chicken, A Luoi honey, Thuy Bieu Thanh Tra pomelo, Huong Tra mandarin,… (Ban et al., 2005; Tran, Marincioni, Shaw, & Sarti, 2008; Wetterwald, Zingerli, & Sorg, 2004). In recent years, the poultry in general and chicken production in particular in Thua Thien Hue province has made remarkable achievements; constantly increased from 1.63 million poultries (of which 0.9 million chicken) and nearly 3 thousand tons of meat (of which 2 thousand tons of chicken) in 2007 to 2.12 million (of which 1.13 million chickens) and 3.82 thousand tons of meat (2.32 thousand tons chicken) in 2013 (TTH, 2014).
Neverthele potential a been surpr only focus high quant 2016; Ifft, researches & Spradbr the traditio province b (ii) explor and (iii) p production 2. Method 2.1 Study S 2.1.1 Case This study by Quang Lao Peopl nine admi (Figure 1) namely Hu and forestr 2.2 Sampli There are systematic Thien Hu secondary available i collect dat period of W Table 1. N Lo Huo Nam T Source: (Su Interviewe ess, agricultur and comparativ risingly little r sed on comme tity of eggs, ch , Roland-Holst s rather than pa row, 1991; Thi onal chicken by (i) conducti ring which det proposing init n. d Sites e Description y was conducte Tri province, S le's Democratic inistrative dist . The study w uong Thuy an ry (TTH, 2014 ing Strategy an four of the m c sampling, an ue province is information in yearly stati ta, with a tota Winter-Spring Numbers and st cations ong Thuy m Dong Total urvey, 2017) ees in the study
al in general a ve advantages, research on TA ercial agricultu hicken but low t, Sy, & Zilbe ay attention mo i Ut & Kajisa, to examine if ng a cost-bene erminants are tiative recomm ed in Thua Thi South by Da N c, respectively tricts. The est was conducted nd Nam Dong. 4). nd Data Collec ost commonly nd probability s relatively di on the numb istic books, so al of 64 farme season in 201 tructure of the Num y sites were re and chicken in , leading to a l APs, especially ure foods, nam w quality of me erman, 2008; M ore on technic 2006). As a r f this is a solu efit analysis of critical succes mendations to
ien Hue, a prov Nang city, on th y. The province timated popul in 2017 in tw The most im ction y used samplin proportion to iversified in t er of breedin o stratified ra ers interviewed 7 was taken in survey mber of househo 39 25 64 quested to giv n particular, h low income fo y traditional c mely commerc eat, taste (Berg
Marsh & Mac al or institutio result, this pap ution to diver f traditional ch ss factors or b o improve the
vince in the No he East and the e has an area o ation of 1,127 wo districts of T mportant econo ng procedures: size selection terms of scal ng facilities, th andom samplin d. Only one c nto the conside
olds
e information
have not comm or farmers (Hie chicken. The m cial or “industr g, 2002; Brook cAulay, 2002; onal issues (MU
er tries to mak rsify income f hicken product bottlenecks of e economic e orth Central of e West by the of 5.053 km2 p 7,905 people Thua Thien H mic activity in : simple rando n (Iarossi, 200 le, model, bre he number of ng was applie cycle of produ eration. Kien L 30 12 42 on: mensurately de ep, 2016). Furt majority of pre rial” chickens, ks, Roberton, & Phan et al., 2 URAMOTO et ke effort on ec for smallholde tion in Thua Th traditional chi efficiency of t f Vietnam, bor South China S province, whic in 2013 (Tran Hue province, c n this municip om sampling, s 06). Chicken p eeding form... f chickens, br ed. Questionna uction in a yea Breeds Lai eveloped with thermore, ther evious studies , short-day rai & Bell, 2010; H 2009). Most o t al., 2006; Ng conomic analys er farmers in
hien Hue prov icken performa traditional chi
rdered on the N Sea and Repub
ch is organized n & Shaw, 2 central of Viet pality is agricu stratified samp production in . Furthermore reeding forms aires were use ar, specifically Tam Hoang 9 13 22 their e has have ising, Hiep, of the guyen sis of TTH vince; ance; icken North lic of d into 007). tnam, ulture pling, Thua , the s ...is ed to y, the
Household characteristics: age of head of household, educational levels, years of experience, membership, training times; Production activity: numbers, breeds, scale, times, mortality rate; Quantities and costs of input: capital, land, housing, breed, feed, veterinary; Quantities and value of output: weight, numbers of selling, selling prices.
In some cases, family members also participate in the interview so they can support each other to provide more accurate information. Prior to the interview, the purpose of this survey was clearly explained so that households could provide more reliable information.
2.3 Analytical Context
Descriptive statistics, means, frequency was applied to analyze the current situation of traditional chicken raising form in the surveyed areas. To compare the means of different costs and results on different chicken farms, Independent-samples t-test were used in the case of two groups, in the other cases, ANOVA was applied.
The cost-benefit analysis (CBA) approach was used to analyze results and efficiency of chicken production. Costs of production (C) composed of direct cost (DC), subsistence/self-sufficient costs (SCs), depreciation cost of chicken coop (Dc), and cost of borrowing money (i) (Tuan, Van Xuan, Nam, & Navrud, 2009).
C = DCs + SCs + Dc + i
Benefits (Bs)/ Gross output (GO) are calculated by multiplying quantity (Q) of selling chicken with market price (P). Bs = QP
Net benefits (NBs) are defined by subtracting costs from benefits. NB = B – C
Value Added (VA): Value added is a part of production value after subtracting intermediate costs (IC). VA = GO - IC
Mixed Income (MI): The net income of a farm can receive in a production cycle. MI = VA - (Ds + O) Production value (GO/IC): This indicator shows how many GO will be earned for 1 IC.
Value Added / Intermediate Cost (VA / IC): This indicator shows how many VA will be earned for 1 IC.
Net Economic Return/ Intermediate Expenditure (NB / IC): This indicator shows how many NB will be earned for 1 IC.
Net economic profit / total cost (NB/ TC): This indicator shows how many NB will be earned for 1 IC.
Additionally, Net Benefit (NB) of chicken production were analyzed using the multiple linear regression. Breed, feed, veterinary, education, experience, days of raising, scale of raising, mortality, training, breeding types and region were used as explanatory variables. The results were estimated by the ordinary least squares method (OLS). Before that, assumptions for the linear model have also been checked, namely Durbin-Watson test for auto correlation, residuals, independence, normality; multicollinearity by Pearson test.
The model is:
Yi = α0+ α1X1i + α2X2i + α3X3i + α4X4i + α5X5i + α6X6i+ α7X7i + α8X8i + α9X9i + α10X10i + α11X11i + ei
where, Yi is the observation of ith farm, α0 is the intercept, α1, α2, α3, α4, α5, α6, α7, α8, α9, α10, α11 …are regression coefficient and ei is the random error term.
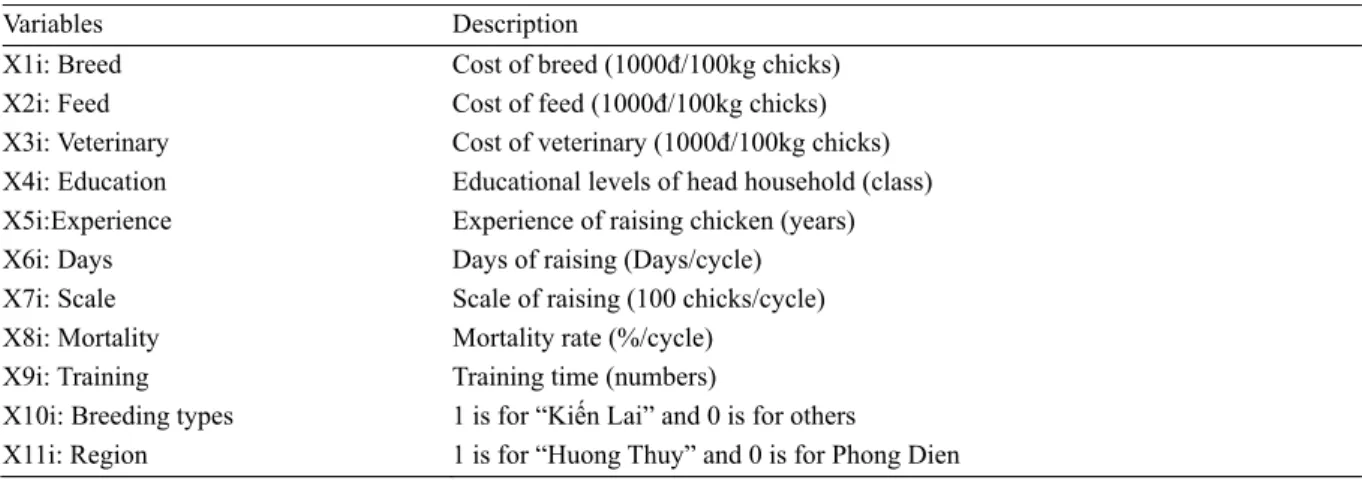
Table 2. Description of explanatory variables
Variables Description
X1i: Breed Cost of breed (1000đ/100kg chicks) X2i: Feed Cost of feed (1000đ/100kg chicks) X3i: Veterinary Cost of veterinary (1000đ/100kg chicks) X4i: Education Educational levels of head household (class) X5i:Experience Experience of raising chicken (years)
X6i: Days Days of raising (Days/cycle)
X7i: Scale Scale of raising (100 chicks/cycle) X8i: Mortality Mortality rate (%/cycle)
X9i: Training Training time (numbers)
X10i: Breeding types 1 is for “Kiến Lai” and 0 is for others
3. Results and Discussion
3.1 Socioeconomic Characteristics of the Sample Table 3. Socioeconomic characteristics of the sample
Unit Mean S.D
Age Years 42.08 8.56
Educational levels Years 7.03 2.38
Chicken production experience Years 6.91 1.63
Total labor Labor 2.23 0.96
Training Times 2.96 0.84
Total land m2 16678.13 9157.44
Land for chicken m2 958.89 96.84
Land for other activities m2 15719.23 9252.48
Total capital Mil.VND* 3176.17 3877.55
Capital for chicken Mil.VND 50.01 30.73
Own capital Mil.VND 18.11 5.15
Loans for chicken Mil.VND 31.90 26.02
Source: Household survey in 2017; *In 2017, the exchange rate was 1 Euro = 26,000 VND
The average age of farmers is 42 and educational level is 7 class. The number of experiencing years of raising chicken is quite high, averaging nearly 7 years, which is a very important condition for chicken production that requires knowledge and experiences. Average labor force is 2 labors, although the labor force is relatively large, but chicken production does not require much time and can take advantage of spare time and over-age labor. Although the number of labor involved in chicken activity is not high, farmers have been technically trained, at least once and at most 5 times, regularly 3times/year provided by agricultural extension center of the district and of feed or veterinary companies. To implement this type of chicken raising, farmers need to have a relatively land area for the coop, grazing land so that chicken can partly feed themselves from natures. This requirement has been satisfied by farmers in the surveyed sites by an average of 959 m2.
The total investment for the chicken activity is 19 million VND and the largest one is 107 million VND. This difference is due to the different scale of production. For smallholder farmers, they do not require much investment, in contrast big farms require investments quite a lot. In spite of the fact that most farmers have access to loans, the amount of loan is not much, the average is 32 million VND per household and usually they are entitled to preferential loans through union organizations in the district.
3.2 Some Technical Characteristics of Traditional Chicken
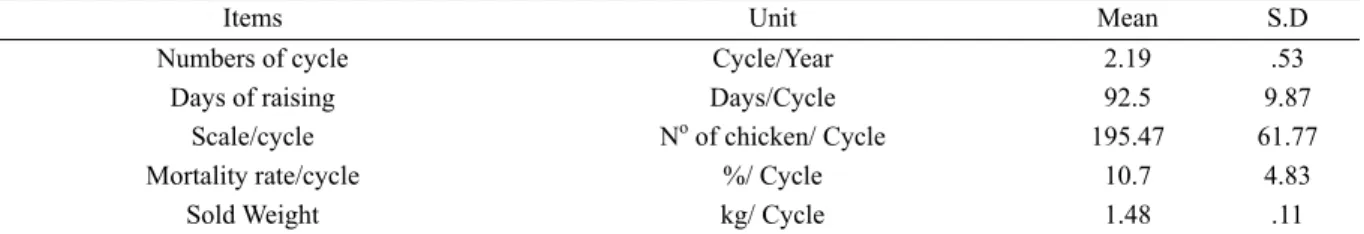
Table 4. Indicators of technical characteristics of backyard chicken production
Items Unit Mean S.D
Numbers of cycle Cycle/Year 2.19 .53
Days of raising Days/Cycle 92.5 9.87
Scale/cycle No of chicken/ Cycle 195.47 61.77
Mortality rate/cycle %/ Cycle 10.7 4.83
Sold Weight kg/ Cycle 1.48 .11
Source: Household survey in 2017
Table 4 indicates that, the average cycles of production in a year of chicken farms are 2 cycles/year and the total days of raising is 93 days, equivalent to 3 months. In comparison with times of industrial chickens (60 – 75 days), this chickens need longer times of raising. Between cycles of production, farmers usually spend one or two weeks for cleaning and repairing the grazing area and coop. The average of chicken/cycle is about 196 chicks/cycle, which is about 2 chicks/m2 in the condition of land for chicken in the surveyed areas. This stocking density is very good for the raising activity as compared to the technical requirement of around 5-6 chicks/m2 (Nam, 2002). There is a significant difference in the mortality loss among chicken farms, which is reflected by the smallest loss rate of 3%, the largest of up to 19% and the overall average of 10%. Difference in mortality rate arise from the care, veterinary, quality of the breed and the safety of the breeding coop. This loss rate is quite higher in comparison with other chicken, namely industrial chicken (5%), semi-industrial chicken (8%) (Khoa & Mãnh, 2012). The reason for this situation is due to the method of raising, chickens are free in the grazing area,
looking for feeds from the nature, so chicken is more susceptible to diseases than the other form of raising keeping the chicken only in the house. Moreover, in the winter season, temperature in the study areas usually drops very low, about 10-12 degrees, so this is also of the reasons of high mortality rate. If this worrying matter would not be solved soon, it will be difficult for farmers to achieve a high results.
3.3 Chicken Production Cost in Thua Thien Hue 3.3.1 Production Cost by Region
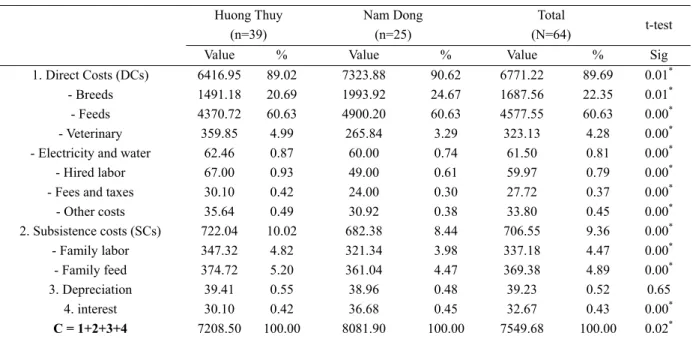
Table 5 shows a significant difference in cost of chicken production between regions. Specifically, the average Cost /100kg in Huong Thuy was VND 7,208,500 lower than that of Nam Dong district, VND 8,081,900. The key explanation for this difference is the availability and prices of inputs. While Huong Thuy are geographically quite convenient for trading and many advantages for livestock development. Thus, in Huong Thuy district, there are many agents and stores providing the inputs namely breeds and feeds. In contrast, Nam Dong is a mountainous district where transportation is difficult and there are few suppliers provide inputs. Therefore, the prices for inputs are typically higher as compared to that of other districts as shipping costs are included in the selling prices. This is evidenced in the data on breed and feed costs as shown in Table 7. The farmers in Huong Thuy only pay for the cost of breeds and feeds about 1,491,180 and 4,370,720, while in Nam Dong, farmers have to pay for 1,993,920 and 4,900,000, respectively. In addition, in Huong Thuy chicken production have developed earlier than Nam Dong, so farmers in this area have better experiences and techniques, so this factor also affects the cost of production. Remaining costs also differ between two regions, but this difference is negligible.
Table 5. Components of costs by region (Unit: 1,000VND/100Kg) Huong Thuy (n=39) Nam Dong (n=25) Total (N=64) t-test
Value % Value % Value % Sig
1. Direct Costs (DCs) 6416.95 89.02 7323.88 90.62 6771.22 89.69 0.01*
- Breeds 1491.18 20.69 1993.92 24.67 1687.56 22.35 0.01*
- Feeds 4370.72 60.63 4900.20 60.63 4577.55 60.63 0.00*
- Veterinary 359.85 4.99 265.84 3.29 323.13 4.28 0.00*
- Electricity and water 62.46 0.87 60.00 0.74 61.50 0.81 0.00*
- Hired labor 67.00 0.93 49.00 0.61 59.97 0.79 0.00*
- Fees and taxes 30.10 0.42 24.00 0.30 27.72 0.37 0.00*
- Other costs 35.64 0.49 30.92 0.38 33.80 0.45 0.00* 2. Subsistence costs (SCs) 722.04 10.02 682.38 8.44 706.55 9.36 0.00* - Family labor 347.32 4.82 321.34 3.98 337.18 4.47 0.00* - Family feed 374.72 5.20 361.04 4.47 369.38 4.89 0.00* 3. Depreciation 39.41 0.55 38.96 0.48 39.23 0.52 0.65 4. interest 30.10 0.42 36.68 0.45 32.67 0.43 0.00* C = 1+2+3+4 7208.50 100.00 8081.90 100.00 7549.68 100.00 0.02*
Notes: * indicates a 95% significance level; Source: Household survey in 2017 3.3.2 Production Cost by Scale
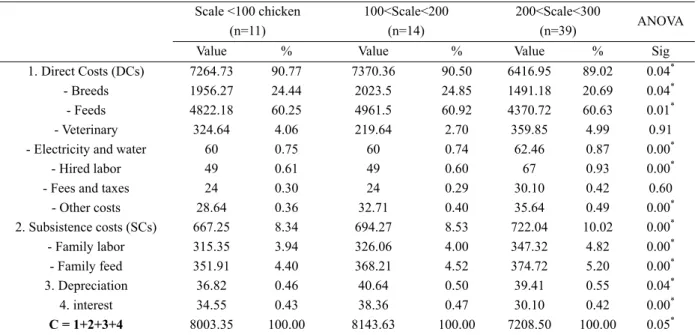
The sample was divided into three groups, chicken farms with scale of raising in one cycle below 100 chicken, 100 – 200 and 200 – 300. The basis for this division is by the result from expert interview with officers from Department of Agriculture and Agriculture Extension Center in the study areas.
One of the most noticing point is that the biggest scale farms pay the least Costs for chicken production with an average of VND 7,208,500. Whereas, the smallest scale farms pay the most Costs of VND 8,003,350. This was explained by the significant difference in the cost of breed and feed, the two largest sharing costs in the total cost of chicken production.
There is a significant difference in the cost of the breeds and feeds. The smaller the breeding scale is, the higher the cost of the breed occur. The reason for this situation is that there are differences in feed prices depending on different quantities. The more breeds the farmers buy, the greater discounts of prices they will get from the breeding stores.
Nevertheless, the biggest scale farms are more risk averse as compared with the others. Their awareness of disease control is very high, so the cost of veterinary of this group is highest. The costs from hired labor of these
farms also greater than that of the others because other smallholder farmers mainly use household labor. Table 6. Components of costs by scales (Unit: 1,000 VND/100 Kg)
Scale <100 chicken (n=11) 100<Scale<200 (n=14) 200<Scale<300 (n=39) ANOVA
Value % Value % Value % Sig
1. Direct Costs (DCs) 7264.73 90.77 7370.36 90.50 6416.95 89.02 0.04*
- Breeds 1956.27 24.44 2023.5 24.85 1491.18 20.69 0.04*
- Feeds 4822.18 60.25 4961.5 60.92 4370.72 60.63 0.01*
- Veterinary 324.64 4.06 219.64 2.70 359.85 4.99 0.91
- Electricity and water 60 0.75 60 0.74 62.46 0.87 0.00*
- Hired labor 49 0.61 49 0.60 67 0.93 0.00*
- Fees and taxes 24 0.30 24 0.29 30.10 0.42 0.60
- Other costs 28.64 0.36 32.71 0.40 35.64 0.49 0.00* 2. Subsistence costs (SCs) 667.25 8.34 694.27 8.53 722.04 10.02 0.00* - Family labor 315.35 3.94 326.06 4.00 347.32 4.82 0.00* - Family feed 351.91 4.40 368.21 4.52 374.72 5.20 0.00* 3. Depreciation 36.82 0.46 40.64 0.50 39.41 0.55 0.04* 4. interest 34.55 0.43 38.36 0.47 30.10 0.42 0.00* C = 1+2+3+4 8003.35 100.00 8143.63 100.00 7208.50 100.00 0.05*
Notes: * indicates a 95% significance level; Source: Household survey in 2017 3.4 Chicken Production Results in Thua Thien Hue
3.4.1 Production Results by Region
Being in a convenient geographical position, easily access the inputs market, costs of chicken production in Huong Thuy are lower than those of Nam Dong as analyzed in the section 3.3.1. The market survey in study areas also shows that there is no significant difference in the selling price between regions (the average price per kg is about 85,000 VND/Kg). This is derived from the small scale of production in Thua Thien Hue province, undeveloped the market, lack of processing plants; as a result, chicken products are mainly locally consumed. However, due to a lower costs, results of chicken production in Huong Thuy, the midland plain, are higher than that of Nam Dong, the mountainous areas. This is presented in Table 7, indicators of the results by region. Specifically, indicators reflecting the results, namely GO, VA, MI and NB in Huong Thuy are the higher that those of Nam Dong. Indicators reflecting efficiency show that in the winter season in Huong Thuy, 1 VND investment of IC earned 1.55 VND GO, 0.55 VND VA, 0.52 VND MI, and 0.41 VND NB. In the chicken farms in Nam Dong, 1 VND investment of IC earned 1.29 VND GO, 0.29 VND VA, 0.27 VND MI and 0.17 NB. Table 7. Result indicators by region (Unit: 1,000 VND/100Kg)
Indicators Unit
Huong Thuy (n=39)
Nam Dong
(n=25) t-test
Mean S.D Mean S.D sig
GO 1000VND 9608 1937.65 9215 635.05 0.00* VA 1000VND 3288 1569.81 1964 1092.05 0.00* MI 1000VND 3121 1571.33 1815 1091.18 0.00* NB 1000VND 2399 1575.63 1133 1088.35 0.00* GO/IC times 1.55 0.26 1.29 0.195 0.00* VA/IC times 0.55 0.26 0.29 0.194 0.00* MI/IC times 0.52 0.25 0.27 0.192 0.00* NB/IC times 0.41 0.24 0.17 0.18 0.00*
Notes: * indicates a 95% significance level; Source: Household survey in 2017 3.4.2 Production Results by Scales
Agricultural in general and chicken production in particular, the selection of suitable production scale is very important for the improvement of economic efficiency. Choosing the appropriate scale of raising does not only rely on subjective factors, namely resources availability, management levels but also other objective factors such
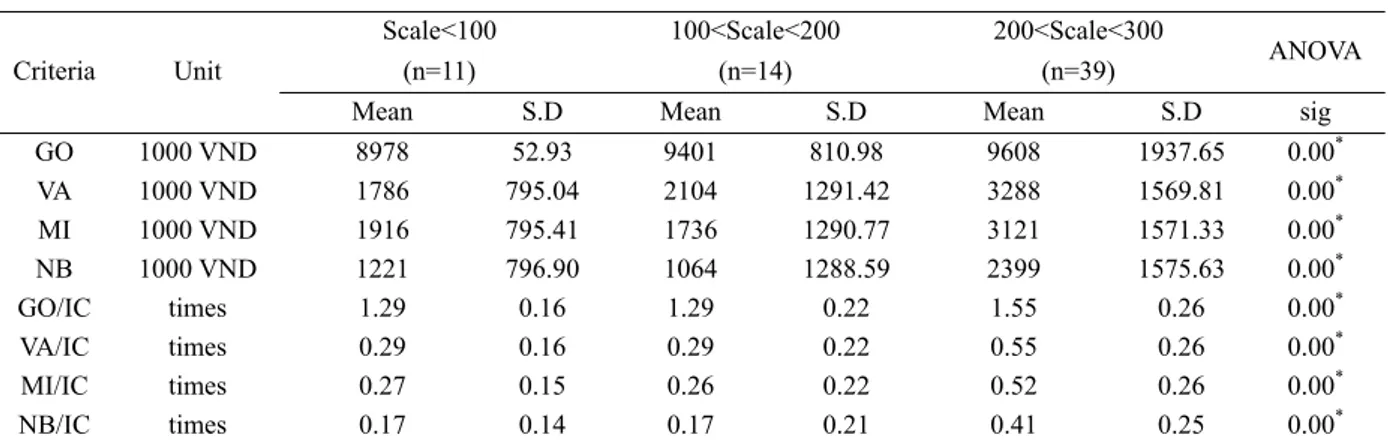
as market price fluctuation, the availability of inputs, the supply and demand relationship for that product. The data presented in Table 8 showing a significant differences in the results of chicken farms at different raising scale. The results of group (3) are highest, which was followed by group (2) and group (1).
Specifically, the results of VA and NB of group (3) are 3,288,000 VND and 2,399,000 VND; group (2) are 2,104,000 VND and 1,064,000 VND; group (1) are 1,786,000 VND and 1,221,000 VND. However, MI of group (1) is higher than that of group (2). The difference is due to the fact that group (1) has lower subsistence costs than that of group (2), meaning that farmers in group (1) use more of their own resources such as raw food and household labor higher.
Thanks to the highest GO and the lowest cost, farmers in the scale of group (3) showing the highest efficiency, which followed by group (1) and group (2). In particular, the farm at scale of group (3) spent 1 VND IC in return of 1.55 VND GO, 0.55 VND VA and 0.52 VND MI and 0.41 NB; chicken farmers of group (2) was 1.58 VND GO, 0.59 VND VA, 0.45 VND MI and 0.35 NB.; chicken farmers of group (1) was 1.29 VND, 0.29 VND VA, 0.27 VND and 0.17 NB. As a result, for this traditional chicken production form, the scale of production from 200 – 300 chicken/cycle/household appear to be the most efficient level.
Table 8. Result indicators by scales (Unit: 1,000 VND/100Kg) Criteria Unit
Scale<100 100<Scale<200 200<Scale<300
ANOVA
(n=11) (n=14) (n=39)
Mean S.D Mean S.D Mean S.D sig
GO 1000 VND 8978 52.93 9401 810.98 9608 1937.65 0.00* VA 1000 VND 1786 795.04 2104 1291.42 3288 1569.81 0.00* MI 1000 VND 1916 795.41 1736 1290.77 3121 1571.33 0.00* NB 1000 VND 1221 796.90 1064 1288.59 2399 1575.63 0.00* GO/IC times 1.29 0.16 1.29 0.22 1.55 0.26 0.00* VA/IC times 0.29 0.16 0.29 0.22 0.55 0.26 0.00* MI/IC times 0.27 0.15 0.26 0.22 0.52 0.26 0.00* NB/IC times 0.17 0.14 0.17 0.21 0.41 0.25 0.00*
Notes: * indicates a 95% significance level; Source: Household survey in 2017 3.5 Determinant of Chicken Production in Thua Thien Hue
To examine factors affecting NB of chicken production in Thua Thien Hue province, the multiple linear regression approach was applied. Before the regression analysis, the data was checked for assumptions of linear model, namely auto correlation, residuals, independence, normality, no multicollinearity, and apparently, it fulfills these criteria. The model has been built with the depend variable is Net Benefit and the independent variables are breeds, feed, veterinary, education, experience, days of raising, scale of raising, mortality, training, breeding types and region.
Table 9. Model Summary
Model R R Square Adjusted R Square Std. Error of the Estimate
1 .737a .543 .436 1150.17
Table 9 indicates R-Square = 0.543, meaning that 54.3% of the variation of Net Benefit may be explained by the variation of independent variables in the model.
Table 10. ANOVA
Model Sum of Squares df Mean Square F Sig.
1 Regression 80205932.66 12 6683827.72 5.052 .000b
Residual 67467562.94 51 1322893.39
Total 147673495.59 63
Table 10 shows that the p-value is 0.000, which is smaller than 0.05, reflecting that the model is meaning. Details about the independent variables and their effect on Net Benefit are shown in table 11. The significant independent variable is highlighted in bold.
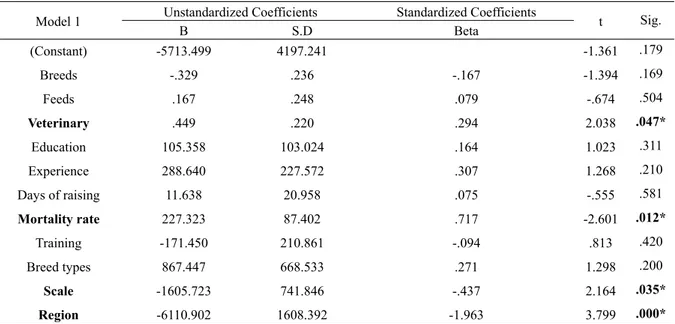
Table 11. Factors affect Net Benefit of chicken production in Thua Thien Hue province
Model 1 Unstandardized Coefficients Standardized Coefficients t Sig.
B S.D Beta (Constant) -5713.499 4197.241 -1.361 .179 Breeds -.329 .236 -.167 -1.394 .169 Feeds .167 .248 .079 -.674 .504 Veterinary .449 .220 .294 2.038 .047* Education 105.358 103.024 .164 1.023 .311 Experience 288.640 227.572 .307 1.268 .210 Days of raising 11.638 20.958 .075 -.555 .581 Mortality rate 227.323 87.402 .717 -2.601 .012* Training -171.450 210.861 -.094 .813 .420 Breed types 867.447 668.533 .271 1.298 .200 Scale -1605.723 741.846 -.437 2.164 .035* Region -6110.902 1608.392 -1.963 3.799 .000*
Note: * indicates a 95% significance level; Source: Household survey in 2017
The Net Benefit of chicken farmers in Thua Thien Hue province is significantly influenced by costs of veterinary, mortality rate, scale of production and region. Specifically, costs of veterinary positively correlated with NB. In particular, when other factors are assumed to unchanged, if the cost of veterinary increase by 1000 thousand VND, the NB would increase by 2.04 thousand VND. As such, contrary to the initial expectation that when costs increase, NB will decrease. In this case, the positive affect of cost of veterinary shows that chicken farms in the study area do not pay enough attention on the proper investment in chicken disease prevention. This is one of the important factors affecting the results of production because by this way of farming, chickens are close to nature, free to look for feeds in the grazing are, so they are very susceptible to disease.
Similarity, scale and region have a positively affected on NB. If the scale of chicken farms increase from group (1) to group (2) and group (2) to group (3), the NB would increase of 2.16 thousand VND. Additionally, the NB of Huong Thuy is greater than that of Nam Dong. In contrast, mortality rate have a negative impact on NB. In particular, when other factors are assumed to unchanged, if the mortality rate increase by 1%, the NB would reduce by 2.6 thousand VND.
Despite the fact that, other independent variables appear to not significantly influence the NB, the signs are still as expected. In particular, the negative sign of variables costs of breed and feed, days of raising are as expected. The more costs the chicken farms have to pay for the breed and feed, the longer day of raising, the less NB they would get. The positive signs of variables, namely education, experience, training are as expected. The more knowledge, experiences or technical support the chicken farms get, the better NB they would gain.
4. Conclusion
This paper analysis the cost and benefit of producing traditional chicken in Thua Thien Hue province, Vietnam. Using detailed survey data obtained from 64 chicken farmers in 2 districts in the Winter-Spring season in 2017, this study find out some remarked results.
Firstly, breed and feed costs share the largest percentage in the total costs of chicken production in the study sites, which are 20 and 66%, respectively. The total costs of chicken production in Huong Thuy, a midland plain, are lower than those in Nam Dong, a mountainous district in Thua Thien Hue province. The main reason for this significant difference is that the extra cost of shipping. This extra cost makes the prices for breed and feed in Nam Dong be higher than in Huong Thuy with the availability of inputs and market for consumption.
Secondly, between the two selected study sites, Huong Thuy tends to have a higher production results and a more efficient levels than those of Nam Dong district. Different indicators, namely, GO, VA, MI, NB or GO/IC, VA/IC, MI/IC and NB/IC in Huong Thuy is significant greater than that in Nam Dong. Furthermore, indicators of results of chicken production are also higher in comparison with other activities, namely pork production or interest of banks at the time of the study.
chicken/cycle appears to be the most efficient scale among the three scale of chicken production in the two districts. This is derived from the highest gross output and the lowest costs of this scale of production among the three groups.
Last but not least, by a multiple linear regression analysis, the study shows that there is a significantly positive influence of veterinary costs and mortality rate on Net Benefit. Other variables, namely, scale of production and region, are also significantly affect the Net Benefit of chicken farms.
The policy implications are clear in which traditional chicken production, with the scale from 200 – 300 chicks/cycle, presents to be an efficient model of production in Thua Thien Hue province. As a result, traditional chicken production should be taken into consideration in policies for rural development as a solution to diversify income for smallholder farmers. Furthermore, regarding to this chicken production form, a serious attention should be pay on the veterinary, diseases prevention to achieve a high level of efficiency.
References
Almli, V. L., Verbeke, W., Vanhonacker, F., Næs, T., & Hersleth, M. (2011). General image and attribute perceptions of traditional food in six European countries. Food Quality and Preference, 22(1), 129-138. https://doi.org/10.1016/j.foodqual.2010.08.008
Ban, N. K., Regalado, J., Hung, N. P., Dung, N. Q., Binh, B. M., & Anh, T. P. (2005). Rattan resource of Bach Ma National Park, Thua Thien Hue province. Agricultural Review, 14.
Berg, H. (2002). Rice monoculture and integrated rice-fish farming in the Mekong Delta, Vietnam-economic and ecological considerations. Ecological economics, 41(1), 95-107. https://doi.org/10.1016/S0921-8009(02)00027-7
Brooks, E. G., Roberton, S. I., & Bell, D. J. (2010). The conservation impact of commercial wildlife farming of porcupines in Vietnam. Biological Conservation, 143(11), 2808-2814.
Burgos, S., Hinrichs, J., Otte, J., & Roland-Holst, D. (2008). Poultry, HPAI and Livelihoods inViet Nam-A Review.
Desvaux, S., Ton, V. D., Phan Dang, T., & Hoa, P. T. T. (2008). A general review and description of the poultry production in Vietnam. A general review and description of the poultry production in Vietnam, 38.
Epprecht, M., Vinh, L., Otte, J., & Roland-Holst, D. (2007). Poultry and poverty in vietnam. HPAI Research Brief, (1).
Hiep, N. L. (2016). Hiệu quả kinh tế chăn nuôi gà ở tỉnh Thừa Thiên Huế (PhD, College of Economics, Hue University, Thua Thien Hue).
Iarossi, G. (2006). The power of survey design: A user's guide for managing surveys, interpreting results, and influencing respondents. World Bank Publications.
Ifft, J., Roland-Holst, D., Sy, A., & Zilberman, D. (2008). Poultry supply chains and market failures in northern Viet Nam. Pro-Poor Livestock Policy Initiative (PPLPI) Research Report (FAO).
Khoa, Đ. V. A., & Mãnh, L. H. (2012). ẢNH HƯỞNG CỦA NHIỆT ĐỘ VÀ ẨM ĐỘ CHUỒNG NUÔI LÊN SỨC KHỎE GÀ ROSS 308. Tạp chí Khoa học Trường Đại học Cần Thơ, 22, 83-95.
Kremen, C., Iles, A., & Bacon, C. (2012). Diversified farming systems: an agroecological, systems-based alternative to modern industrial agriculture. Ecology and Society, 17(4).
Marsh, S. P., & MacAulay, T. G. (2002). Land reform and the development of commercial agriculture in Vietnam: policy and issues. Agribusiness Review, 10, 1-19.
Miers, H. (2008). Poverty, livelihoods and HPAI. HPAI Research Brief, (9).
Muramoto, Y., Le, T. Q. M., Phuong, L. S., Nguyen, T., Nguyen, T. H., Sakai-Tagawa, Y., . . . Kawaoka, Y. (2006). Molecular characterization of the hemagglutinin and neuraminidase genes of H5N1 influenza A viruses isolated from poultry in Vietnam from 2004 to 2005. Journal of veterinary medical science, 68(5), 527-531.
Nam, H. C. N. V. (2002). Chăn nuôi gà thả vườn và gà tây [Kỹ thuật nuôi gà thả vườn. Kỹ thuật nuôi gà tây]. Naska, A., Fouskakis, D., Oikonomou, E., Almeida, M. D. V., Berg, M. A., Gedrich, K., . . . Burr, S. (2006).
Dietary patterns and their socio-demographic determinants in 10 European countries: Data from the DAFNE databank. European Journal of Clinical Nutrition, 60(2), 181-190. https://doi.org/10.1038/sj.ejcn.1602284
Nguyen, T. D., & Spradbrow, P. (1991). Poultry production and Newcastle disease in Vietnam (pp. 169-170). Centre for International Agricultural Research (ACIAR).
Nguyên, T. V. (2015). Nâng cao hiệu quả vốn đầu tư cho phát triển nông nghiệp tỉnh Thừa Thiên Huế. (Tiến sĩ), Trường Đại học Kinh tế, Đại học Huế, Thừa Thiên Huế.
Phan, L. T., Bui, T. M., Nguyen, T. T., Gooley, G. J., Ingram, B. A., Nguyen, H. V., . . . De Silva, S. S. (2009). Current status of farming practices of striped catfish, Pangasianodon hypophthalmus in the Mekong Delta. Vietnam. Aquaculture, 296(3), 227-236.
Slimani, N., Fahey, M., Welch, A., Wirfält, E., Stripp, C., Bergström, E., . . . Chloptsios, Y. (2002). Diversity of dietary patterns observed in the European Prospective Investigation into Cancer and Nutrition (EPIC) project. Public health nutrition, 5(6b), 1311-1328.
Thi Ut, T., & Kajisa, K. (2006). The impact of green revolution on rice production in Vietnam. The Developing Economies, 44(2), 167-189.
Tran, P., Marincioni, F., Shaw, R., & Sarti, M. (2008). Flood risk management in Central Viet Nam: challenges and potentials. Natural Hazards, 46(1), 119-138.
Tran, P., & Shaw, R. (2007). Towards an integrated approach of disaster and environment management: A case study of Thua Thien Hue province, central Viet Nam. Environmental Hazards, 7(4), 271-282.
Trichopoulou, A., Soukara, S., & Vasilopoulou, E. (2007). Traditional foods: a science and society perspective. Trends in Food Science & Technology, 18(8), 420-427. https://doi.org/10.1016/j.tifs.2007.03.007
TTH. (2014). Reviewing, supplementing livestock development planning in Thua Thien Hue province to 2020. Tu, T. D. (2001). Village chicken production in Vietnam and Newcastle disease control with thermostable
vaccine. Paper presented at the ACIAR PROCEEDINGS.
Tuan, T. H., Van Xuan, M., Nam, D., & Navrud, S. (2009). Valuing direct use values of wetlands: A case study of Tam Giang–Cau Hai lagoon wetland in Vietnam. Ocean & Coastal Management, 52(2), 102-112. https://doi.org/10.1016/j.ocecoaman.2008.10.011
Verbeke, W., Guerrero, L., Almli, V. L., Vanhonacker, F., & Hersleth, M. (2016). European consumers’ definition and perception of traditional foods. In Traditional Foods (pp. 3-16): Springer.
Wetterwald, O., Zingerli, C., & Sorg, J.-P. (2004). Non-timber forest products in Nam Dong District, Central Vietnam: ecological and economic prospects. Schweizerische Zeitschrift fur Forstwesen, 155(2), 45-52.
Copyrights
Copyright for this article is retained by the author(s), with first publication rights granted to the journal.
This is an open-access article distributed under the terms and conditions of the Creative Commons Attribution license (http://creativecommons.org/licenses/by/4.0/).