HAL Id: hal-00853420
https://hal-mines-paristech.archives-ouvertes.fr/hal-00853420
Submitted on 14 Nov 2013HAL is a multi-disciplinary open access
archive for the deposit and dissemination of sci-entific research documents, whether they are pub-lished or not. The documents may come from teaching and research institutions in France or abroad, or from public or private research centers.
L’archive ouverte pluridisciplinaire HAL, est destinée au dépôt et à la diffusion de documents scientifiques de niveau recherche, publiés ou non, émanant des établissements d’enseignement et de recherche français ou étrangers, des laboratoires publics ou privés.
André Pineau, Raul de Moura Pinho, Stéphane Pierret, Caroline Mary
To cite this version:
André Pineau, Raul de Moura Pinho, Stéphane Pierret, Caroline Mary. A local approach to creep-fatigue-oxidation interactions in Inco 718 alloy. 13th international conference on fracture, Jun 2013, Beijing, China. 11 p. �hal-00853420�
-1-
A Local Approach to Creep-Fatigue
-Oxidation Interactions in Inco 718 Alloy
André Pineau
1, Raul De Moura Pinho
2,
Stéphane Pierret
2, Caroline Mary
2,
1
Mines ParisTech, Centre des Matériaux, UMR CNRS 7633, BP 97, 91003 Evry Cedex, France
2
Snecma-SAFRAN, Villaroche, 77550 Moissy-Cramayel, France * Corresponding author: [email protected]
Abstract . Understanding and modeling hold time effects on fatigue crack growth rate (FCGR)
above 500 °C in Inco 718DA is a great challenge. Fatigue tests with a trapezoidal wave shape signal including hold times from 90 s to 3600 s were carried out on Inco 718DA with a small grain size (5-15 µm) over a wide range of temperatures (500 °C-650 °C). FCGRs were measured using potential drop technique. SEM observations were carried out to correlate the measured FCGRs with the trans- or inter-granular aspect of the fatigue fracture surfaces. Two regimes must be distinguished. The first regime associated with relatively short hold times can be represented by a power law, where da/dN is proportional to tα, α ~ 0.25. This first regime corresponds to the situation where the fatigue crack does not propagate during the hold time but its propagation takes place during the cyclic part of the loading over a damaged zone ahead of the crack tip. The second regime associated with longer hold times corresponds to the case where crack propagation during hold time (creep crack growth) is predominant. This regime is purely time dependent. Simple models are introduced to describe both regimes.
Keywords: Inco 718, High temperature fatigue, hold time effect, fatigue crack growth
1. Introduction
Inco 718 alloy is a Ni- base superalloy which is widely used in the fabrication of a number of gas turbine components, especially turbine disks, operating at high temperatures (up to 650 °C). Both the low cycle fatigue properties and the fatigue crack growth rate (FCGR) behavior of this material have been investigated in some detail by a number of investigators (see e.g. [1-12]). The creep crack growth resistance of this alloy has also been examined (see e.g. [13-15]). It is also well established that this alloy, like other Ni-base superalloys, is sensitive to oxidation. This oxidation effect depends on the microstructure, in particular the grain size [5]. These studies constitute the basis for the application of a defect tolerance approach. However most of these studies have been limited to relatively short hold times (< 300 s) which are clearly too small compared to in-service conditions. The recent work by Gustafsson et al. [10-12] constitutes one exception. The first aim of the present study is an extension of the effect of hold time, tm, on FCGR over longer times (up to 1
hour). It is also well established that this alloy, like other Ni-base superalloys, is sensitive to oxidation. This oxidation effect depends on microstructure, in particular the grain size [5].
In gas turbine design, the main load cycle is typically defined by the start-up and shut-down of the engine. The loading varies from component to component but often is a combination of both temperature variations and mechanical loads. These two events defining the main load cycle are separated by few hours in the case of an aero engine, and weeks or months in turbines for power generation. When searching for a model for predicting the interaction between pure cyclic damage (PF), creep (C), oxidation (Ox) the following requirements will appear [10] : (i) the interactions between the time dependent and cyclic load need to be separated, (ii) a damage accumulation between the time dependent damage and the cyclic damage must be considered. This is the second aim of the present study.
-2-
The methodology developed in this work is, to some extent, similar to the “local approach to fracture” (LAF) which is now widely used for predicting the variation of fracture toughness of ferritic steels with temperature (see e.g. [16]). However the LAF approach has been much less developed for high temperature applications and for Ni base superalloys. This is the reason why the present study should be considered as a preliminary attempt in this field.
2. Material and experimental procedures
The chemical composition of the material is, in weight%: Ni54,18Cr17,97Fe17,31(Nb+Ta)5,4Mo2,97Ti1Al0,56Co0,14Mn0,08Cu0,03C0,023B0,0041. This heat of Inconel 718
alloy was received as a forged disk. It was given a conventional heat-treatment (720 °C – 8 h + 620 °C – 8 h) directly after forging (DA). This resulted in a small grain size (5 - 15 µm) with particles of the stable phase δ (Ni3Nb), precipitated along the grain boundaries (Fig. 1a) with small
strengthening γ’ (Ni3TiAl) and γ” (Ni3Nb) precipitates (Fig. 1b).
Figure 1. a) Optical micrograph showing the crystalline structure of the material and δ phase particles located at the grain boundaries (in white); (b) SEM observations showing γ’ and γ’’ precipitates within a grain.
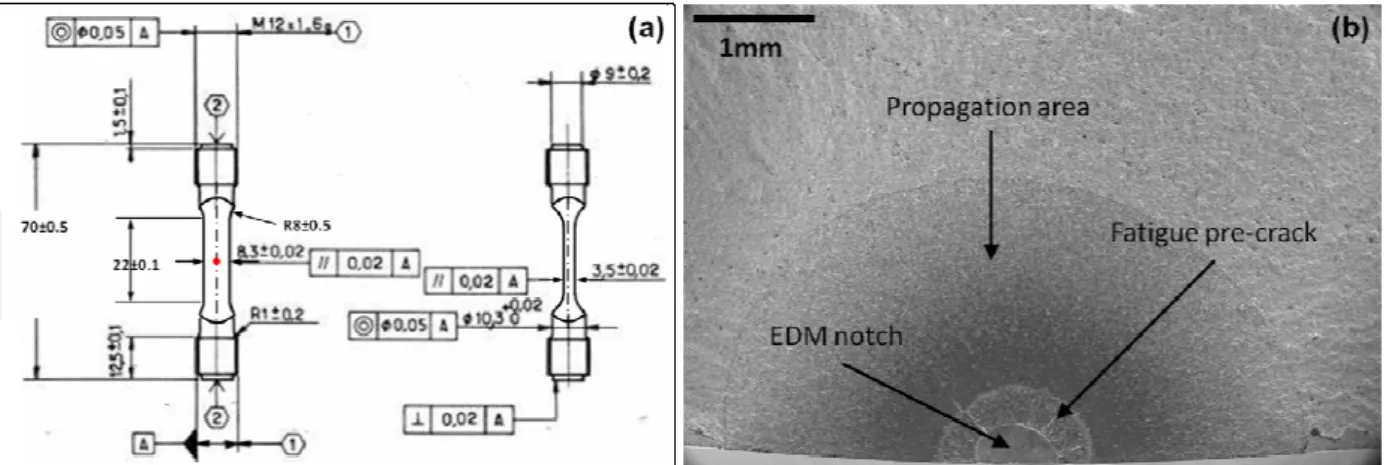
FCGR tests were performed between 500°C and 650°C under an air environment using KBr specimens shown in Figure 2. A small EDM semi-circular notch (depth 0.3mm) was introduced and the specimens were fatigue-precracked at room temperature (RT) and at a frequency of 2 Hz in order to extend the notch over a distance by about 0.3mm (Fig. 2b).
Figure 2. KBr specimens used for fatigue crack growth rate measurements. a) Schematic diagram showing the dimensions (mm) and the position of the EDM notch (red dot); b) Fracture surface of a specimen where the EDM notch (0.3mm), the fatigue pre-crack (0.6mm) and the propagation area can be distinguished.
-3-
Then the specimens were heated up and tested at R ratio of 0.05 where R = Kmin /Kmax. These tests
were performed either under continuous pure fatigue (PF) at 2 Hz or with a trapezoidal shape signal 10/X/10 where 10 is the time (in s) to reach the maximum load and to unload the specimen while X designates the hold time at Kmax in seconds. A potential drop technique which was previously
calibrated was used to measure the crack growth rate expressed in terms of da/dN or da/dt, where N is the number of cycles and t is the total time (rising time + hold time + unloading time). The stress intensity factor (SIF) K was calculated using an expression which was calibrated previously. The measurement of the fatigue crack growth rate was performed following the standard ASTM E647-08.
Scanning electron microscopy (SEM) was used to observe the fracture surfaces of the specimens. A special attention was paid to the fracture surface character, i.e. transgranular with fatigue striations or intergranular.
3. Results
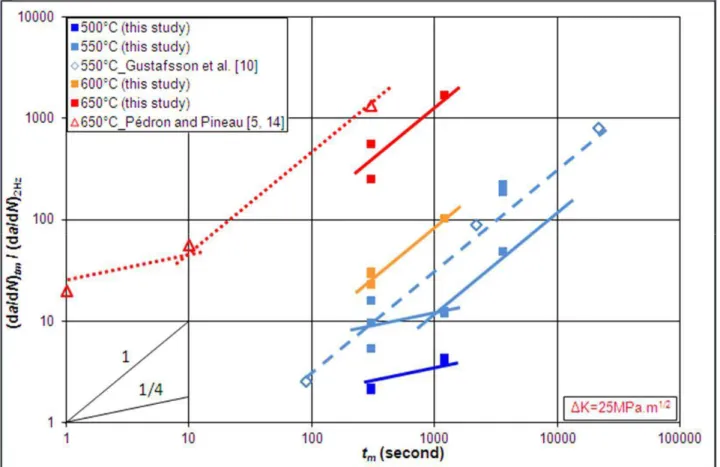
The results of FCGR measurements, da/dN expressed as normalized values, are shown in Figure 3 (da/dN)tm/ (da/dN)2Hz for a given value of ΔK equal to 25 MPa.m1/2. The results reported by Pédron
and Pineau [5] and by Gustafsson et al. [10-12] for a similar ΔK are also included in figure 3.
Figure 3. Normalized fatigue crack growth rate (da/dN)tm / (da/dN)2Hz as a function of hold time, tm. Test
conditions are given in the insert. Squares and full lines indicate data from this study whereas diamonds/dashed line and triangle/dot line represent data from Gustafsson’s [10] and Pédron’s and Pineau’s [5, 14] work. Results obtained for ΔK = 25 MPa.m1/2.
-4-
A close examination to this figure shows that, in all cases, the introduction of a hold time into the fatigue cycle produces an acceleration of the fatigue crack growth rate which can reach up to three orders of magnitude for long hold times and for elevated temperature (650 °C). Two regimes are distinguished in this acceleration of (da/dN)tm. For short hold times (typically 1200 s at 550 °C and
10 s at 650 °C), the slope of the normalized FCGR versus hold times, tm is of the order of 0.20 -
0.40. In this regime (named A), the slope of (da/dN)tmversus tm is assumed to value 0.25 for the
reasons detailed in the following. This regime A extends over hold times lower than a transition time named tihereafter (~ 1200 s at 550 °C and ~ 10 s at 650 °C). This transition time is thus
dependent on temperature. It is also dependent on ΔK but this load dependence is not introduced here because it is out of the scope of the present work.
Figure 3 shows also that when tm > ti, the slope of the (da/dN)tm – tmcurves is close to 1, which
means that in this regime, called hereafter regime B, the crack growth rate is purely time dependent. The a-N records reported by Gustafsson et al. [10] showed that in regime B, the crack propagated during the hold time (see their figures 7 and 8).
A comparison of our results at 550 °C with those reported previously by Gustafsson et al. [10] shows that both materials exhibit similar properties although they experienced different heat treatments. The same comparison at 650 °C with the results reported by Pédron and Pineau [5] indicates that, for the same testing conditions: ΔK = 25 MPa.m1/2, same temperature, same hold time, our material tends to exhibit better fatigue crack propagation properties. These variations in FCGR in the presence of a hold time are related to differences in the microstructure of the materials. In particular our material has a much smaller grain size as compared to those investigated by Pédron and Pineau (d ~ 50 µm) [5].
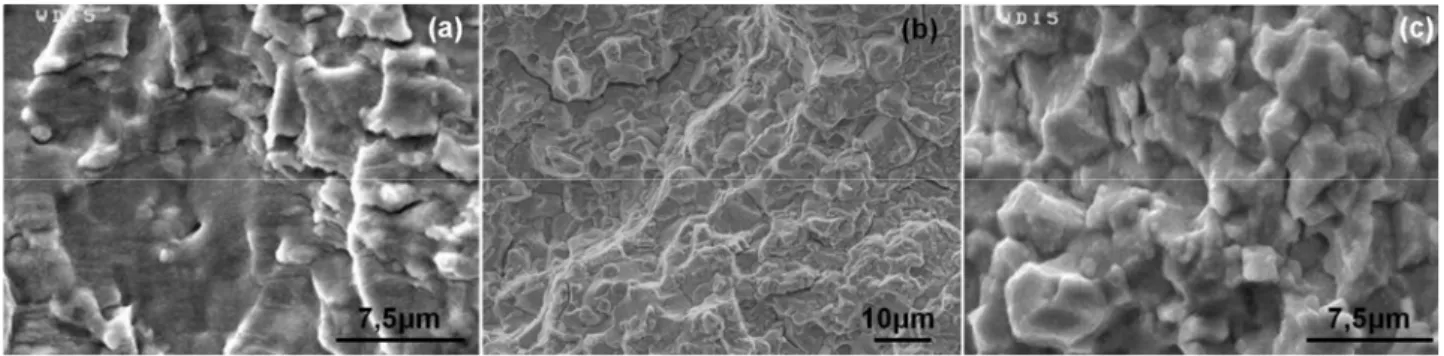
SEM observations showed significant differences in the fracture modes depending on test conditions (Figure 4). At low temperature and for small hold times the fracture mode is purely transgranular with the presence of fatigue striations (Fig. 4a). At increasing temperature and for longer tm, i.e. in the regime B, the fracture mode is purely intergranular, as shown in figures 4c. In
the intermediate regime A, i.e. close to the transition with regime B, the fracture surface is also predominantly intergranular, although less brittle than that observed in regime B. In this particular condition as shown in figure 4b, the fracture mode is mixed, with areas showing features of intergranular and transgranular fracture.
-5-
4. A tentative model in the frame of the local approach to fracture
A simple model based on a linear summation of three components is proposed to account for the effect of hold time on FCGR, i.e.:
(1)
Most terms in Eq. 1 have already been defined. The remaining ones are defined in the following. The three components in Eq. 1 are successively analyzed in more detail.
The first term (da/dN)PF represents the pure fatigue (PF) component. This contribution to FCGR
which is temperature dependent but not environment dependent has already been modeled by Clavel and Pineau [2]. It is enough to say that at low FCGR (< 10-8m/cycle), the crack propagation rate was modeled as successive discontinuous crack jumps according to the first LAF model introduced by McClintock [17] for fatigue. At higher FCGR (~ 10-6 m/cycle) the fatigue damage is associated with the formation of striations. The corresponding crack propagation rate can be described by the crack tip opening displacement (CTOD) first introduced by Pelloux [18]. It is well to remember that, in this regime of FCGR, one observes that the distance between fatigue striations,
i, can simply be expressed as:
where E is the Young’s modulus and σY the yield strength of the material.
The second term in Eq. 1 represents the oxidation component. It is assumed that no crack propagation takes place during the hold time provided that tm< ti. However stress assisted grain
boundary oxidation occurs at the crack tip and produces a damaged zone. This might correspond to the “damaged zone” evidenced by Gustafsson et al. [12]. These authors showed that the extent, x, of this damaged zone could be written as:
(3) (2)
-6-
Several mechanisms have been proposed to account for this oxidation-assisted regime (see e.g. [5, 19-22]). It is out of the scope of the present study to discuss these mechanisms. The results of Gustafsson et al. [10, 12] strongly suggest that the time dependence in this regime can be described by a power law with an exponent of 0.25 (see Eq. 3).
Theoretical results giving the diffusion distance, z, along a grain boundary and the concentration in oxygen along this grain boundary, Cb, in equilibrium with a concentration Co at the free surface,
which is itself in equilibrium with the oxides covering the grain boundary and the matrix surface [21] is given by [23]:
(4) where D is the diffusion coefficient of oxygen through the grain matrix and Db is the grain boundary
diffusion coefficient of oxygen along the grain boundary of thickness, δ. Assuming that fracture occurs during the cyclic part of the loading over a critical distance, z, when Cb reaches a critical
value at that position, Eq. 4 predicts that the crack growth rate will be proportional to t1/4, i.e.:
(5)
The t1/4 time dependence is thus in good agreement with the experiments, especially those reported by Gustafsson et al. [12]. Moreover Eq. 5 predicts that the temperature dependence will be given by an exponential law with activation energy of (Qb/2 – Qm/4) where Qb and Qm are the activation
energies of oxygen along the grain boundaries and through the matrix, respectively. The value of Qb
in nickel is close to 275 KJ/mole [19]. Unfortunately nothing is known about the value of D and Qm.
This shows that further studies are necessary for a better understanding of the damage mechanisms prevailing in the regime A of FCGR.
The transition between regime A and B requires the evaluation of the initiation time ti. It is well to
remember that Riedel and Rice [24] have shown that the viscoplastic strain in creeping solids with a Norton type law can be expressed as:
(6) In this expression, F is a numerical factor which is an increasing function of temperature and which
is equal to 8.34 10-9 at 650°C for plane strain conditions [25] (time in h, K in MPa m1/2, r in m), n is the exponent of the stationary creep law and was found to be around 10 in Inco 718 at 650°C [25]. Assuming that crack initiation takes place during the hold time, when a critical strain εc, is reached
-7-
(7)
where βis a constant. In Eq. 7, εc may be strongly dependent on oxidation as underlined by Diboine
and Pineau [25] (see their figure 9). The parameter C can be evaluated from the tests performed by Pédron and Pineau [5, 14] at 650°C. These tests suggest that ti ≈ 10 s for K = 25 MPa.m1/2 leading
to C ≈ 9.109 (t in s, K in MPa.m1/2). Moreover the critical distance Xc, must be lower than the
calculated creep zone size, Rvp given by [24]:
(8)
with G = 10-8 for Rvp (m), t (h) and K (MPa m1/2) [25]. The parameter G increases with temperature.
This leads to Rvp ≈ 10 µm at 650°C, which is close to the grain size of our material.
These calculations indicate that, within a first approximation, ticould be calculated from Eq. 7 with
Xc equal approximately to the grain size or from Eq. 8 written as Eq. 9:
(9)
The transition time ti in Eq. 1 can thus be evaluated with two expressions (Eqs 7 and 9). However it
appears to be difficult to establish a definite model for the FCGR behavior in regime A in the absence of more detailed measurements of ti and variations of εc with time.
The third term in Eq. 1 can be determined using the FCGR behavior in regime B which is purely time dependent (Figure 3). The creep crack growth (CCG) regime (tm>> ti)has been investigated by
a number of authors (see e.g. [5, 15, 25]). However, the test procedure used by these authors is completely different from ours. They start from a fatigue precrack and then maintain the load constant. This procedure does not allow investigating the initiation and the propagation of a crack in a continuously creep-oxidation damaged material. Our test procedure allows us avoiding the tail of the curves observed in most CCG rate measurements reported in the literature. An attempt was made to model these transient curves observed in stainless steel [26]. These tails lead to an apparent threshold in K which is load and time dependent, as clearly shown elsewhere [25]. In our tests the CCG rate component is simply obtained by noting that for long tm the third term in Eq. 1 is much
larger than the two other ones. This means that the CCG rate, (da/dt)crat a given temperature, can
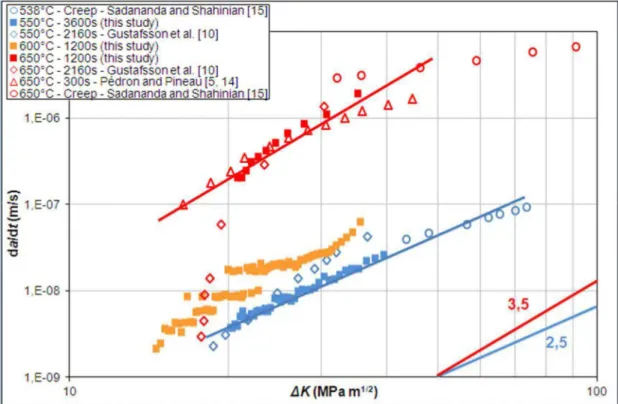
simply be obtained using Eq. 1 with long hold times only (3600 s at 550 °C, 1200 s at 600 °C and 650 °C). The results are shown in figure 5 where test results by Gustafsson et al. [10] obtained with long hold times (2160 s) have also been included. A good agreement between both sets of results is observed which suggests that crack propagation in regime B is not too much dependent on microstructural details. The results obtained by Sadananda and Shahinian [15] are also included in figure 5 but, as these authors have investigated the propagation of a fatigue precrack under constant
-8-
load, the results obtained by Sadananda and Shahinian and corresponding to the “steady” state regime are included in figure 5 to avoid the transient regime. Their results are also close to ours and to those of Gustafsson et al. [10], reinforcing our conclusion on the moderate effect of microstructure in this regime of crack propagation.
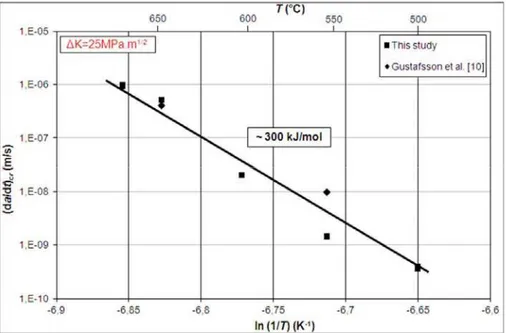
The slope of the (da/dt)crcurves drawn in figure 5 is between 2 and 4. The temperature dependence
is indicated in figure 6 where an apparent activation energy of the order of 300 KJ/mole is observed from our tests and Gustafsson et al. experiments [10]. This energy is close to the activation energy for oxygen grain boundary diffusion (274 KJ/mole) in nickel, as noted earlier. It is clear that the CCG rate behavior is also affected by oxidation and can be described as successive crack jumps over a critical distance (≈ Rvp) with lasting times of the order of the transition time tidefined earlier
by Eq. 7. This simple approach leads to a predicted slope of the (da/dt)cr – K curves of 2(2n2 – n-1) /
(n-1), i.e. to a slope close to 4n for sufficiently large values of the exponent n. This predicted slope is much higher than the slope indicated in figure 6 which was found to be between 2 and 4. However this simplified approach is valid only when it can be assumed that the critical creep strain, εc (Eq. 7) is constant. This assumption is not valid when the tests are carried out under air
environment. Results of CCG rate measurements under vacuum [27] showed that the slope of the (da/dt)cr– K curves was much higher (> 20) compared to those determined in air environment.
These large values of the slope under vacuum are thus in better agreement with the predicted value of ~ 4n. This indicates that it is necessary to develop more sophisticated models when the material is tested under air environment. These models must include a variation of the critical creep strain ahead of the crack tip with oxygen grain boundary diffusion given by Eq. 4.
Figure 5. Creep crack growth rate versus ΔK curves corresponding to regime B (see text). The results by Gustafsson et al. (diamonds) [10] and Pédron and Pineau (triangles) [5, 14] obtained under similar conditions and those reported by Sadananda and Shahinian (circles) [15] using fatigue precracked specimens are shown.
-9-
Figure 6. Creep crack growth rate as a function of 1/T (log scale). The slope giving the activation energy is indicated.
5. Conclusions
1. This study has confirmed that Inco 718 alloy exhibits a strong dependence to hold time, tm ,
effect when tested at elevated temperature (500 °C – 650 °C) in air environment with fatigue cycles including long hold times (< 1 h). These results are in good agreement with other results published in the literature. The tm dependence is related to a combination of creep strain accumulation ahead
of the crack tip and detrimental effect of oxidation.
2. A simple linear damage accumulation law has been proposed to account for this hold time effect. This law includes three terms: (i) a pure fatigue component, (ii) an oxidation component (Regime A), and (iii) a pure creep component (Regime B).
3. The oxidation component (da/dN)oxleads to an acceleration in fatigue crack growth rate
proportional to (tm)α, where α is close to 0.25. This component prevails for hold times, tmlower
than a critical transition time, ti, which is a decreasing function of temperature.
4. The pure creep component (da/dt)cr gives rise to a crack growth rate proportional to hold
time, tm. It is better to determine this component using cyclic tests with hold times, similar to those
of the present study, than using fatigue precracked specimens submitted to a steady load.
5. An attempt has been made to model the time dependent regimes A and B. It has been shown that Regime A can be interpreted as resulting either from the kinetics of oxygen diffusion or from creep damage accumulation. Both explanations are more complementary than contradictory. An estimate of the transition time tibetween regimes A and B has been given. Regime B which
occurs for very long hold times has been interpreted as a pure creep crack growth. It has been shown that the crack growth rate in regime B is an increasing function of hold time with apparent
-10-
activation energy close to the activation energy for oxygen diffusion along the grain boundaries.
References
[1] D. Fournier, A. Pineau, Low cycle fatigue behavior of Inconel 718 at 298K and 823K, Met. Trans. 8A, 1977, pp. 1095-1105.
[2] M. Clavel, A. Pineau, Frequency and waveform effects on the fatigue crack growth behavior of alloy 718 at 298K and 823K, Met. Trans. 9A, 1978, pp. 471-480.
[3] M. Clavel, A. Pineau, Fatigue behaviour of two nickel-base alloys I: Experimental results on low cycle fatigue, fatigue crack propagation and substructure, Mat. Sci. Eng. 25, 1982, pp. 157-171; II: Physical modeling of the fatigue crack propagation process, Mat. Sci. Eng. 25, 1982, pp. 173-180.
[4] L.A. James, W.J. Mills, Effect of heat treatment and heat-to-heat variations in the fatigue crack growth response of alloy 718, Engng. Fract. Mech. 22, 1985, pp. 797-817.
[5] J.P. Pédron, A. Pineau, The effect of microstructure and environment on the crack growth behaviour of Inconel 718 alloy at 650°C under fatigue, creep and combined loading, Mat. Sci. Eng. 56, 1982, pp. 143-156.
[6] J.E. King, Fatigue crack propagation in nickel-base superalloys – Effects of microstructure, load ratio and temperature, Mat. Sci. Eng. 3, 1987, pp. 750-764.
[7] H.H. Smith, D.J. Michel, Effect of environment on fatigue crack propagation behavior of alloy 718 at elevated temperature, Met. Trans. 17A, 1986, pp. 370-374.
[8] M.R. Bache, W.J. Evans, M.C. Hardy, The effects of environment and loading waveform on fatigue crack growth in Inconel 718, Int. J. Fatigue, 21, 1999, pp. S69-S77.
[9] G.A. Osinkulu, G. Onofrio, M. Marchionni, Fatigue crack growth in polycrystalline IN 718 superalloy, Mat. Sci. Eng., A 356, 2003, pp. 425-433.
[10] D. Gustafsson, J.J. Moverare, S. Johansson, K. Simonsson, M. Hörnqvist, T. Månsson, S. Sjöström, Influence of high temperature hold times on the fatigue crack propagation in Inconel 718, Int. J. Fatigue, 33, 2011, pp. 1461-1469.
[11] M. Hörnqvist, T. Månsson, D. Gustafsson, High temperature fatigue crack growth in Alloy 718 – Effect of tensile hold times, Proc. Eng., 10, 2011, pp. 147-152.
[12] D. Gustafsson, J. Moverare, K. Simonsson, S. Johansson, M. Hörnqvist, T. Månsson, S. Sjöström, Fatigue crack growth behaviour of Inconel 718 – The concept of a damaged zone caused by high temperature hold times, Proc. Eng., 10, 2011, pp. 2821-2826.
[13] S. Floreen, The creep fracture of wrought nickel-base alloys by a fracture mechanics approach, Met. Trans. 6A, 1975, pp. 1741-1749.
[14] J.P. Pédron, A. Pineau, Influence de l’oxydation sur la propagation des fissures à haute température dans l’alliage Inconel 718, Mémoires et Etudes Scientifiques Revue de Métallurgie, 1983, pp. 665-674.
[15] K. Sadananda, P. Shahinian, Creep crack growth in Alloy 718, Met. Trans. 8A, 1977, pp. 439-449.
[16] A. Pineau, Development of the local approach to fracture over the past 25 years: Theory and applications, Int. J. Fracture, 138, 2006, pp. 139-166.
[17]F.A. McClintock, On the plasticity of the growth of fatigue cracks, in D.C. Drucker, J.J. Gilman, Fracture of solids, Interscience Publishers, John Wiley & Sons, New York, London, 1962, pp. 65-102.
[18] R.M. Pelloux, Mechanisms of formation of ductile striations, ASM Trans., 62, 1969, pp. 221-285.
[19] D.A. Woodford, Gas phase embrittlement and time dependent cracking of nickel based superalloys, Energy Materials 1, 2006, pp. 59-79.
-11-
[20] A. Pineau, Fatigue and creep-fatigue behaviour of Ni-base superalloys: Microstructural and environmental effects in M. Branco, R. Ritchie, V. Sklenicka, Mechanical behaviour of materials at high temperature, NATO ASI Series, Kluwer Academic Publishers, Dordrecht, Boston, London, 1995, pp. 135-167.
[21] R. Molins, G. Hochstetter, J.C. Chassaigne, E. Andrieu, Oxidation effects on the fatigue crack growth behaviour of Alloy 718 at high temperature, Acta Mater., 45, 1997, pp. 663-674.
[22] H. Ghonem, D. Zheng, Depth of intergranular oxygen diffusion during environment-dependent fatigue crack growth in alloy 718, Mater. Sci. Eng., A150, 1992, pp. 151-160.
[23] I. Kaur, Y. Mishin, W. Gust, Fundamentals of grain and interphase boundary diffusion, John Wiley & Sons, New York, 1995.
[24] H. Riedel, Fracture at high temperatures, MRE, Springer-Verlag, Berlin, Heidelberg, New York, 1987.
[25] A. Diboine, A. Pineau, Creep crack initiation and growth in Inconel 718 alloy at 650°C, Fatigue Fract. Engng. Mater. Struct., 10, 1987, pp. 141-151.
[26]E. Maas, A. Pineau, Creep crack growth behaviour of type 316L steel, Eng. Fracture Mechanics, 22, 1985, pp. 305-325.
[27] J. Charpigny, Fissuration sous fluage dans l’Inconel 718, PhD thesis, Ecole des Mines de Paris, 1981.