HAL Id: hal-01503354
https://hal.archives-ouvertes.fr/hal-01503354
Submitted on 11 Apr 2017HAL is a multi-disciplinary open access
archive for the deposit and dissemination of sci-entific research documents, whether they are pub-lished or not. The documents may come from teaching and research institutions in France or abroad, or from public or private research centers.
L’archive ouverte pluridisciplinaire HAL, est destinée au dépôt et à la diffusion de documents scientifiques de niveau recherche, publiés ou non, émanant des établissements d’enseignement et de recherche français ou étrangers, des laboratoires publics ou privés.
Strain-Rate Dependency of Shear Strength for a Highly
Overconsolidated Clay
Jian Han, Christophe Dano, Pierre-Yves Hicher, Zhen-Yu Yin
To cite this version:
Jian Han, Christophe Dano, Pierre-Yves Hicher, Zhen-Yu Yin. Strain-Rate Dependency of Shear Strength for a Highly Overconsolidated Clay. Geo-Shanghai 2014, 2014, Shanghai, China. pp.343-352, �10.1061/9780784413388.035�. �hal-01503354�
Strain-Rate Dependency of Shear Strength for A Highly Overconsolidated Clay
Jian Han1, Christophe Dano1, Pierre-Yves Hicher1and Zhen-Yu Yin1,2
1LUNAM University, Ecole Centrale de Nantes, GeM UMR CNRS 6183, Nantes
44321, France; email: jian.han@ec-nantes.fr; christophe.dano@ec-nantes.fr; pierre-yves.hicher@ec-nantes.fr.
2Department of Civil Engineering, Shanghai Jiao Tong University, Shanghai 200240,
China; email: zhenyu.yin@gmail.com.
ABSTRACT: The paper summarizes the results from undrained triaxial compression
tests on Merville clay, a highly overconsolidated clay at Merville in the north of France. The specimens were prepared in four different overconsolidation ratios (OCR=7, 14, 28, 56), and for each OCR, undrained shear tests were performed using three or four axial strain rates varying from 0.26 %/h to 25.89 %/h. The strain-rate dependency of the undrained stress level q/qf, the pore pressure, the effective stress
path and the stress ratio q/p' were investigated. The undrained shear strength was found to increase with the strain rate. The shear band formation during loading was observed for all strain rates. For each OCR test series, a linear relationship between the normalized peak deviatoric stress and the strain rate was obtained in the semi-logarithm plane. As OCR increasing, the slope of best-fitting line for the linear relationship increases. Therefore, the strain rate influence on the normalized undrained shear strength is greater for higher OCRs.
INTRODUCTION
The effect of strain rate on mechanical properties of soils has important engineering implications. In particular, parameters inferred from in situ tests (estimated strain rate aa =103-105 %/h) and standard laboratory measurements
(conducted at aa=0.5-5 %/h) must be carefully considered during the selection of
design parameters fo Díaz-Rodríguez et al. 2009).
Various studies reported in the literature show that different soils, for example, sands, weak rocks and soft clays, have different responses to changes in strain rate (Casagrande & Wilson 1951; Lo & Morin 1972; Lefebvre & LeBoeuf 1987). Some comprehensive researches on reconstituted clay have been done by Sheahan et al. (1996) and Zhu and Yin (2000), with OCR varying from 1 to 8. Progress in quantifying and understanding undrained strain rate effects requires additional
comprehensive data on a variety of soil types. There are not many reliable data available on the time-dependent behaviour of stiff clays with different OCRs, particularly natural stiff clays. Some laboratory tests for London clay with different strain rates have been conducted by Sorensen et al. (2007). But the influence of OCR on the strength behaviour was not analyzed.
Thus, this paper focuses on investigating the influence of strain rate and OCR on the strength behaviour of a natural stiff clay.
EXPERIMENTAL PROGRAM Description of the clay testedSs
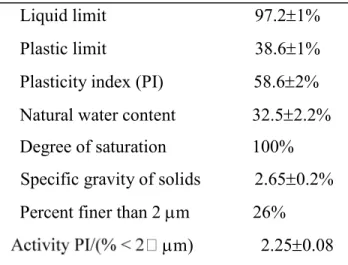
Merville clay was deposited in the Flanders Region which are now located at the northern France, Belgium and the southeast of England. It was covered by tertiary sedimentation. The soil surface then stood probably about 200 m above the present surface of the clay. The formations overlying the clay and the top of it were later eroded. This erosion process was sustained to Quaternary era, when Flandrian alluvial soils were deposited on the clay remaining in place which has thus an effective vertical stress much lower than that was applied to the Pliocene. Thus, the clay is known as a stiff, heavily overconsolidated clay (Josseaume 1998). This study deals with the undrained stress-strain behaviour of Merville clay sampled at a depth greater than 3 meters (thickness of the clayey silt layer above the tested clay). Undisturbed samples at a depth of 9-11 m were selected. The clayey specimens have a uniform appearance in the form of a dark gray material. Table 1 shows typical physical properties of the tested clay.
Table 1. Physical Properties of Undisturbed Merville Clay.
Liquid limit 97.21% Plastic limit 38.61% Plasticity index (PI) 58.62% Natural water content 32.52.2% Degree of saturation 100% Specific gravity of solids 2.650.2% Percent finer than 2 m 26%
m) 2.250.08
Test program and procedure
Tests performed in this study include 1D compression test at constant strain rate and isotropically consolidated undrained triaxial compression (denoted CIUC) tests of overconsolidated Merville clay sheared under a constant strain rate.
1D compression test was done using a Wykeham Farrance testing machine which is a strain controlled machine. The range is 0.00001-9.99999 mm/min. CIUC tests were carried out using a computer-controlled GDS triaxial testing system.
The specimen for 1D compression test was 70 mm in diameter and 19 mm in high. The axial strain rate used in this test was 0.63 %/h (0.002 mm/min). During loading, the drainage was permitted from both sides of the specimen. The strain rate was chosen small enough so that no excess pore pressure was generated during loading.
The specimens for undrained triaxial compression tests were 35 mm in diameter and 70 mm in high. Four different axial strain rates were selected: 0.26 %/h, 0.52 %/h, 2.57 %/h and 25.89 %/h. The B value was checked and found to be greater than 96%. Specimens were isotropically consolidated at different effective consolidation pressures (=50 kPa, 100 kPa, 200 kPa and 400 kPa, respectively) for more than 72 h. After the isotropic consolidation, the cell pressure was held constant, and specimens were sheared to failure at a constant rate of axial strain. The pore pressure was measured at the bottom of the specimen.
When carrying out triaxial tests, we used filter paper strips as side drains which were placed on the lateral surface of each specimen. The purpose was to ensure that the pore water redistribution was completed within a shorter period of time, so that even at a strain rate of 25.89 %/h the uniformity of the pore pressure within the specimen could be assured.
TEST RESULTS
One-dimensional compression test
Fig. 1 shows the result of one-dimensional compression test, giving the void ratio e versus the logarithm of the vertical effective stress 'v.
From Fig. 1, the compression index Cc was measured equal to 0.711, and the
swelling index increases (Cs2> Cs1) as the material is subjected to high stresses due to
structural damage.
As mentioned above, the undisturbed samples are from the depth of 9-11 m, which means that the in situ vertical effective stress varied from 100 kPa to 150 kPa because of the variation of ground water table. The preconsolidation pressure obtained from this one-dimensional compression test, following the Casagrande method, is approximately 2750 kPa, giving an overconsolidation ratio of more than 18.
Overview of CIUC tests
In this study, four series of undrained triaxial compression tests with OCR=7, 14, 28, and 56 were performed. Table 2 presents the results of tests on overconsolidated specimens. It gives the pre-shear consolidation stress condition (effective consolidation pressure '0, actual OCR and back pressure ub), and stress-strain
properties at the peak deviatoric stress (failure) and at maximum excess pore pressure during shearing.
Table 2. Results of CIUC Tests on Stiff Merville Clay.
OCR '0 (kPa) a a (%/h) (kPa)ub At maximum excess
pore pressure At peak deviatoric stress
au
(%) (kPa)um (%)aq (kPa)qf (kPa)uf
(a) OCR=7 6.86 6.88 6.88 401 400 400 0.26 2.57 25.89 500 500 500 2.31 2.54 3.06 168 168 194 2.61 3.14 3.64 631 690 769 164 160 185 (b) OCR=14 13.82 13.75 13.75 199 200 200 0.26 2.57 25.89 501 500 501 2.99 3.09 3.30 117 117 116 3.49 3.33 3.70 427 484 532 107 116 114 (c) OCR=28 27.50 27.23 27.23 27.78 100 101 101 99 0.26 0.52 2.57 25.89 700 699 700 701 2.37 2.38 2.47 2.61 82 82 89 78 3.70 3.20 2.96 3.10 371 387 415 455 65 78 81 74 (d) OCR=56 53.92 55.00 56.12 51 50 49 0.26 2.57 25.89 499 500 501 1.60 1.55 2.13 41 37 37 2.92 2.50 2.69 312 337 383 35 34 31 Values of interest for comparative study in this paper are presented in Table 2, where um is the maximum excess pore pressure, au is the axial strain corresponding
toum, qf is the peak deviatoric stress, and aq and uf are the axial strain and excess
less than the aq, which means the maximum excess pore pressure um is reached
earlier than the peak shear stress qf.
Tests at OCR=7
Fig. 2a presents the relationship between stress level and axial strain for the test series with OCR=7. Strain localization and shear band formation were observed within these overconsolidated specimens even at the lowest strain rate. The axial strain corresponding to the peak stress increases with an increase in the strain rate. Fig. 2b presents the relationship between excess pore pressure level and axial strain. The axial strain corresponding to the maximum pore pressure increases with an increase in the strain rate.
The relationship between stress ratio and axial strain is shown in Fig. 2c, where p' = ('1+2'3)/3 is the mean effective stress. These three curves almost coincide during
the first stages of the loading and then diverge before the peak of the stress-strain curve. Fig. 2d shows that higher strain rates correspond to larger peak stresses. The best-fitting line for the relationship between the normalized peak stress and the axial strain rate can be represented by a straight line in a semi-logarithmic plane.
0 0.2 0.4 0.6 0.8 1 1.2 0 5 10 15 20 Axial strain a (%) S tr es s lev el q /q f 0.26%/h 2.57%/h 25.89%/h (a) 0 0.2 0.4 0.6 0.8 1 1.2 0 5 10 15 20 Axial strain a (%) P o re p re ss u re lev el u/ u m ax 0.26%/h 2.57%/h 25.89%/h (b) 0 0.5 1 1.5 2 0 5 10 15 20 Axial strain a (%) S tr es s ra ti o q /p ' 0.26%/h 2.57%/h 25.89%/h (c) y = 0.172Log(x) + 1.671 R2 = 0.994 0 1 2 3 4 0.1 1 10 100 Axial strain-rate (%/h) No rm . p ea k s tr es s qf / '0 Test results Fitting curve (d)
Fig. 2. Tests at OCR=7: (a) Stress level versus axial strain. (b) Excess pore pressure level versus axial strain. (c) Stress ratio versus axial strain. (d)
Tests at OCR=14, 28 and 56
Figs. 3 to 5 present the relationship between stress level and axial strain (a), the relationship between excess pore pressure level and axial strain (b), the relationship between stress ratio and axial strain (c), and the relationship between normalized peak stress and axial strain rate (d) for the test series with OCR=14, 28 and 56, respectively. Strain localization and shear band formation were observed in these overconsolidated specimens for the tests at the three strain rates. The values of the axial strain corresponding to the peak stress and the maximum pore pressure are almost equal. Figs. 3a to 5a show that the stress-strain curves are almost identical before reaching the peak stress, which means that the evolution of stress level is almost independent of the strain rate before reaching the peak stress. The same phenomenon is observed in Figs. 3b to 5b for the evolution of the pore pressure.
Figs. 3d to 5d show that higher strain rate leads to higher peak stress. The best-fitting line for the relationship between the normalized peak stress and the axial strain rate can also be represented by a straight line in a semi-log diagram.
0 0.2 0.4 0.6 0.8 1 1.2 0 5 10 15 20 Axial strain a (%) S tr es s lev el q /q f 0.26%/h 2.57%/h 25.89%/h (a) 0 0.2 0.4 0.6 0.8 1 1.2 0 5 10 15 20 Axial strain a (%) P o re p re ss u re lev el u / um ax 0.26%/h 2.57%/h 25.89%/h (b) 0 0.5 1 1.5 2 2.5 3 0 5 10 15 20 Axial strain a (%) S tr es s ra ti o q /p ' 0.26%/h 2.57%/h 25.89%/h (c) y = 0.263Log(x) + 2.296 R2 = 0.998 0 2 4 6 8 0.1 1 10 100 Axial strain-rate (%/h) N or m . pe ak s tr es s q f / ' 0 Test results Fitting curve (d)
Fig. 3. Tests at OCR=14: (a) Stress level versus axial strain. (b) Excess pore pressure level versus axial strain. (c) Stress ratio versus axial strain. (d)
0 0.2 0.4 0.6 0.8 1 1.2 0 5 10 15 20 Axial strain a (%) Str es s lev el q /qf 0.52%/h 2.57%/h 25.89%/h (a) -0.8 -0.4 0 0.4 0.8 1.2 0 5 10 15 20 Axial strain a (%) Po re p res su re l ev el u / uma x 0.52%/h 2.57%/h 25.89%/h (b) 0 0.5 1 1.5 2 2.5 3 0 5 10 15 20 Axial strain a (%) St re ss r at io q /p ' 0.52%/h 2.57%/h 25.89%/h (c) y = 0.418Log(x) + 3.969 R2 = 0.999 0 2 4 6 8 0.1 1 10 100 Axial strain-rate (%/h) N or m . p ea k st re ss q f / ' 0 Test results Fitting curve (d)
Fig. 4. Tests at OCR=28: (a) Stress level versus axial strain. (b) Excess pore pressure level versus axial strain. (c) Stress ratio versus axial strain. (d)
Normalized peak shear stress versus axial strain rate. Analysis of the test results
Fig. 6a presents the effective stress paths at different confining pressures (50 kPa, 100 kPa, 200 kPa and 400 kPa) and at different strain rates (0.26 %/h, 2.57 %/h and 25.89 %/h). We obtained three parallel failure lines for the three different strain rates (Fig. 6a). Thus, the apparent friction angle, ', appears independent of the strain rate. Its mean value is 24°.
Fig. 6b shows the relationships between the normalized undrained shear strength (qf/'0) and the axial strain rate (aa) summarized from Fig. 2d, Fig. 3d, Fig. 4d, and
Fig. 5d. For each OCR, the set of test points is fitted with a straight line in a semi-log diagram, and the equations of these lines are shown in the figure. The slope of each line reflects the rate of the undrained strength increase with the strain rate. To characterize the influence of the strain rate on the shear strength, Zhu & Yin (2000) suggested that the undrained shear strength varies almost linearly with the logarithm of the strain rate, expressed as follows:
f/ '0 log q a q
a (1)where q is the slope of each straight line shown in Fig. 2d, Fig. 3d, Fig. 4d, and Fig.
0 0.2 0.4 0.6 0.8 1 1.2 0 5 10 15 20 Axial strain a (%) S tr es s lev el q /q f 0.26%/h 2.57%/h 25.89%/h (a) -1.6 -1.2 -0.8 -0.4 0 0.4 0.8 1.2 0 5 10 15 20 Axial strain a (%) P o re p re ss u re lev el u / um ax 0.26%/h 2.57%/h 25.89%/h (b) 0 0.5 1 1.5 2 2.5 3 0 5 10 15 20 Axial strain a (%) S tr es s ra ti o q /p ' 0.26%/h 2.57%/h 25.89%/h (c) y = 0.717Log(x) + 6.588 R2 = 0.974 0 2 4 6 8 10 0.1 1 10 100 Axial strain-rate (%/h) No rm . p ea k s tr es s qf / '0 Test results Fitting curve (d)
Fig. 5. Tests at OCR=56: (a) Stress level versus axial strain. (b) Excess pore pressure level versus axial strain. (c) Stress ratio versus axial strain. (d)
Normalized peak shear stress versus axial strain rate.
For OCR=7, 14, 28 and 56, the values of the slopes are 0.172, 0.263, 0.418 and 0.717, respectively.
Fig. 6c shows the relationship between q and OCR, in which q appears to
increase with an increase in OCR. It can be concluded that for Merville clay the strain rate influence on the normalized undrained shear strength is greater for higher OCRs.
CONCLUSIONS
A total of thirteen undrained triaxial tests on isotropically consolidated Merville clay with OCR up to 56 were carried out at different axial strain rates. The influence of OCR and strain rate on the undrained shear strength behaviour was studied.
The following conclusions can be drawn from this study:
(1) For undrained triaxial tests, higher strain rate results in higher undrained shear strength for OCRs ranging from 7 to 56 for Merville clay within the strain-rate range tested. Strain localization and shear band formation develop systematically during shearing at any strain rate.
(2) There are three parallel failure lines for the three different strain rates. Thus, the apparent friction angle of Merville clay appears independent of the strain rate. Its mean value is equal to 24°.
(3) For each OCR test series, the relationship between the normalized peak strength and the axial strain rate can be fitted by a straight line in a semi-logarithmic plot.
(4) For each OCR test series, the value of the strain-rate coefficient,q, calculated from Eq.(1) was determined by the slope of the fitting line shown in Fig. 6b. The value of q increases with OCR increasing. Hence, it can be concluded that for
Merville clay the strain rate influence on the normalized undrained shear strength is more pronounced for higher OCRs.
Further experiments will be carried out on reconstituted samples, in order to obtain a better understanding of the strain-rate effect and the influence of OCR in intact and reconstituted samples of Merville clay.
0 100 200 300 400 0 100 200 300 400 500 600 ('1+'3)/2 (kPa) ( '1 - '3 )/2 ( k P a) 0.26%/h 2.57%/h 25.89%/h '=24° (a) y = 0.172Log(x) + 1.671 y = 0.263Log(x) + 2.296 y = 0.418Log(x) + 3.969 y = 0.717Log(x) + 6.588 0 2 4 6 8 10 0.1 1 10 100 Axial strain-rate (%/h) No rm . p e a k str e ss q f / ' 0 Test results Fitting curve OCR=56 OCR=28 OCR=14 OCR=7 (b) y = 0.011x + 0.103 R2 = 0.999 0 0.2 0.4 0.6 0.8 1 0 20 40 60 OCR q CIU tests Linéaire (CIU tests) (c)
Fig. 6. (a) Undrained effective stress paths at different strain rates. (b) Relationship between normalized peak shear stress and axial strain rate. (c)
Relationship between qand OCR.
ACKNOWLEDGMENTS
This research was financially supported by China Scholarship Council (CSC), the ANR project SOLCYP. These supports are greatly appreciated.
Bjerrum, L. (1973). "Problems of soil mechanics and construction on soft clays and structurally unstable soils." Proc. 8th Intl. Conference on Soil Mechanics and
Foundation Engrg., Moscow, 3: 111-159.
Casagrande, A. and Wilson, S.D. (1951). "Effect of rate of loading on the strength on clays and shales at constant water content." Géotechnique. 2(3): 251-263.
- , -Vasquez, J.J. and Santamarina, J.C. (2009). "Strain-rate effects in Mexico city soil." J. Geotechnical and Geoenvironmental Engrg. 135(2): 300-305.
Graham, J., Crooks, J.H.A. and Bell, A.L. (1983). "Time effects on the stress-strain behaviour of natural soft clays." Géotechnique. 33(3): 327-340.
Josseaume, H. (1998). "Engineering properties of the Flanders clay at Dunkerque and Calais." Revue Française de Géotechnique. 84: 3-26.
Lo, K.Y., and Morin, J.P. (1972). "Strength anisotropy and time effects of two sensitive clays." Canadian Geotech. J. 9: 261-277.
Lefebvre, G. and LeBoeuf, D. (1987). "Rate effects and cyclic loading of sensitive clays." J. Geotech. Engrg., ASCE, 113(5): 476-489.
Sheahan, T.C., Ladd, C.C. and Germaine, J.T. (1996). "Rate-dependent undrained shear behavior of saturated clay." J. Geotech. Engrg., ASCE, 122(2): 99-108. Sorensen, K.K., Baudet, B.A. and Simpson, B. (2007). "Influence of structure on the
time-dependent behaviour of a stiff sedimentary clay." Géotechnique. 57(1): 113-124.
Yin, Z.Y. and Hicher, P.Y. (2008). "Identifying parameters controlling soil delayed behaviour from laboratory and in situ pressuremeter testing." Intl. J. Numer. Anal.
Methods Geomech. 32(12): 1515-1535.
Zhu, J.G. and Yin, J.H. (2000). "Strain-rate-dependent stress-strain behavior of overconsolidated Hong Kong marine clay." Canadian Geotech. J. 37: 1272-1282.