HAL Id: hal-01601127
https://hal.archives-ouvertes.fr/hal-01601127
Submitted on 3 Apr 2019
HAL is a multi-disciplinary open access
archive for the deposit and dissemination of
sci-entific research documents, whether they are
pub-lished or not. The documents may come from
teaching and research institutions in France or
abroad, or from public or private research centers.
L’archive ouverte pluridisciplinaire HAL, est
destinée au dépôt et à la diffusion de documents
scientifiques de niveau recherche, publiés ou non,
émanant des établissements d’enseignement et de
recherche français ou étrangers, des laboratoires
publics ou privés.
The effect of sectioning and ultrasonication on the
mesoporosity of poplar tension wood
Shan-Shan Chang, Françoise Quignard, Bruno Clair
To cite this version:
Shan-Shan Chang, Françoise Quignard, Bruno Clair. The effect of sectioning and ultrasonication on
the mesoporosity of poplar tension wood. Wood Science and Technology, Springer Verlag, 2017, 51
(3), pp.507-516. �10.1007/s00226-017-0890-0�. �hal-01601127�
The
effect of sectioning and ultrasonication
on
the mesoporosity of poplar tension wood
Shan-Shan Chang1,2 • Franc¸oise Quignard3 • Bruno Clair2,4
Abstract Increasing interest in understanding tension stress generation in tension wood with fibres having a gelatinous layer (G-layer) has focused attention on the specific role of this layer. To distinguish its contribution from those of other wall layers, the G-layer of wood sections was isolated by ultrasonication. The aim of this study was to assess the effect of sectioning and of the ultrasonic treatment on the mesoporosity of tension wood using nitrogen adsorption–desorption analysis. The results showed that the process of isolating the G-layer using ultrasonication strongly affects its mesoporosity. Most damage was found to occur during sec-tioning rather than as a result of the 15-min ultrasonic treatment.
Introduction
Plants control their orientation by bending their stems or branches to respond to environmental variation (Timell 1986). Bending is achieved by the asymmetrical production of stress in the newly formed secondary xylem around the stem. In angiosperm woody species, the reaction wood is called tension wood. It is formed
& Shan-Shan Chang changelxy@hotmail.com
1
College of Materials Science and Engineering, Central South University of Forestry and Technology, Changsha 410004, Hunan, People’s Republic of China
2 Laboratoire de Me´canique et Ge´nie Civil (LMGC), CNRS, Universite´ de Montpellier, cc 048,
Place E. Bataillon, 34095 Montpellier, France
3 Institut Charles Gerhardt Montpellier, UMR 5253 CNRS, ENSCM, Universite´ de Montpellier, 8
rue de l’Ecole Normale, 34296 Montpellier Cedex 5, France
4 CNRS, UMR Ecologie des Foreˆts de Guyane (EcoFoG), AgroParisTech, CIRAD, INRA,
Universite´ des Antilles, Universite´ de Guyane, Campus Agronomique, BP 701, 97387 Kourou, France
on the upper side of the leaning stem and produces a bending moment allowing stem reorientation (Fournier et al. 2014). In many commonly studied species such as poplar, oak and chestnut, tension wood is characterised by the occurrence of fibres with a particular morphology and chemical composition due to the development of the so-called gelatinous layer (G-layer). This layer is composed of highly crystalline cellulose with microfibrils oriented nearly parallel to the fibre axis (Fujita et al.
1974; Daniel et al. 2006) and embedded in an amorphous matrix of hydrated polysaccharides (Nishikubo et al. 2007; Mellerowicz et al. 2008; Bowling and Vaughn 2008). Like gels, the structure of G-layer is characterised by water-filled meso- or macropores, with most pores having a diameter of about 7 nm in chestnut (Castanea sativa Mill.) (Clair et al. 2008) and of 6–12 nm in several tropical species (Chang et al. 2009). It has been shown that mesoporosity is much lower (but not zero) in normal wood without a G-layer, suggesting that the high mesoporosity of tension wood can be attributed to the G-layer itself. However, due to the difficulty in preparing samples at the cellular level, up to now, the porosity of G-layers has always been measured on wood samples several millimetres thick, which are possibly contaminated by porosity of the primary and other secondary layers. For example, a small amount of mesopores in normal wood has been attributed to pit membrane. Indeed, it is known that the pit membranes of angiosperm vessels are made of similar microfibril-reinforced hydrogels, whose pore sizes are calculated from a modified capillary equation ranging between 5 and 20 nm (Choat et al.
2003,2004). To obtain accurate information about the porosity of the G-layer alone, quantitative measurements on isolated G-layers are needed to distinguish the contribution of the pores from those of other layers.
Norberg and Meier (1966) showed that the G-layer can be removed from the surrounding layer using a purely physical method of ultrasonication. This method was later used by several authors (Nishikubo et al. 2007; Kaku et al. 2009; Olsson et al. 2011). In all of these studies, the G-layer was isolated to better understand its composition. Although this process is not expected to alter the chemical content, sectioning and sonication may affect the texture and mesoporosity of the G-layer. First, after sectioning, it was shown that the G-layer had swollen (Clair et al. 2005a). Swelling is commonly observed on semi-thin (10–30 lm) cross sections prepared with a sliding microtome. After this type of preparation, the G-layers are easy to identify thanks to their swollen appearance and their detachment from the adjacent layer (Clair et al. 2005a, b), but the question arises of whether the native microstructure is altered. Second, during ultrasonic treatment, the energy of ultrasound is transferred to the polymer chains through a process called cavitation, which includes the formation, growth and implosive collapse of bubbles in a liquid (Suslick1990). Violent shock waves are produced in the cavitation bubbles and the immediate surrounding area, and these can be used to isolate the fibrils from the wood sections (Wang and Cheng 2009). Although it is an efficient way of separating the G-layer, the effect of ultrasound on the mesoporosity of wood sections has not yet been described. The aim of this study was to investigate the mesoporosity of an isolated G-layer paying particular attention to the factors (sectioning and sonication) which could affect the mesoporosity during the process of isolating the G-layer.
Materials and methods
Materials
A naturally tilted poplar (Populus deltoides 9 P. nigra) stem (diameter at breast height, 24 cm) growing in Grabels (Domaine Maspiquet, Lycee Agropolis Montpellier) in the South of France was used throughout the experiment. Poplar is known to produce tension wood with a typical G-layer (Fang et al.2008). After the tree was felled, the pieces of wood were kept damp and conserved as centimetre wood blocks in 70% ethanol.
Hundreds of 20-lm-thick cross sections were cut in each tension wood block with a sliding microtome. The remaining parts of the tension wood blocks were cut into small pieces of around 2 9 2 9 2 mm3, dehydrated in a graded series of ethanol solutions (85, 90, 96, 100%) without sonication treatment and labelled TW0. The successive 20-lm-thick sections were divided into three groups.
In group 1, sections were dehydrated with serial ethanol aqueous solutions (85, 90, 96, 100%) without sonication treatment and labelled S0.
In group 2, sections were treated with 96% ethanol and 15 min of ultrasonic waves (Fisher Scientific ultrasonic cleaner, Transsonic TI-H-10, 25 kHz) at 100 W and 25 kHz. All the pieces of the sections (both the isolated G-layers and the remaining sections) were carefully collected after ultrasonic treatment, dehydrated in anhydrous ethanol and labelled S15.
In group 3, sections were stored in 96% ethanol for a few hours, as proposed by Norberg and Meier, to loosen the G-layer from the adjacent secondary cell wall. The sections were then treated with 96% ethanol and ultrasonic waves (Fisher Scientific ultrasonic cleaner, Transsonic TI-H-10, 25 kHz) at 100 W and 25 kHz. Sonication time was optimised (15 min) as a shorter sonication time reduced the efficiency of G-layer isolation, whereas a longer time increased the risk of separation of the other layers. The ultrasonic treatment was carried out in a cold bath (cooled with ice water), and the water was kept cold throughout the entire treatment. After 15 min, approximately 50% of the G-layers were shaken out of the sections. The sections were first removed with a 1-mm mesh filter, and the G-layers filtered through 40-lm nylon filters (Millipore, France). The purity of the G-layer fraction was confirmed by microscopic observation. The isolated G-layers obtained after 15-min sonication were dehydrated in anhydrous ethanol and labelled G15.
Sampling was duplicated in each of the sample preparations to validate the repeatability of these measurements.
Section staining
Sections before and after sonication were observed with an optical microscope after double staining with safranin O/alcian blue 8GX to reveal the presence of the G-layer. Lignified tissues stained red mixed with varying degrees of blue, while mainly cellulosic cell wall layers, like the G-layers, stained blue.
Nitrogen adsorption–desorption measurement
In all the dehydrated samples (TW0, S0, S15 and G15), anhydrous ethanol was exchanged with liquid CO2and the samples were supercritically dried before N2 adsorption measurements to maintain mesoporosity and avoid the collapse of the gel (Clair et al.2008). The supercritically dried samples were outgassed at 323 K under vacuum until a stable 3 9 10-5 Torr pressure was reached without pumping. This was done to remove physically adsorbed gases from the surface of the sample, particularly water or ethanol vapour. Nitrogen adsorption–desorption isotherms were recorded at 77 K on a Micromeritics ASAP 2020 volumetric apparatus. This experimental technique makes it possible to measure the specific surface area (Brunauer et al. 1938), pore volume (Gregg and Sing 1982) and the pore size distribution (Broekhoff and de Boer1967) of the samples.
To check the effect of the duration of sonication on the texture of the G-layer, additional isolated G-layers from another set of samples were subjected to increasingly long periods of ultrasonic treatment (unpublished data available in Chang2014).
Results
Reproducibility of the measurement
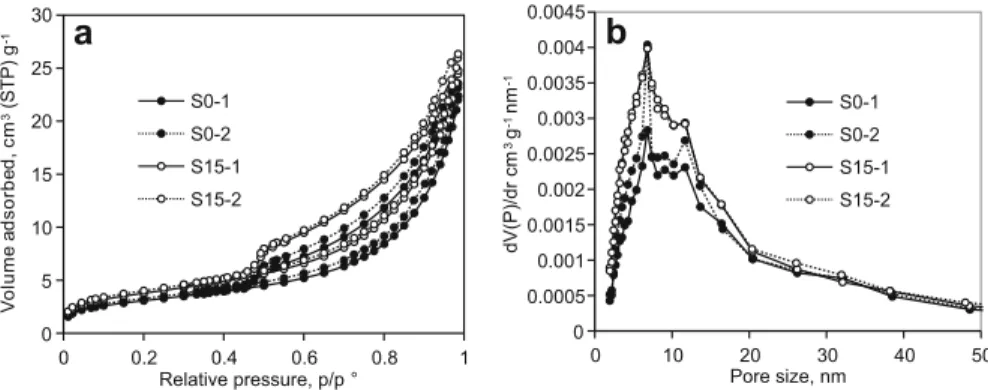
Figure1 shows an example of the reproducibility of the measurements with replicates of samples S0 and S15. Isotherms and pore size distributions in the duplicate samples are in close agreement, thereby confirming the reproducibility of the results. Consequently, in the rest of the paper, only one sample is presented.
0 0.2 0.4 0.6 0.8 1 0 5 10 15 20 25 30 Relative pressure, p/p ° m c , d e br o s d a e m ul o V 3 g ) P T S( -1
a
S0-1 S0-2 S15-1 S15-2 0 10 20 30 40 50 0 0.0005 0.001 0.0015 0.002 0.0025 0.003 0.0035 0.004 0.0045 Pore size, nm dV(P)/dr cm 3g -1nm -1b
S0-1 S0-2 S15-1 S15-2Fig. 1 aN2adsorption–desorption isotherms at 77 K and b pore size distributions for poplar tension
wood sections after 15 min of ultrasonic treatment S15 (curves with empty circles, two sample repetitions S15-1 and S15-2) and 20-lm-thick tension wood sections without ultrasonic treatment S0 (curves with full circles; two sample repetitions S0-1 and S0-2)
Isolated G-layer
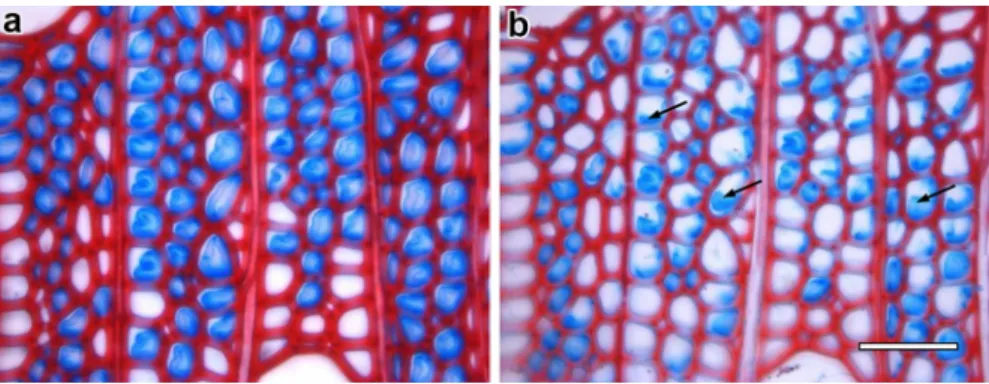
Figure2a and b are light micrographs of twin transverse sections of tension wood before and after a 15-min ultrasonic treatment. G-layers are still present in some of the cells. Full detachment occurred in only 15% of the cells, whereas partial detachment occurred in nearly 40% of the cells. In other cells, the G-layer was still attached after sonication.
Figure3a shows the hydrated G-layers loosened from the sliced transverse sections using sonication. The purity of the isolated G-layer fraction was examined by microscopic observation. Observations showed nearly 100% of G-layers, but slight contamination from other cell wall layers was detected. To preserve the original volume and the texture of the hydrogel of the G-layer, aerogels of G-layers were obtained by CO2 supercritical drying (Fig.3b). The G-layer particles are agglomerated in a very low density material. In this way, shrinkage due to capillary pressure was prevented and the aerogel formed is expected to reproduce in the dry state the texture of the original hydrogel (Pierre and Pajonk 2002; Cansell et al.
2003).
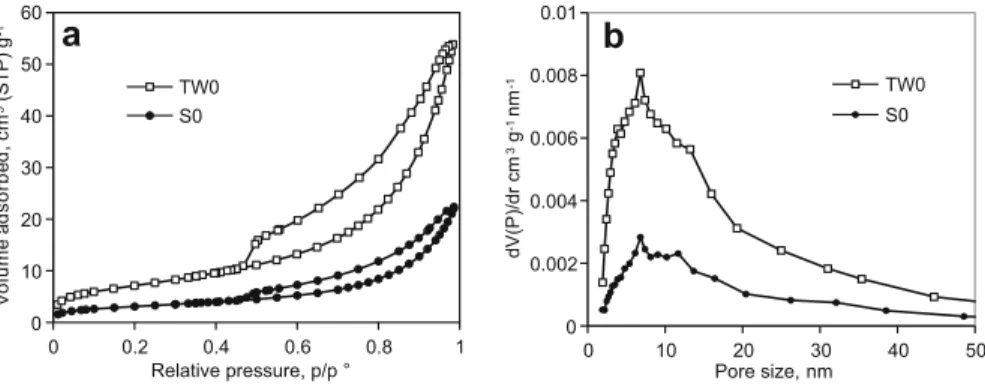
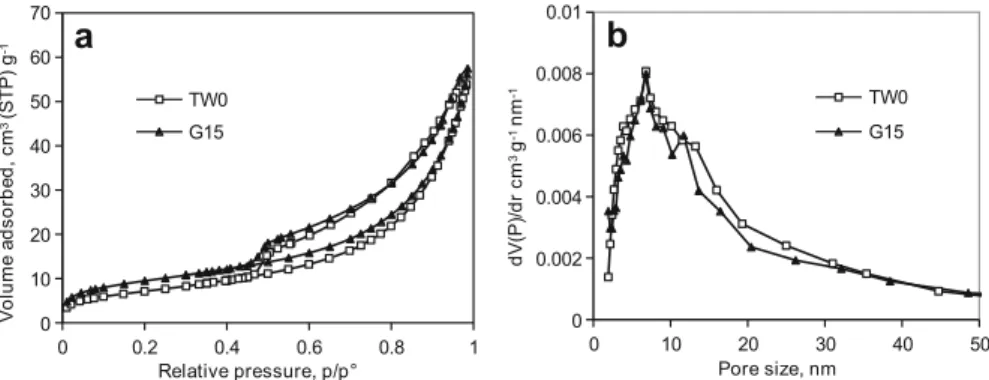
Sectioning affects the mesoporosity of tension wood
Figure4 shows the isotherms and pore size distributions for poplar tension wood TW0 and tension wood sections S0. Tension wood sections S0 exhibited the similar isotherm type and pore shape as tension wood sample TW0, i.e. an isotherm of type IV, presenting a typical H3 hysteresis loop, according to the IUPAC classification (Sing et al. 1985). However, compared to tension wood sample TW0, the total volume of nitrogen adsorbed in the wood section S0 samples decreased greatly and exhibited a 2.3 times smaller specific surface area than tension wood sample TW0 (11 m2.g for sample S0 and 26 m2.g for sample TW0). Both samples exhibited broad pore size distributions ranging from 2 to 50 nm, with the most probable values between 2 and 20 nm. Tension wood sample TW0 showed sharp pore size distribution with a peak pore size at 6 nm with a slight shoulder at 12 nm, whereas
Fig. 2 Transverse sections of tension wood before (a) and after (b) 15-min ultrasonication. After ultrasonic treatment, G-layers are still present in some of the cells (see arrows), in other cells, G-layers have been shaken out. Sections are stained with safranin O and alcian blue 8GX. Scale bar 50 lm
Fig. 3 aIsolated G-layer in water as extracted from transverse sections of tension wood with 15-min ultrasonic treatment and b the G-layers after CO2supercritical drying. Scale bar 20 lm
0 10 20 30 40 50 0 0.002 0.004 0.006 0.008 0.01 Pore size, nm dV(P)/dr cm 3 g -1 nm -1
b
TW0 S0 0 0.2 0.4 0.6 0.8 1 0 10 20 30 40 50 60 Relative pressure, p/p ° m c , d e br o s d a e m ul o V 3 g ) P T S( -1a
TW0 S0Fig. 4 a N2adsorption–desorption isotherms at 77 K and b pore size distributions for poplar tension
wood TW0 (curve with empty squares) and 20-lm-thick tension wood sections S0 (curve with black dots), both samples without sonication treatment
after sectioning, in sample S0, this shoulder became a real peak at 12 nm and was only slightly lower than the peak at 6 nm.
15 min of ultrasonic treatment starts to affect the mesoporosity of tension wood sections
Figure1 compares the isotherms and pore size distributions in tension wood sections with and without ultrasonic treatment. Sample S0 adsorbed a slight but significantly smaller amount of nitrogen than sample S15, yielding an average surface area of 11 m2 g-1 for sample S0 and 15 m2 g-1 for sample S15. Both isotherms were type IV with a typical H3 hysteresis loop, indicating the presence of mesopores between the cellulose microfibrils or in the matrix forming slit-shaped pores of non-uniform size. Both samples presented a broad range of pore size distributions, from 2 to 50 nm, with two pore size peaks at 6 and 12 nm, the highest being at 6 nm.
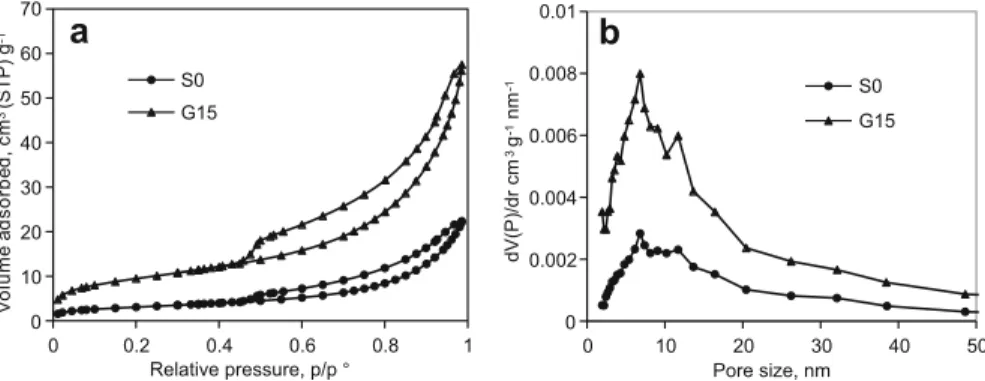
The source of the high porosity in tension wood
The isotherms and pore size distributions between tension wood sections S0 and the isolated G-layer extracted by 15 min of sonication G15 were compared (Fig.5). The isolated G-layers showed the same isotherm type as observed in samples S0, S15 and TW0, with a similar hysteresis loop. As the pore volume is given for the total mass of the material, the pure G-layer G15 exhibits a much higher total volume of nitrogen adsorbed per mass of material than that in the tension wood sections. This is easily explained by the fact the non-mesoporous part of the material was removed during isolation of the G-layer. The specific surface area of the isolated G-layer was also three times higher than that of the tension wood sections (35 m2g-1 for G15 and 11 m2g-1 for S0). When considering the pore size distribution rather than the amount, samples G15 and S0 were similar. Both samples had peak pore diameters of around 6 and 12 nm with a wide range of pore size distribution, from 2 to 50 nm.
Discussion
Sectioning with a microtome is a common step in the study of wood microstructure and was assumed to preserve the structure and properties of the samples in their native state. However, results based on the comparison of samples TW0 and S0 (Fig.3) showed that the sectioning process affects the mesoporosity of the tension wood samples. The pore volume decreased significantly when the tension wood blocks were cut into slices and their specific surface area was 2.3 times less than that of tension wood sample BT0. What is more, the cross-sectioning process also influenced the proportion of peak pore sizes. In wood block condition TW0, only one main peak pore was observed at 6 nm, whereas in the sections, for example samples S0, S15 and even in sample G15, there were two peak pores with a higher contribution of pores centred at 6 nm compared to pores at 12 nm. It thus appears
0 10 20 30 40 50 0 0.002 0.004 0.006 0.008 0.01 Pore size, nm dV(P)/dr cm 3g -1 nm -1
b
S0 G15 0 0.2 0.4 0.6 0.8 1 0 10 20 30 40 50 60 70 Relative pressure, p/p° m c , d e br o s d a e m ul o V 3 g ) P T S( -1a
S0 G15Fig. 5 aN2adsorption–desorption isotherms at 77 K and b pore size distributions for 20-lm-thick
tension wood sections without ultrasonic treatment S0 (curve with full circles) and G-layers extracted from the same tension wood with 15-min sonication G15 (curve with full triangles)
that smaller pores are more easily affected by sectioning and/or some of the small pores may have swollen and become bigger. It was shown in a previous study that sectioning of non-embedded wood samples often results in uncontrolled swelling of the G-layer, producing a border effect responsible for its swollen nature (Clair et al.
2005a).
Using wood sections and ultrasonic vibration is a common method to isolate the G-layer (Norberg and Meier1966; Nishikubo et al.2007; Kaku et al.2009; Olsson et al. 2011). After 15 min of ultrasonic vibration, nearly half the G-layers were separated from the transverse wood sections, while the others remained in the sections (Fig.2). The high reproducibility of the measurements (Fig.1) led to think that the observed difference was not caused by an experimental error, but was a real result, meaning that 15-min ultrasonication starts to affect the mesoporosity of tension wood sections. However, the only slight difference in mesoporosity between samples S0 and S15 indicated that this effect is quite small. Additional experiments on other samples (unpublished data available in Chang 2014) showed that increasing the duration of ultrasonication did change the structural characteristics of isolated G-layers and reduced the porosity of G-layers up to the point when after 60 min, all mesoporosity was destroyed. Loss of mesoporosity of bacterial cellulose due to sonication was also reported by Tischer et al. (2010).
G-layers extracted directly from wood sections displayed higher porosity and pore volume than section samples (Fig.5). As in sections, the mass of the lignified cell walls increased without increasing the mesopore volume. The general trend of isotherm and pore size distribution of sample G15 is, however, similar to that in tension wood block TW0 (Fig.6), poplar tension wood, previously reported in Chang et al. (2012) and tension wood from other species (Clair et al.2008; Chang et al.2009).
Clearly, most of the porosity measured in tension wood comes from the G-layer itself. However, considering the change in the mesoporous structure during isolation of the G-layer, mesoporosity of the G15 samples cannot be considered as ‘native’. In order to evaluate the real mesopore volume of the G-layer itself, a corrective
0 10 20 30 40 50 0 0.002 0.004 0.006 0.008 0.01 Pore size, nm d V (P)/d r c m 3g -1 nm -1
b
TW0 G15 0 0.2 0.4 0.6 0.8 1 0 10 20 30 40 50 60 70 Relative pressure, p/p° m c , d e br o s d a e m ul o V 3 g ) P T S( -1a
TW0 G15Fig. 6 a N2 adsorption–desorption isotherms at 77 K and b pore size distributions for poplar tension
wood TW0 (curve with empty squares) and G-layers extracted from the same tension wood with 15-min sonication, G15 (curve with black triangles)
factor needs to be applied to the mesoporosity measured in massive wood, accounting for the mass fraction of the G-layer in the tension wood sample and the changes in porosity at each step. This calculation was performed using the proportion of the G-layer measured on anatomical sections, but the result appeared to be very sensitive to the different sources of error and approximations necessary for the calculation. It therefore did not seem reasonable to present and discuss it here. Based on the current results (Fig.6), it can only be said that the loss in mesoporosity per mass unit during the procedure of G-layer isolation roughly compensates for the loss of the non-porous layer of the wall.
Conclusion
Nitrogen adsorption–desorption measurements performed on tension wood blocks and tension wood sections showed that the sectioning process greatly affects the mesoporosity of tension wood. Under 15 min of ultrasonication already started to affect the mesoporosity of the tension wood sections.
It is thus recommended that for studies using tension wood cross sections cut with a microtome, mesoporosity should be interpreted with caution, as it may be in a non-native state. To study G-layers extracted with ultrasonication, it is recom-mended minimising the duration of sonication, since longer sonication increases the risk of damaging the nanostructure of the G-layer.
AcknowledgementsThe authors wish to thank P. Brunier from Domaine Maspiquet in Grabels (Lycee Agropolis Montpellier) for the poplar tree used for this study and M. Chen for the pre-experiment work. This work was supported by National Natural Science Foundation of China (No. 31300481) and French National Research Agency (ANR-12-BS09-0004). The first author was supported by Chinese National Scholarship Fund.
Compliance with ethical standards
Conflict of interestThe authors declare that they have no conflict of interest.
References
Bowling AJ, Vaughn KC (2008) Immunocytochemical characterization of tension wood: gelatinous fibers contain more than just cellulose. Am J Bot 95:655–663
Broekhoff JCP, de Boer JH (1967) Studies on pore systems in catalysts: IX. Calculation of pore distributions from the adsorption branch of nitrogen sorption isotherms in the case of open cylindrical pores A. Fundamental equations. J Catal 9:8–14
Brunauer S, Emmett PH, Teller E (1938) Adsorption of gases in multimolecular layers. J Am Chem Soc 60:309–319
Cansell F, Aymonier C, Loppinet-Serani A (2003) Review on materials science and supercritical fluids. Curr Opin Solid 7:331–340
Chang SS (2014) Study of macromolecular and structural modifications occurring during the building of the tension wood cell wall: a contribution to the understanding of the maturation stress generation in trees. Dissertation, University Montpellier II, Montpellier, France
Chang SS, Clair B, Ruelle J, Beaucheˆne J, Di Renzo F, Quignard F, Zhao GJ, Yamamoto H, Gril J (2009) Mesoporosity as a new parameter in understanding of tension stress generation in trees. J Exp Bot 60:3023–3030
Chang SS, Quignard F, Di Renzo F, Clair B (2012) Solvent Polarity and internal stresses control the swelling behaviour of green wood during dehydration in organic solution. BioResources 7:2418–2430
Choat B, Ball M, Luly J, Holtum J (2003) Pit membrane porosity and water stress-induced cavitation in four co-existing dry rainforest tree species. Plant Physiol 131:41–48
Choat B, Jansen S, Zwieniecki MA, Smets E, Holbrook NM (2004) Changes in pit membrane porosity due to deflection and stretching: the role of vestured pits. J Exp Bot 55:1569–1575
Clair B, Gril J, Baba K, Thibaut B, Sugiyama J (2005a) Precautions for the structural analysis of the gelatinous layer in tension wood. Iawa J 26:189–195
Clair B, Thibaut B, Sugiyama H (2005b) On the detachment of the gelatinous layer in tension wood fiber. J Wood Sci 51:218–221
Clair B, Gril J, Di Renzo F, Yamamoto H, Quignard F (2008) Characterization of a gel in the cell wall to elucidate the paradoxical shrinkage of tension wood. Biomacromolecules 9:494–498
Daniel G, Filonova L, Kallas AM, Teeri T (2006) Morphological and chemical characterisation of the G-layer in tension wood fibres of Populus tremula and Betula verrucosa: labelling with cellulose-binding module CBM1 HjCel7A and fluorescence and FE-SEM microscopy. Holzforschung 60:618–624
Fang CH, Guibal D, Clair B, Gril J, Liu YM, Liu SQ (2008) Relationships between growth stress and wood properties in poplar I-69 (Populus deltoides Bartr. cv. ‘‘Lux’’ ex I-69/55). Ann For Sci 65:307–315
Fournier M, Alme´ras T, Clair B, Gril J (2014) Biomechanical action and biological functions of reaction wood. In: Gardiner B, Barnett J, Saranpaa P, Gril J (eds) The biology of reaction wood. Springer, Berlin, pp 139–170
Fujita M, Saiki H, Harada H (1974) Electron microscopy of microtubules and cellulose microfibrils in secondary wall formation of poplar tension wood fibers. Mokuzai Gak 20:147–156
Gregg SJ, Sing KSW (1982) Adsorption, surface area and porosity. Academic Press, London Kaku T, Serada S, Baba K, Tanaka F, Hayashi T (2009) Proteomic analysis of the G-layer in poplar
tension wood. J Wood Sci 55:250–257
Mellerowicz EJ, Immerzeel P, Hayashi T (2008) Xyloglucan: the molecular muscle of trees. Ann Bot 102:659–665
Nishikubo N, Awano T, Banasiak A, Bourquin V, Ibatullin F, Funada R, Brumer H, Teeri TT, Hayashi T, Sundberg B, Mellerowicz EJ (2007) Xyloglucan endo-transglycosylase (XET) functions in gelatinous layers of tension wood fibers in poplar: a glimpse into the mechanism of the balancing act of trees. Plant Cell Physiol 48:843–855
Norberg PH, Meier H (1966) Physical and chemical properties of the gelatinous layer in tension wood fibre of aspen (Populus tremula L.). Holzforschung 20:174–178
Olsson AM, Bjurhager I, Gerber L, Sundberg B, Salme´n L (2011) Ultra-structural organization of cell wall polymers in normal and tension wood of aspen revealed by polarization FTIR microspec-troscopy. Planta 233:1277–1286
Pierre AC, Pajonk GM (2002) Chemistry of aerogels and their applications. Chem Rev 102:4243–4266 Sing KSW, Everett DH, Haul RAW, Moscou L, Pierotti RA, Rouquerol J, Siemienewska T (1985)
Reporting physisorption data for gas-solid systems. Pure Appl Chem 57:603–619 Suslick KS (1990) Sonochemistry. Science 247:1439–1445
Timell TE (1986) Compression wood in Gymnosperms. Springer, Berlin, Heidelberg, New York, vol, pp 1–3
Tischer PCSF, Sierakowski MR, Westfahl H Jr, Tischer CA (2010) Nanostructural reorganization of bacterial cellulose by ultrasonic treatment. Biomacromolecules 11:1217–1224
Wang S, Cheng Q (2009) A novel process to isolate fibrils from cellulose fibers by high-intensity ultrasonication, part 1: process optimization. J Appl Poly 113:1270–1275