Publisher’s version / Version de l'éditeur:
Vous avez des questions? Nous pouvons vous aider. Pour communiquer directement avec un auteur, consultez la première page de la revue dans laquelle son article a été publié afin de trouver ses coordonnées. Si vous n’arrivez pas à les repérer, communiquez avec nous à PublicationsArchive-ArchivesPublications@nrc-cnrc.gc.ca. Questions? Contact the NRC Publications Archive team at
PublicationsArchive-ArchivesPublications@nrc-cnrc.gc.ca. If you wish to email the authors directly, please see the first page of the publication for their contact information.
https://publications-cnrc.canada.ca/fra/droits
L’accès à ce site Web et l’utilisation de son contenu sont assujettis aux conditions présentées dans le site LISEZ CES CONDITIONS ATTENTIVEMENT AVANT D’UTILISER CE SITE WEB.
Monthly Notices of the Royal Astronomical Society, 494, 1, pp. 1366-1374,
2020-03-20
READ THESE TERMS AND CONDITIONS CAREFULLY BEFORE USING THIS WEBSITE. https://nrc-publications.canada.ca/eng/copyright
NRC Publications Archive Record / Notice des Archives des publications du CNRC :
https://nrc-publications.canada.ca/eng/view/object/?id=f7669972-135b-4b80-9b66-fc5d9f67ef32
https://publications-cnrc.canada.ca/fra/voir/objet/?id=f7669972-135b-4b80-9b66-fc5d9f67ef32
NRC Publications Archive
Archives des publications du CNRC
This publication could be one of several versions: author’s original, accepted manuscript or the publisher’s version. / La version de cette publication peut être l’une des suivantes : la version prépublication de l’auteur, la version acceptée du manuscrit ou la version de l’éditeur.
For the publisher’s version, please access the DOI link below./ Pour consulter la version de l’éditeur, utilisez le lien DOI ci-dessous.
https://doi.org/10.1093/mnras/staa779
Access and use of this website and the material on it are subject to the Terms and Conditions set forth at
LARgE survey – III. Environments of ultra-massive passive galaxies at
cosmic noon: BCG progenitors growing through mergers
Sawicki, Marcin; Arcila-Osejo, Liz; Golob, Anneya; Moutard, Thibaud;
Arnouts, Stéphane; Cheema, Gurpreet Kaur
MNRAS 000,1–10(2020) Preprint 20 March 2020 Compiled using MNRAS LATEX style file v3.0
LARgE Survey – III. Environments of Ultra-Massive
Passive Galaxies at Cosmic Noon: BCG progenitors
growing through mergers
Marcin Sawicki
1,2
?
†
, Liz Arcila-Osejo
1
, Anneya Golob
1
, Thibaud Moutard
1
,
St´
ephane Arnouts
3
, Gurpreet Kaur Cheema
1
1Department of Astronomy & Physics and the Institute for Computational Astrophysics, Saint Mary’s University, 923 Robie Street, Halifax,
Nova Scotia, B3H 3C3, Canada
2Herzberg Astronomy and Astrophysics, National Research Council of Canada, 5071 West Saanich Rd., Victoria, BC V9E 2E7, Canada 3Laboratoire d’Astrophysique de Marseille, 38 rue Frederic Joliot Curie, Universit´e Aix-Marseille, Marseille, F-13388, France
MNRAS, in press
ABSTRACT
We study the environments of a sample of 61 extremely rare z∼1.6 Ultra-Massive Pas-sively Evolving Galaxies (UMPEGs: stellar masses M?> 1011.5M
) which – based on
clustering analysis presented in Cheema et al.(2020) – appear to be associated with very massive (Mhalo∼1014.1h−1M ) dark matter halos that are likely to be the
progen-itors of z∼0 massive (Coma- and Virgo-like) galaxy clusters. We find that UMPEGs on average have fewer than one satellite galaxy with mass ratio Msat
? :M?UMPEG≥1:5 (i.e.,
M?sat>∼ 1010.8M ) within 0.5 Mpc; the large mass gap that we observe between the
typ-ical UMPEG and its most massive satellite implies that the z∼1.6 UMPEGs assembled through major mergers. Using observed satellite counts with merger timescales from the literature, we estimate the growth rate due to mergers with mass ratio of ≥ 1:4 to be ∼13% Gyr−1 (with a ∼2× systematic uncertainty). This relatively low growth rate is unlikely to significantly affect the shape of the massive end of the stellar mass function, whose evolution must instead be driven by the quenching of new cohorts of ultra-massive star-forming galaxies. However, this growth rate is high enough that, if sustained to z∼0, the typical z∼1.6 M?UMPEG = 1011.6M UMPEG can grow into a
M?≈ 1012M
brightest cluster galaxy (BCG) of a present-day massive galaxy cluster.
Our observations favour a scenario in which our UMPEGs are main-branch progeni-tors of some of the present-day BCGs that have first assembled through major mergers at high redshifts and grown further through (likely minor) merging at later times. Key words: cosmology: large-scale structure of universe – galaxies: formation – galaxies: halos – galaxies: statistics
1 INTRODUCTION
In the modern cosmic structure formation framework, dark matter halos form from initial density perturbations via gravitational collapse (White & Rees 1978) and subse-quently grow bottom-up via hierarchical merging (White & Frenk 1991; Kauffmann & White 1993). Today, the most massive of these halos host galaxy clusters, at the centres of which reside Brightest Cluster Galaxies (BCGs) – ultra-massive galaxies that are among the most extreme, most massive galaxies in the present-day Universe (stellar masses
? E-mail: marcin.sawicki@smu.ca
† Canada Research Chair
M?∼ 10> 11.5M , and as high as ∼1012M ;Lidman et al. 2012;
Liu et al. 2012).
Virtually all BCGs today are quiescent – i.e., devoid of any significant star formation – with very low specific star formation rates (< SSFR > ∼ 0.001 Gyr−1;Fraser-McKelvie
et al. 2014) that imply (current) mass build-up scales much longer than the present-day age of the Universe. SSFRs in BCGs increase with increasing redshift, so that by z∼1.2 <SSFR> ∼ 0.1 Gyr−1 with very few, if any, quiescent
exam-ples (McDonald et al. 2016). In agreement with this, models predict that BCG progenitors should be predominantly star-forming at high redshifts, z > 1, but indicate that a small fraction may have been already massive and quiescent at these early times (Contini et al. 2016). Such Ultra-Massive © 2020 The Authors
Passively Evolving Galaxies (UMPEGs; M? > 1011.5M ),
while very rare have – however – been found at z> 1 (e.g., Marchesini et al. 2014; Arcila-Osejo et al. 2019), with a handful of examples spectroscopically confirmed out to z∼4 (Onodera et al. 2012; Belli et al. 2016; Kado-Fong et al. 2017; Stockmann et al. 2020; Forrest et al. 2019). If they formed as single objects through intense bursts of star for-mation, UMPEG progenitors must have had star forma-tion rates (SFRs) of several hundred M /yr (e.g.,
Arcila-Osejo et al. 2019). Moreover, UMPEGs are very strongly clustered (Cheema et al. 2020), suggesting that they are associated with the high-z progenitors of present-day mas-sive galaxy clusters; UMPEGs could therefore be the direct, main-branch progenitors of some of the present-day BCGs. Altogether, UMPEGs appear to be extreme examples among the high-z galaxy population; because they are so extreme, they provide a unique opportunity to test our understanding of galaxy formation and evolution in the extreme regions of galactic parameter space that these monster galaxies occupy. Simulations (e.g., De Lucia & Blaizot 2007; Ragone-Figueroa et al. 2018) predict that a main-branch BCG pro-genitor (whether star-forming or quiescent) is often already well established by z∼1.5, and contains 10-30% of the BCG’s present-day stellar mass by that redshift. Major mergers can be expected to play an important role in the formation of these ultra-massive galaxies (UMGs) because of dynamical friction (Ostriker & Tremaine 1975), whose effect increases with increasing satellite mass (Chandrasekhar 1943) As a result, massive galaxies at the core of their dark matter halo can be expected to merge relatively quickly to form an even more luminous and massive galaxy, leaving as ev-idence of such merging a substantial luminosity gap be-tween the brightest and second-brightest galaxy in the sys-tem (Ostriker & Tremaine 1975;Jones et al. 2000;Tal et al. 2012). The more detailed semi-analytic formation models (e.g.,De Lucia & Blaizot 2007;Contini et al. 2016) indeed predict a significant major-merger phase, expected to oc-cur at high redshift (z> 1), although in-situ star formation (before quenching occurs) and minor mergers can also con-tribute to the growth.
At low and intermediate (z <∼ 1) redshifts, observations suggest that mergers continue to add mass to the BCGs (e.g.,Edwards & Patton 2012;Liu et al. 2012,2015;Burke & Collins 2013; Lidman et al. 2013). However, to test the merger paradigm at high redshifts, z >∼ 1, requires first the ability to identify high-z BCG progenitors. Such progenitor identification is non-trivial given that – as mentioned ear-lier – the progenitors are expected to evolve substantially through mergers (as required by the model).
One way to proceed is to modify the abundance-matching technique by correcting for the effects of merging using predictions from numerical simulations (e.g., March-esini et al. 2014; Vulcani et al. 2016; Cooke et al. 2019). These studies report the detection of significant number of UMG progenitors at high redshift, z >∼ 1 and find that while many of them are star-forming, a non-negligible fraction is already quenched. At 1 <∼ z<∼ 2, growth in UMG stellar masses comes from in-situ star formation, which is estimated di-rectly from observational data, and from mergers, whose ef-fect is estimated from simulations (Cooke et al. 2019). While supporting the importance of mergers at high redshift, this approach does not test it directly as it uses hierarchical halo
merger models to both help identify BCG progenitors, and to estimate merger and mass growth rates (Cooke et al. 2019). Merger rates can be instead be more directly esti-mated from the data by counting the incidence of close com-panions or disturbed morphologies, as done by (Vulcani et al. 2016) and (Zhao et al. 2017), who find evidence for mergers at z > 1, although still relying on abundance matching for progenitor identification.
An alternative approach to testing the merger scenario is to identify BCG progenitors in a way that is less dependent on assumptions inherent in galaxy abundance matching, whether corrected or not using hierarchical merger trees. In (Arcila-Osejo et al. 2019) we used wide-area imaging to iden-tify a population of z ∼ 1.6 UMPEGs, and their extremely strong clustering (r0 = 29.77 ± 2.75 h−1Mpc) suggests that
they are associated with halos of mass Mhalo∼ 1014.1h−1M .
Under the assumption of smooth halo mass growth, these z∼1.6 halos are likely to be the progenitors of present-day massive (Mhalo ∼ 1015M ) galaxy clusters (Cheema et al.
2020). While only approximately one out of eight of such massive z∼1.6 halos appear to contain an UMPEG (the re-maining halos presumably contain star-forming UMGs, or collections of lower-mass pre-merger components), the very high stellar masses of our UMPEGs and their very strong clustering suggest that they are direct, main-branch pro-genitors of some of the present-day BCGs in massive clus-ters. These z∼1.6 objects thus provide a sample of plausible proto-BCGs with which to test the BCG hierarchical growth scenario at high redshift.
In this paper we will examine the environments of these z∼1.6 BCG progenitors. The depth of our dataset is not suf-ficient over most of its area to find normal, sub-M∗, galaxies around them, and consequently we are not in a position to see directly if they reside at centres of (proto)clusters. In-stead, we will search for evidence of major mergers in the formation and growth of our UMPEGs. We will do so not by searching for merger signatures such as disturbed mor-phologies or tidal features (e.g., Patton et al. 2000; Lotz et al. 2008;Bridge et al. 2010) as our data are also too shal-low to detect such shal-low-surface-brightness features at z∼1.6. Instead, we will search for (relatively) massive companions that represent a reservoir of material for future mergers. The number of such massive companions, combined with dynam-ical friction timescales, will give us an estimate of the mass growth due to mergers. At the same time, the presence of a significant mass (or luminosity) gap between the UMPEGs and their most massive (or luminous) satellites will provide evidence that major mergers have already happened.
Throughout this work we use the AB magnitude sys-tem (Oke 1974) and assume theChabrier(2003) stellar ini-tial mass function (IMF) when calculating stellar masses of galaxies. We adopt the flat Λ cosmology with Ωm,0 = 0.3,
ΩΛ,0= 0.7, and Hubble constant of H0 = 70 km s−1Mpc−1. In this cosmology, 1 Mpc (physical) corresponds to 118.000, or ∼ 20, at z∼1.6 (Wright 2006).
2 DATA AND SAMPLE SELECTION
The detailed description of our catalogs and sample selec-tion is given inArcila-Osejo et al. (2019) so here we only summarize the key details.
LARgE Survey – III. Environments of z ∼ 1.6 UMPEGs
3
We selected z∼1.6 galaxies using an adaptation of theDaddi et al.(2004) BzK technique developed byArcila-Osejo & Sawicki (2013). This “gzKs technique” selects z∼1.6
star-forming (SF-gzKs) and passively-evolving (PE-gzKs) galaxies
using a combination of optical and near-IR photometry. For the optical data we used the g and z images from the T0006 release of the CFHT Legacy Survey (CFHTLS, Goranova et al. 2010), specifically all four of its Deep fields (D1, D2, D3, and D4), and two of the Wide fields (W1 and W4). For the NIR data in W1 and W4 we used the Ksimages from the
Visible Multi-Object Spectrograph (VIMOS) Public Extra-galactic Ks Survey Multi-Lambda Survey (VIPERS-MLS;
Moutard et al. 2016a); meanwhile, in the Deep fields we used the Ks and H-band data from the T0002 release of the
WIRCam Deep Survey (WIRDS;Bielby et al. 2012). Requiring overlap between the optical and NIR datasets, and after masking areas around bright stars, low-SNR regions, and other artifacts, our data cover 25.09 deg2 in the two Wide fields and 2.51 deg2in the Deep fields, giv-ing a total area of 27.6 deg2. In the Wide fields we reach 90% detection completeness at Ks=20.5 AB; in the Deep
D1, D3, and D4 fields we reach 50% detection completeness at Ks=23.5 AB, while in D2 (the COSMOS field) we reach
it at Ks=23.0 AB.
We used SExtractor (Bertin & Arnouts 1996) to per-form object detection in the Ks-band and then
matched-aperture photometry in other bands. Applying the gzKs
se-lection technique ofArcila-Osejo & Sawicki(2013) to these data gave us 8,756 gzKs galaxies with 19.25<Ks<20.25 in
the Wide fields and 53,988–65,586 (the lower number is for secure z∼1.6 galaxies and the upper number includes some possible lower-z interlopers) with 19.25<Ks<23.5 in the Deep
fields. Comparison of our sample in the COSMOS (CFHTLS D2) field with the catalog of Muzzin et al.(2013b), shows that gzKs galaxy redshift distributions very with type
(PE-gzKsand SF-gzKs) and magnitude: the peak is at z∼1.5 for
the brightest galaxies and shifts to z∼1.7 for fainter galaxies (Ks∼22–23), while the FWHM of the distribution is ∼0.8 for
PE-gzKsgalaxies and ∼1.1 for SF-gzKs(see Fig. 6 of
Arcila-Osejo et al. 2019for an illustration).
The brightest among the PE-gzKs galaxies are of
spe-cial interest. In order to be already quiescent at z∼1.6 and yet very bright in the NIR suggests they must be very mas-sive and thus must have formed under extreme conditions at even higher redshifts. We thus defined in Arcila-Osejo et al.(2019) a sample of Ultra-Massive Passively Evolving Galaxies (UMPEGs) to be PE-gzKs galaxies with Ks<19.5.
This selection corresponds to quiescent galaxies with stellar masses M?∼ 10> 11.5M , and with mean stellar mass<M?> =
1011.6M . Our sample of UMPEGs consists of 61 objects, the
vast majority (all but six) located in the two Wide fields (W1 and W4). For full details of the object detection, photome-try, UMPEG selection, and stellar mass estimation, please seeArcila-Osejo et al.(2019).
3 SATELLITE COUNTS
Halos of mass ∼ 1013M are expected to have virial radii of
0.5 Mpc at z∼1.6 (Munoz-Cuartas et al. 2011). Our cluster-ing analysis suggests that our z∼1.6 UMPEGs reside in halos that are an order of magnitude more massive (Cheema et al.
L
/
L
UMPEGUMPEG rest-frame i mag
L
/
L
UMPEGFigure 1. Satellite galaxy candidates. Luminosity ratios (satel-lite candidate compared to that of its UMPEG) are plotted as function of UMPEG luminosity in rest-frame i-band. The top panel shows data in the Wide fields, and the bottom panel is for the Deep. The yellow area shows the magnitude range of our UMPEGs; open magenta symbols identify UMPEGs with satel-lite candidates, whereas filled magenta points are for UMPEGs with no satellites. The gray shaded area represents the positions these companions would occupy if they were at least 50% as bright as the central UMPEG. The completeness limit for each sample, reported in Sec.2, is shown with a dot-dashed line.
2020), so searching for potential satellite galaxies within a 0.5 Mpc radius seems justified as it is likely to yield a physically-associated population. We perform this search by conducting a census of all gzKsgalaxies located in 0.5 Mpc
(projected) proximity to each UMPEG followed by a sta-tistical correction to account for the contamination due to chance projections.
Figure 1 shows our census of the potential satellites of our UMPEGs in the Wide (top panel) and Deep (bot-tom panel) fields. The rest-frame i-band luminosities of the UMPEGs, derived from their Ks magnitudes, are shown on
the horizontal axes, while the vertical axes show the i-band luminosity ratios (Lcomp/LUMPEG) for the (potential)
satel-lites. The candidate satellites in Fig. 1 include physically MNRAS 000,1–10(2020)
0.0 0.2 0.4 0.6 0.8 1.0 1.2
L / L
UMPEG 2 1 0 1 2lo
g
N
/ M
pc
21 sat
0.1
0.01
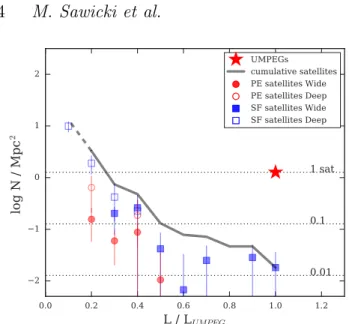
UMPEGs cumulative satellites PE satellites Wide PE satellites Deep SF satellites Wide SF satellites DeepFigure 2. The background-subtracted surface number density of companions within 0.5 Mpc of UMPEGs as a function of rest-frame i-band luminosity ratio. The three dotted horizontal lines show (top to bottom) 1, 0.1, and 0.01 satellites per UMPEG. The black curve shows the cumulative number density of satellites: solid where we are complete and dashed to indicate the lower limit where we do not detect PE-gzKs galaxies. It is clear that
UMPEGs lack companions of comparable luminosity even in this figure, which does not remove unassociated fore/background pro-jections. Even at luminosities ∼ 0.2 × LUMPEGthere is only one
companion (physical + projected) per UMPEG.
unassociated gzKsfore/background galaxies, so the number
of objects shown can be regarded as an upper limit on the number of physically-associated companions. However, even with this simple analysis it is clear that UMPEGs have ex-tremely few luminous companions: of the 61 UMPEGs in our sample, only four have a companion with luminosity ra-tio Lcomp/LUMPEG > 0.5 (objects above the dashed line).
Only at Lcomp/LUMPEG < 0.2 do we start seeing significant
numbers of companions, although many of these are likely to be physically-unassociated chance projections.
Of course, we currently have no way of individually identifying which of the objects in Fig. 1 are physically associated with our UMPEGs and which are chance pro-jections. We can, however, statistically correct for this foreground/background contamination using the well es-tablished approach recently employed by a number of studies that characterize the satellite galaxy populations around massive galaxies (e.g., Tal et al. 2012; Tal et al. 2013; Kawinwanichakij et al. 2014; Hartley et al. 2015, L. Chen et al., submitted to MNRAS). In this approach, the (fore/background-contaminated) number counts of galaxies within a projected cylinder centred on the central galaxy are corrected by subtracting the magnitude-dependent num-ber counts inferred from similar cylinders placed at random positions in the survey area. In our case, to compute the background we randomly place within our survey area three hundred apertures with radius 0.5 Mpc each (ensuring that they do not overlap with the 0.5 Mpc apertures centred on our UMPEGs), and then count gzKsgalaxies within them to
arrive at the background number density as function of mag-nitude and galaxy type (PE-gzKs or SF-gzKs). Subtracting
these numbers from the counts of gzKsgalaxies around the
UMPEGs statistically removes physically-unassociated, pro-jected foreground/background gzKsgalaxies: this correction
statistically deems most UMPEG companions in the Wide fields as unphysical, and ∼60% in the Deep fields. Applying this correction gives us the background-corrected observed surface density of true, physically-associated satellites, Σobs. We next need to correct for an additional source of in-completeness which affects the probability of detecting satel-lites. Here we note that the redshift distribution of UMPEGs is approximately Gaussian-shaped (Arcila-Osejo et al. 2019) and that this is a reflection of the gzKs selection window
rather than a real physical decrease in the abundance of ultra-massive galaxies away from z∼1.6. This means that objects whose redshifts are away from the peak of the red-shift distribution have a reduced probability of detection. This effect affects the detectability of UMPEGs, but be-cause we do not analyze the environments of such undetected UMPEGs, our satellite statistics are not affected. However, the detectability of satellites UMPEGs that are detected but are at redshifts offset from the peak of the redshift distri-bution is also reduced, and we need to account for these undetected satellites. We correct for this incompleteness by statistically weighing Σobsas
Σtrue= Σobs× ∫ NUMPEG(z)dz ∫ NUMPEG(z) × Ncomp(z)dz , (1)
where Σtrue represents the true surface density of satellites,
corrected for both fore/background galaxies and satellite de-tection completeness. The N(z) are the redshift probability distributions of UMPEGs or companions. For these redshift distributions, we adopt the photometric redshift distribu-tions shown in Fig. 6 ofArcila-Osejo et al. (2019), noting that the probability density distribution N(z) is different for UMPEGs and companions given their different Ks
mag-nitudes and the fact that companions can be star-forming or passive. In Eq.1 the denominator accounts for the fact that companions will only be detected when both their cen-tral UMPEGs and they themselves are detected, and this is proportional to both the UMPEG and companion detec-tion probabilities; the numerator accounts for the redshift-dependent detection probability of the UMPEGs.
Figure2shows the results of applying this procedure, binned in bins of luminosity ratio and separated for SF-gzKs
and PE-gzKssatellites. The gray curve shows the cumulative
number density of satellites (of both types) summed starting with the most luminous. Note that in this Figure we have converted the observed quantities (number per arcmin2) into physical ones (number per Mpc2) using our adopted cosmol-ogy.
It is clear in Fig. 2 that UMPEGs have virtually no physically-associated satellites with L/LUMPEG∼ 0.5, and>
even summing down to L/LUMPEG∼ 0.25 there is only on average one satellite per UMPEG. The shape of the distribu-tion, with its low number of luminous satellites followed by an increase in satellite number at lower masses, is reminis-cent of the ”gap” reported byTal et al.(2012) in the luminos-ity function of z∼0.3–0.7 Distant Red Galaxies (DRGs). The details of their distributions are not directly comparable to those of our’s because we normalized our satellite UMPEG luminosities, whereasTal et al.(2012) left heir DRG nosities un-normalized. Nevertheless, the size of the
lumi-LARgE Survey – III. Environments of z ∼ 1.6 UMPEGs
5
19.0 19.5 20.0 20.5 21.0 21.5 22.0 22.5 23.0 23.5
K
s7
8
9
10
11
12
lo
g
(
M
/M
¯)
PE (Arcila-Osejo+2019)
SF raw relation
SF with outshining correction
Figure 3. The mass-magnitude relation for star-forming gzKs
galaxies in the COSMOS field. The dashed blue line is a fit to the data as they are, while the solid blue line represents that raw relation adjusted for the effects of outshining in stellar mass estimates following the empirical prescrtiption of Sorba & Saw-icki(2018). The red line shows the mass-magnitude relation for quiescent, PE-gzKs galaxies fromArcila-Osejo et al.(2019).
nosity gap – whichTal et al.defined as the point at which the cumulative satellite distribution reaches one satellite per central – is similar: in their DRG sample they found it to be Lsat/LDRG∼ 0.3, which is similar to the Lsat/LUMPEG∼ 0.25
that we find for our UMPEGs. The implications for our z∼1.6 UMPEGs are similar to those for the intermediate-redshift DRGs ofTal et al.: the paucity of luminous companions sug-gests that our UMPEGs may have formed a significant time before the redshift of observation – z∼1.6 in our case – and that their subsequent growth will be moderate and mainly through minor mergers. We will expand on these points in Sec.4.
4 DISCUSSION
4.1 Masses of UMPEG satellites
UMPEGs are already extremely massive (M?UMPEG> 1011.5M ), but it is interesting to consider how much they
could grow by absorbing their satellites as these lose momen-tum via dynamical friction and in-spiral towards the centre of the host dark matter halo. To do so, we first need to esti-mate the stellar masses of the satellites before we estiesti-mate how quickly these satellites will merge with their UMPEGs. InArcila-Osejo et al. (2019) we determined an empir-ical Ks-M? relation for quiescent galaxies by matching our
Ks magnitudes of PE-gzKs galaxies in the COSMOS field
with their stellar masses from theMuzzin et al.(2013b) cat-alog that’s based on SED fitting of multi-band photometry. Fitting the resulting distribution gave us the relation log[M?PEG/M ]= −0.348Ks+ 18.284, (2)
which we can apply to the quiescent satellites. Because many of the satellites are star-forming, we also need a similar re-lation for SF-gzKs and so we now repeat the above
match-10.5
11.0
11.5
log (
M /M
¯)
2
1
0
1
2
lo
g
N
/ M
pc
21 sat
0.1
0.01
M
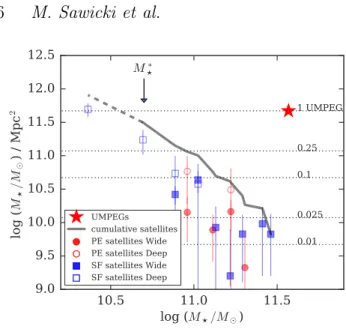
∗ UMPEGs cumulative satellites PE satellites Wide PE satellites Deep SF satellites Wide SF satellites DeepFigure 4. The background-subtracted surface number density of satellites within 0.5 Mpc of UMPEGs as a function of stellar mass. The black curve shows the cumulative number density of satellites: solid where we are complete and dashed to indicate the lower limit where we do not detect PE-gzKs galaxies. The
three dotted horizontal lines show (top to bottom) 1, 0.1, and 0.01 satellites per UMPEG. The location of the characteristic Schechter mass, M?∗, is indicated.
ing but for SF-gzKs galaxies and show the results in Fig.3,
where the magnitudes are our total Ks magnitudes, the
stellar masses are again from the catalog ofMuzzin et al. (2013b), and the dashed blue line shows the line of best fit to these data. Note, however, that there is growing evi-dence that spatially unresolved spectral energy distribution (SED) fitting (such as that inMuzzin et al. 2013bbut also in the vast majority of other studies) underestimates stellar masses of star-forming galaxies (Sorba & Sawicki 2018; see alsoZibetti et al. 2009,Sorba & Sawicki 2015,Abdurro’uf & Akiyama 2018). The effect arises because old stars, which can contain the bulk of a galaxy’s stellar mass, are masked in broadband photometry that’s used in SED fitting by much brighter but less numerous young stars (Sorba & Sawicki 2015,2018; see alsoSawicki & Yee 1998). As shown inSorba & Sawicki(2015,2018), this systematic mass under-estimate depends on specific star formation rate (SSFR) and so we correct the raw best-fit relation (dashed line in Fig.3) using the prescription from Sorba & Sawicki(2018, their Eq. 6) taking SSFR = 10−8.8 yr−1, as appropriate for high-mass (M? ∼ 1010 M ) star-forming galaxies at z∼1.6 (Whitaker
et al. 2014;Johnston et al. 2015). The result is an increase of star-forming galaxy stellar masses by ∆M?SFG= 37% on av-erage, as compared to the masses from spatially unresolved SED fits. The resulting mass-magnitude relation, corrected for the outshining effect, is then given by
log[M?SFG/M ]= −0.439Ks+ 19.958, (3)
and is shown with the solid cyan line in Fig.3. The relation for quiescent galaxies (Eq.2) is shown with the red line for reference.
Using the Ks-M? relations for quiescent (Eq. 2) and
star-forming (Eq.3) galaxies, and assuming that UMPEGs have a mass of M?UMPEG= 1011.57M (the mean mass of our
10.5
11.0
11.5
log (
M /M
¯)
9.0
9.5
10.0
10.5
11.0
11.5
12.0
12.5
lo
g
(
M
/M
¯) /
M
pc
2 1 UMPEG 0.25 0.1 0.025 0.01M
∗ UMPEGs cumulative satellites PE satellites Wide PE satellites Deep SF satellites Wide SF satellites DeepFigure 5. The background-subtracted surface mass density of satellites within 0.5 Mpc of UMPEGs as a function of stellar mass. The black curve shows the cumulative number density of satel-lites: solid where we are complete and dashed to indicate the lower limit where we do not detect PE-gzKs galaxies. The location of
the characteristic Schechter mass, M?∗, is indicated. The dotted horizontal lines show (top to bottom) 1, 0.25, 0.1, 0.025, and 0.01 times the mass density of a typical (M?=1011.57M ) UMPEG if
that mass were distributed over the same projected area as the mass contained in the satellites.
UMPEG sample), we recast the data of Fig. 2in terms of stellar masses. The result is plotted in Fig.4. As that Figure shows, on average, UMPEGs have virtually no massive phys-ical companion galaxies (mass ratios M?sat : M?UMPEG >∼ 1:3). One has to integrate down to M?sat: M?UMPEG≈ 1:5.5 to find one satellite per UMPEG, on average.
We note that for a typical UMPEG with M?UMPEG ≈ 1011.6M , satellites of 1:5.5 mass ratio have stellar masses
M?sat= 0.18×M?UMPEG≈ 1010.8, which is similar to the char-acteristic Schechter mass of M?∗ ∼ 1010.6−10.8 for quiescent z∼1.6 galaxies (indicated with the arrow in Fig.4; Arcila-Osejo & Sawicki 2013;Ilbert et al. 2013;Muzzin et al. 2013a; Tomczak et al. 2014;Arcila-Osejo et al. 2019). Consequently, our “low-mass” UMPEG satellites are in fact very massive themselves. Nevertheless, in relative terms, they are of sig-nificantly lower mass than the mass of the UMPEGs that they are associated with and with which they will likely eventually merge.
We will consider how mergers – both minor and major – contribute to the growth of UMPEGs in the next section.
4.2 UMPEG growth through mergers 4.2.1 Growth rate estimate
It is interesting to consider how much (or how little) UMPEG masses can grow by absorbing stellar material from the galaxies we observe in their environment. For this, con-sider Fig. 5 which shows the stellar mass surface density in satellites out to our 0.5 Mpc search radius. The black line shows the cumulative surface stellar mass density con-tributed by the satellites and it is clear that the sum of the
masses of all major satellites of UMPEGs is quite small: for example, down to M?sat = 1011.0M ≈ 0.25×M?UMPEG, the
stellar masses of all the satellites add up just under a quar-ter the mass of the central UMPEG; down to M?sat= M?∗ = 1010.7M , the mass contained in satellites is only ∼40% times
the mass of the UMPEG. Clearly, there is not a lot of stel-lar material available for growth via major (M?:M?UMPEG> 1:4) mergers in the vicinity of the UMPEGs.
We can make a rough estimate of the mass accretion rate, for which we need a merger timescale. First, we make a crude estimate of the merger timescale, Tmerge, using the
dy-namical friction formula fromJiang et al.(2008, their Eq. 8). We assume a value ofε = 0.5, which is independent of the masses of the interacting galaxies (Jiang et al. 2008), and cir-cular velocity v ∼860 km/s (a velocity that relates to a high likelihood of interaction for close pairs;Patton et al. 2000). We also estimate Tmerge using the formula fromKitzbichler
& White(2008, their equation for ∆v < 3000 km s−1) that is calibrated for close pairs but does provide an estimate of Tmergealternative to that ofJiang et al.(2008).
Applying the two Tmergeestimators to the UMPEG
com-panions and summing over the sample after appropriately weighting by the fore/background counts, allows us to esti-mate the merger timescales, and then – incorporating our satellite mass estimates – to arrive at the mass accretion rates. The two merger timescale prescriptions yield accre-tion rates that are consistent for high-mass satellites but differ by up to a factor of ∼ 2 at lower M?sat. Taking the average of the two gives a growth rate of ∼13% Gyr−1for an UMPEG with M?UMPEG= 1011.6M , with an uncertainty of
a factor-of-two that’s driven by the systematic uncertainty in the Tmergeestimate.
4.2.2 Growth since z∼1.6
While we do not know whether the accretion rate remains constant for UMPEGs, there are indications for lower-mass central galaxies that satellites that are consumed are almost exactly replenished by new arrivals from beyond the halo (Tal et al. 2013;Hartley et al. 2015). It thus seems plausible that newly arriving satellites keep the UMPEG halos stocked with new arrivals as existing satellites sink towards the halo’s centre due to dynamical friction and are consumed by merg-ing with the UMPEGs. Takmerg-ing the estimated growth rate of ∼13% Gyr−1at face value would grow our fiducial UMPEG from M?UMPEG=1011.6M at z∼1.6 to M?z=0= 1011.9−12.1M
by z∼0 (the mass range reflects linear or exponential growth in the accretion rate. Notably, this forecast z∼0 UMPEG mass is comparable to the masses of BCGs in present-day massive galaxy clusters (M?∼ 1011.7M with a few examples
at M?> 1012M ; see compilation byLidman et al. 2012). For
example, the mass of NGC 4874 (one of the central galaxies of the Coma cluster) is M?∼ 1012.0(Veale et al. 2017).
Our mass growth calculation is crude as it assumes a constant merger rate (whereas – at least for lower-mass galaxies – merger rates decrease with time; e.g.,Patton et al. 2002; Bridge et al. 2010) and, moreover, does not account for accretion of low-mass satellites or for possible re-ignition of star formation in the UMPEGs. However, this rough cal-culation does yield a projected z∼0 UMPEG mass that is consistent with the masses of massive cluster BCGs at z∼0
LARgE Survey – III. Environments of z ∼ 1.6 UMPEGs
7
and thereby with the idea, first suggested on the basis ofclustering measurements in Cheema et al.(2020), that our z∼1.6 UMPEGs are the direct progenitors of some of the central BCGs of massive present-day galaxy clusters.
Our mass growth rate estimate appears to be some-what higher than that reported by Vulcani et al. (2016), who used the modified galaxy abundance-matching method ofMarchesini et al.(2014) to select the progenitors of mas-sive (M?> 1011.8M ) z∼0 galaxies at earlier epochs and then
used counts of their satellites to infer merger mass growth. Vulcani et al. report that a present-day M? >∼ 1011.8 mas-sive galaxy progenitor, which in their abundance-matching selection has a typical z∼1.7 mass of M?∼1011.35, can only
reach its final mass through a combination of mergers and in-situ star formation (roughly half of their progenitors are star-forming at 1.5 >∼ z∼ 2). This would appear at odds with> our conclusion, but we note some important differences be-tween the two studies: First, our UMPEGs are selected via clusering, rather than through galaxy abundance matching, so they may represent a different population; this, and the fact that our UMPEGs are selected to be quiescent – while the Vulcani et al.objects include a large number of star-forming systems – suggests that UMPEGs could be pref-erentially older systems, likely located in regions that col-lapsed earlier in the history of the Universe than those that host the typical object in theVulcani et al.sample. Second, our UMPEGs are more massive than theVulcani et al. ob-jects, which means they require less mass growth to reach the same final z∼0 mass. And third, it is likely that the masses of the star-forming (but not quiescent) galaxies in theVulcani et al.sample are underestimated (Sorba & Saw-icki 2018, and Sec. 4.1); accounting for this underestimate would make more satellite mass available for merging, mak-ing growth through mergers more efficient than estimated by Vulcani et al.; furthermore, the mass bias would also make the star-forming centrals in the Vulcani et al. more mas-sive, making it even easier for them to reach the target z∼0 mass. For these reasons, and also because our mass growth estimates are rather crude (as discussed earlier), we do not feel that the results of the two studies are in conflict. On the contrary, given the systematic effects discussed above, the results may give a consistent picture in which the z∼1.6 quiescent progenitors of present-day massive centrals grow through mergers alone, while their star-forming progenitors grow through a combination of mergers and (until quenched) in-situ star formation.
As a final point in this section we briefly discuss the effect of mergers on the evolution of the massive end of the stellar mass function. The relatively low mass growth rate from mergers that we estimate suggests that the evolution of the massive end of the stellar mass function of quiescent galaxies is not strongly affected by mergers. Instead, the growth seen from z∼1.6 to intermediate and low redshifts (Arcila-Osejo & Sawicki 2013; Muzzin et al. 2013a; Ilbert et al. 2013;Moutard et al. 2016b;Arcila-Osejo et al. 2019) must be primarily driven by the arrival of newly-quenched massive galaxies joining the quiescent population.
4.2.3 Growth before z∼1.6
It is also interesting to consider how our z∼1.6 UMPEGs may have grown from higher-redshift progenitors, and a clue lies
in the presence of the gap – noted in Sec.3– between the mass (or luminosity) of the UMPEG and the mass (or lumi-nosity) of its most massive (luminous) companion. In terms of luminosity, the gap is L1st sat/LUMPEG ∼ 0.25 (i.e., ∼ 1.5
mag), and is of similar size to the luminosity gap found for satellites of massive quiescent DRGs at z= 0.3 − 0.7 by (Tal et al. 2012, L1st sat/LDRG∼ 0.3 ). For our z∼1.6 UMPEGs, the gap in mass is M?1st sat/M?UMPEG∼ 5.5 (Fig.4).
The presence of a significant luminosity gap between the first and second most luminous group members can be interpreted as indicative of the age of the hosting environ-ment (e.g.,Tremaine & Richstone 1977;Van Den Bosch et al. 2007; Milosavljevi´c et al. 2006; Raouf et al. 2018; Dariush et al. 2010). This is because the most massive group mem-bers, which are the ones most strongly affected by dynamical friction, can be expected to merge rapidly, leaving behind only the less-massive satellites as these suffer less decelera-tion due to dynamical fricdecelera-tion. Major mergers thus provide a natural explanation for the presence of the luminosity (and mass) gap in our UMPEG environments.
Further evidence for this scenario is provided by the fact that about 10 percent of our original UMPEG can-didates, excluded from the sample, appear to be double-cored systems (seeArcila-Osejo et al. 2019). These systems may be late-stage mergers of pairs of massive and already-quiescent UMPEG building blocks (so-called “dry mergers”). Of course, mergers that build UMPEGs might also be wet (i.e., gas-rich and resulting in additional star-formation), but we have no immediate way of observationally linking our UMPEGs to such wet merger progenitors with the present data. We note that our UMPEGs cluster extremely strongly (seeCheema et al. 2020) – much more strongly that do po-tential high-z massive wet merger candidates such as sub-millimetre galaxies (SMGs, e.g.,Blain et al. 2004; Hickox et al. 2012;Wilkinson et al. 2017) or Dust Obscured Galaxies (DOGs, e.g.,Brodwin et al. 2008;Toba et al. 2017). It there-fore seems that UMPEGs are associated with more massive, rarer dark matter halos than is typical of high-z starbursts. This clustering argument does not rule out the possibility of wet mergers as UMPEG progenitors, but it does suggest that if SMGs and DOGs are wet mergers, the majority of them are not the wet mergers that later quenched to become UMPEGs.
It is also interesting to consider if the mass accretion rate we estimated in Sec.4.2.2 is consistent with the ma-jor merger scenario. By construction, this merger rate es-timate is for major mergers (M:M?UMPEG= 1:4). Apply-ing the ∼13% Gyr−1 estimated growth rate to our fiducial M?UMPEG= 1011.57M galaxy, and assuming for simplicity
that major mergers are the only mass growth mechanism, we get a z = 4 mass of M?= 1011.43M (given the short
time-span between z= 4 and z = 1.6, the numbers are al-most the same for linear and exponential growth and so we took the average of the two here). This growth could, for example, be accomplished through a single ∼3:1 merger (1011.43M + 1011.00M → 1011.57M ). In this context it is
interesting to note again that ∼10% of our initial UMPEG candidates inArcila-Osejo et al.(2019) were rejected when visual inspection revealed them to have two sub-M?UMPEG components; these rejected candidates could represent on-going major mergers that will coalesce into UMPEGs over MNRAS 000,1–10(2020)
time, consistent with the major-merger scenario of UMPEG growth.
Finally, the inferred z∼4 mass of MUMPEGz=4 = 1011.43M can also be compared with the masses of the
photometrically-selected z∼4 quiescent galaxies of Kubo et al. (2018, M? = 1011.02−11.26M ), or with the masses
of the most extreme, spectroscopically-confirmed examples (M?=1011.23M , Glazebrook et al. 2017; M?=1011.49M ,
Forrest et al. 2019). Most of these masses are somewhat lower than those of our projected UMPEG progenitors, but not dramatically so, and so it could be expected that signif-icant numbers of high-mass z∼4 quiescent galaxies would be found in larger-area surveys. It seems that these ob-served z∼4 quiescent galaxies could potentially grow into z∼1.6 UMPEGs, and then z∼0 BCGs, through a combina-tion of major and minor mergers. In this context we note that Kubo et al.(2018) present evidence for the growth of z∼4 massive galaxies through minor mergers, whileShi et al. (2019) report a significant number of massive (M?> 1011M )
quiescent galaxy candidates in a z∼4 protocluster that they interpret as the central galaxies of massive (sub)haloes that one could expect to merge as the protocluster coalesces. In further agreement with this scenario, Marsan et al.(2019) and Stockmann et al.(2020) report that many of their ul-tramassive quiescent galaxies at z∼1.5–2.5 show signs of in-teractions and mergers.
Overall, the arguments we presented suggest a scenario in which galaxies that follow the UMPEG evolutionary path-way may grow through major mergers at very high redshifts, z > 1.6, before being observed as quiescent UMPEGs at z∼1.6, and then growing mildly mostly through minor merg-ers at lower redshifts.
5 CONCLUSIONS
In this paper we examined the environments of 61 ultra-massive (M?> 1011.5M ) galaxies that were already
quies-cent by z∼1.6 – i.e., near the peak epoch of cosmic star formation. These galaxies form the most massive part of the galaxy population at these redshifts (Arcila-Osejo et al. 2019), and their extremely strong clustering suggests that they are associated with dark matter halos that will grow into present-day massive galaxy clusters (Cheema et al. 2020).
Our analysis in this paper focused on the number of companions within 0.5 Mpc of our UMPEGs. In their deep-est part, our data allow us to detect both quiescent and star-forming companions down to M?sat∼M?∗, or a mass ratio of M?sat:M?UMPEG∼1:7.5; meanwhile, the wide area of the sur-vey lets us apply a statistical fore/background correction to infer the number of physically associated massive satellites.
The main findings of our analysis are as follows: (i) UMPEGs at z∼1.6 have very few companions of com-parable mass: UMPEGs have virtually no massive physical companion galaxies (mass ratios M?sat : M?UMPEG >∼ 1:3), and on average have only one satellite per UMPEG down to mass ratio M?sat: M?UMPEG∼ 1 : 5.5.
(ii) Given this paucity of companions, there is at present no strong evidence from galaxy counts that UMPEGs reside in overdense regions. However, this is likely simply because
our relatively shallow data do not probe sufficiently deep to find satellites in significant numbers: in the Wide fields, where the bulk (∼ 90%) of our sample resides, we are com-plete to M? ≈ M?∗ ≈ 1010.7M and deeper data are needed
to reach the bulk of the galaxy population at M? ≈ M?∗ and below. Indeed, in the Deep fields (where we only have six UMPEGs given the small total area of these fields, but where we reach lower companion masses) such lower-mass companions are seen, with a large luminosity (or mass) gap between the UMPEG and their brightest (most massive) satellites.
(iii) The presence of the luminosity (mass) gap suggests that UMPEGs reside in environments that have formed sig-nificantly before we observe them at z∼1.6. In this scenario, dynamical friction leads to rapid merging of the most mas-sive galaxies and leaves behind only lower-mass satellites, which take longer to merge. This suggests that UMPEG pro-genitors may have assembled via major (mass ratio> 1:4) mergers at z> 1.6.
(iv) We estimate the UMPEG mass accretion rate due to mergers with satellites of mass ratio M?sat : M?UMPEG > 1 : 4 to be ∼13% Gyr−1 with a ∼factor-of-two systematic
uncertainty. Projected back in time, the estimated growth rate suggests that at z∼4 the typical progenitor of a z∼1.6 UMPEG had a stellar mass of ∼ 1011.43M (if that
pro-genitor was star-forming, its z∼4 mass would have been lower). Evolution from z∼4 to z∼1.6 could have been ac-complished by major mergers, with typically a single major merger (as expected from the presence of the mass gap) with mass ratio of ∼2.7:1 being enough to grow the mass to the M?UMPEG∼ 1011.57M observed at z∼1.6. In addition to the
presence of the mass gap, such early growth through major mergers is also supported by the fact that ∼10% of our orig-inal UMPEG candidates are double-cored and thus possibly undergoing mergers.
(v) Were the estimated merger rate continue to z∼0, then a typical UMPEG, with M?UMPEG∼ 1011.6M at z∼1.6
would grow to M?∼ 1012.0through mergers with such rela-tively massive companions. This projected z∼0 mass is con-sistent with the masses of present-day massive cluster BCGs lending further support to the idea (raised byCheema et al. 2020) that UMPEGs are the direct, already-quiescent and massive progenitors of the central galaxies of some of the present-day massive galaxy clusters such as Virgo and Coma. (vi) The estimated growth rate (∼13% Gyr−1) is relatively mild and thus is unlikely to significantly affect the shape of the steep, exponential end of the galaxy stellar mass func-tion of passive galaxies. Any such (minor) merger-induced change in M∗ will be obscured by the addition of newly-quenched massive galaxies, and the Schechter function of quiescent galaxies can be regarded as primarily a reflection of the mass-quenching process (Peng et al. 2010).
Overall, the results presented in the present paper are consistent with the idea that z∼1.6 UMPEGs may be the direct, largely-formed progenitors of some (∼1-in-8;Cheema et al. 2020) of the central galaxies in present-day massive clusters. It seems plausible that galaxies that follow the UMPEG evolutionary pathway may grow through major mergers at very high redshifts, z> 1.6 before being observed as quiescent UMPEGs at z∼1.6, and then growing mildly mostly through minor mergers at lower redshifts.
LARgE Survey – III. Environments of z ∼ 1.6 UMPEGs
9
A detailed understanding of how such progenitorgalax-ies already assembled and quenched by z∼1.6 remains a topic for further study, but our sample of high-z UMPEGs offers opportunities for such work through follow-up spectroscopy that can constrain their metallicities and, hence assembly pathways, and through deeper imaging that can probe for evidence of merger events and search for fainter companions that could be used for halo occupation distribution (HOD) analyses.
ACKNOWLEDGMENTS
We thank Ivana Damjanov, Laura Parker, and Rob Thacker for their useful suggestions, and the Natural Sciences and Engineering Research Council (NSERC) of Canada for fi-nancial support. MS is grateful to the Herzberg Astronomy and Astrophysics Research Centre for hosting his sabbatical, during which parts of this paper were written.
This work is based on observations obtained with-MegaPrime/MegaCam, a joint project of CFHT and CEA/DAPNIA, at the Canada-France-Hawaii Telescope (CFHT) which is operatedby the National Research Coun-cil (NRC) of Canada, the Institut National des Science de l’Univers of the Centre National de la Recherche Scientifique (CNRS) of France, and the University of Hawaii. This work uses data products from TERAPIX and theCanadian As-tronomy Data Centre. It makes use of the VIPERS-MLS database, operated at CeSAM/LAM, Marseille, France. This work is based in part on observations obtained with WIRCam, a joint project of CFHT, Taiwan, Korea, Canada and France. The research was carried out using computing resources from ACEnet and Compute Canada.
REFERENCES
Abdurro’uf ., Akiyama M., 2018,Monthly Notices of the Royal Astronomical Society, 479, 5083
Arcila-Osejo L., Sawicki M., 2013,Monthly Notices of the Royal Astronomical Society, 435, 845
Arcila-Osejo L., Sawicki M., Arnouts S., Golob A., Moutard T., Sorba R., 2019,Monthly Notices of the Royal Astronomical Society, 486, 4880
Belli S., Newman A. B., Ellis R. S., 2016,The Astrophysical Jour-nal, 834, 18
Bertin E., Arnouts S., 1996,Astron. Astrophys. Suppl. Ser., 117, 393
Bielby R., et al., 2012,Astronomy & Astrophysics, 545, A23 Blain A. W., Chapman S. C., Smail I., Ivison R., 2004,The
As-trophysical Journal, 611, 725
Bridge C. R., Carlberg R. G., Sullivan M., 2010,The Astrophys-ical Journal, 709, 1067
Brodwin M., et al., 2008,The Astrophysical Journal, 687, L65 Burke C., Collins C. A., 2013,Monthly Notices of the Royal
As-tronomical Society, 434, 2856
Chabrier G., 2003,Publications of the Astronomical Society of the Pacific, 115, 763
Chandrasekhar S., 1943,The Astrophysical Journal,97, 255
Cheema G. K., Sawicki M., Arcila-Osejo L., Golob A., Moutard T., Arnouts S., Coupon J., 2020,Monthly Notices of the Royal Astronomical Society, in press, arXiv:2002.12891
Contini E., De Lucia G., Hatch N., Borgani S., Kang X., 2016,
Monthly Notices of the Royal Astronomical Society, 456, 1924
Cooke K. C., Kartaltepe J. S., Tyler K. D., Darvish B., Casey C. M., F˜A´lvre O. L., Salvato M., Scoville N., 2019, The As-trophysical Journal, 881, 150
Daddi E., Cimatti A., Renzini A., Fontana A., Mignoli M., Pozzetti L., Tozzi P., Zamorani G., 2004,The Astrophysical Journal, 617, 746
Dariush A. A., Raychaudhury S., Ponman T. J., Khosroshahi H. G., Benson A. J., Bower R. G., Pearce F., 2010,Monthly Notices of the Royal Astronomical Society
De Lucia G., Blaizot J., 2007,Monthly Notices of the Royal As-tronomical Society, 375, 2
Edwards L. O. V., Patton D. R., 2012,Monthly Notices of the Royal Astronomical Society, 425, 287
Forrest B., et al., 2019, arXiv:1910.10158 [astro-ph]
Fraser-McKelvie A., Brown M. J. I., Pimbblet K. A., 2014,
Monthly Notices of the Royal Astronomical Society: Letters, 444, L63
Glazebrook K., et al., 2017,Nature,544, 71
Goranova Y., Hudelot P., McCracken H. J., Mellier Y., 2010, The CFHTLS T0006 release
Hartley W. G., Conselice C. J., Mortlock A., Foucaud S., Simpson C., 2015,Monthly Notices of the Royal Astronomical Society, 451, 1613
Hickox R. C., et al., 2012,Monthly Notices of the Royal Astro-nomical Society, pp no–no
Ilbert O., et al., 2013,Astronomy and Astrophysics, 556, A55 Jiang C. Y., Jing Y. P., Faltenbacher A., Lin W. P., Li C., 2008,
The Astrophysical Journal, 675, 1095
Johnston R., Vaccari M., Jarvis M., Smith M., Giovannoli E., H¨außler B., Prescott M., 2015,Monthly Notices of the Royal Astronomical Society, 453, 2541
Jones L. R., Ponman T. J., Forbes D. A., 2000,Monthly Notices of the Royal Astronomical Society, 312, 139
Kado-Fong E., et al., 2017,The Astrophysical Journal, 838, 57 Kauffmann G., White S. D. M., 1993,Monthly Notices of the
Royal Astronomical Society, 261
Kawinwanichakij L., et al., 2014,The Astrophysical Journal, 792, 103
Kitzbichler M. G., White S. D. M., 2008,Monthly Notices of the Royal Astronomical Society, 391, 1489
Kubo M., Tanaka M., Yabe K., Toft S., Stockmann M., G´ omez-Guijarro C., 2018,The Astrophysical Journal, 867, 1 Lidman C., et al., 2012,Monthly Notices of the Royal
Astronom-ical Society, 427, 550
Lidman C., et al., 2013,Monthly Notices of the Royal Astronom-ical Society, 433, 825
Liu F. S., Mao S., Meng X. M., 2012, Monthly Notices of the Royal Astronomical Society, 423, 422
Liu F. S., Lei F. J., Meng X. M., Jiang D. F., 2015,Monthly Notices of the Royal Astronomical Society, 447, 1491 Lotz J. M., et al., 2008,The Astrophysical Journal, 672, 177 Marchesini D., et al., 2014,The Astrophysical Journal,794, 65
Marsan Z. C., et al., 2019,The Astrophysical Journal, 871, 201 McDonald M., et al., 2016,The Astrophysical Journal, 817, 86 Milosavljevi´c M., Miller C. J., Furlanetto S. R., Cooray A., 2006,
The Astrophysical Journal, 637, L9
Moutard T., et al., 2016a,Astronomy & Astrophysics, 590, A102 Moutard T., et al., 2016b,Astronomy & Astrophysics,590, A103
Munoz-Cuartas J. C., Maccio A. V., Gottlober S., Dutton A. A., 2011, Monthly Notices of the Royal Astronomical Society, 411, 584
Muzzin A., et al., 2013a,The Astrophysical Journal, 777, 18 Muzzin A., et al., 2013b,The Astrophysical Journal Supplement
Series, 2068
Oke J. B., 1974,ApJS,27, 21
Onodera M., et al., 2012,The Astrophysical Journal, 755, 26 Ostriker J. P., Tremaine S. D., 1975,The Astrophysical Journal,
202, L113 MNRAS 000,1–10(2020)
Patton D. R., Carlberg R. G., Marzke R. O., Pritchet C. J., da Costa L. N., Pellegrini P. S., 2000,The Astrophysical Journal,
536, 153
Patton D. R., et al., 2002,The Astrophysical Journal, 565, 208 Peng Y.-J., et al., 2010,The Astrophysical Journal, 721, 193 Ragone-Figueroa C., Granato G. L., Ferraro M. E., Murante G.,
Biffi V., Borgani S., Planelles S., Rasia E., 2018, Monthly Notices of the Royal Astronomical Society, 479, 1125 Raouf M., Khosroshahi H. G., Mamon G. A., Croton D. J.,
Hashemizadeh A., Dariush A. A., 2018, The Astrophysical Journal, 863, 40
Sawicki M., Yee H. K. C., 1998,The Astronomical Journal, 115, 1329
Shi K., et al., 2019,The Astrophysical Journal, 871, 83
Sorba R., Sawicki M., 2015,Monthly Notices of the Royal Astro-nomical Society, 452, 235
Sorba R., Sawicki M., 2018,Monthly Notices of the Royal Astro-nomical Society, 476, 1532
Stockmann M., et al., 2020,The Astrophysical Journal, 888, 4 Tal T., Wake D. A., van Dokkum P. G., van den Bosch F. C.,
Schneider D. P., Brinkmann J., Weaver B. A., 2012,The As-trophysical Journal, 746, 138
Tal T., van Dokkum P. G., Franx M., Leja J., Wake D. A., Whitaker K. E., 2013,The Astrophysical Journal,769, 31
Toba Y., et al., 2017,The Astrophysical Journal, 835, 36 Tomczak A., et al., 2014,The Astrophysical Journal, 783, 85 Tremaine S. D., Richstone D. O., 1977,The Astrophysical
Jour-nal, 212, 311
Van Den Bosch F. C., et al., 2007,Monthly Notices of the Royal Astronomical Society, 376, 841
Veale M., Ma C.-P., Greene J. E., Thomas J., Blakeslee J. P., McConnell N., Walsh J. L., Ito J., 2017,The Monthly Notices of the Royal Astronomical Society,471, 1428
Vulcani B., et al., 2016,The Astrophysical Journal, 816, 86 Whitaker K. E., et al., 2014,The Astrophysical Journal, 795, 104 White S. D. M., Frenk C. S., 1991,The Astrophysical Journal,
379, 52
White S. D. M., Rees M. J., 1978,Monthly Notices of the Royal Astronomical Society, 183, 341
Wilkinson A., et al., 2017,Monthly Notices of the Royal Astro-nomical Society, 464, 1380
Wright E., 2006,Publications of the Astronomical Society of the Pacific, 118, 1711
Zhao D., Conselice C. J., Arag´on-Salamanca A., Almaini O., Hartley W. G., Lani C., Mortlock A., Old L., 2017,Monthly Notices of the Royal Astronomical Society, 464, 1393 Zibetti S., Charlot S., Rix H.-W., 2009,Monthly Notices of the
Royal Astronomical Society, 400, 1181
This paper has been typeset from a TEX/LATEX file prepared by