Klepsatel et al., Supporting Information
Supporting Figure Legends
Figure S1. Relationship between log(wing area) and log(cell number) in females from the
Austrian outbred population and the Ethiopian isofemale line. The slopes of the regression did not differ among populations (Austria: R2 = 0.67, P < 0.0001; Ethiopia: R2 = 0.67, P < 0.0001; F-test for parallelism: s = 0.67 0.002, F1, 46 = 0.38, P = 0.54). See text for details.
Figure S2. Relation between log(wing area) and log(cell size) in females from the Austrian
outbred population and the Ethiopian isofemale line. The slopes of the regression did not differ among populations (Austria: R2 = 0.26, P = 0.004; Ethiopia: R2 = 0.45, P = 0.001; F-test for parallelism: s = 0.34 0.002, F1, 46 = 0.45, P = 0.5). See text for details.
Figure S3. Relationship between thorax length and ovariole number in females from the
Austrian outbred population and the Ethiopian isofemale line. The slopes of the regression did not differ among populations (Austria: R2 = 0.48, P < 0.0001; Ethiopia: R2 = 0.39, P = 0.004; F-test for parallelism: s = 60.04 42.31, F1, 45 = 0.02, P = 0.88). See text for details.
Figure S4. Relationship between thorax length and wing area in females from the Austrian
outbred population and the Ethiopian isofemale line. The slopes of the regression differed among populations (Austria: s = 2.09 ± 0.25, R2 = 0.71, P < 0.0001; Ethiopia: s = 3.46 ± 0.21, R2 = 0.94, P < 0.0001; F-test for parallelism: F1, 46 = 14.06, P = 0.0005). See text for
details.
Figure S5. Relationship between thorax length and wing loading (thorax length)3/wing area in females from the Austrian outbred population and the Ethiopian isofemale line. The
Klepsatel et al., Supporting Information
slopes of the regression differed among populations (Austria: s = 1.04 ± 0.1, R2 = 0.80, P < 0.0001; Ethiopia: s = 0.62 ± 0.06, R2 = 0.87, P < 0.0001; F-test for parallelism: F1, 46 =
9.86, P = 0.003). See text for details.
Figure S6. Measurements of morphological traits in y w; P0206-GAL4>UAS-PTEN
females in comparison to controls: y w; P0206-GAL4 and y w; UAS-PTEN females. (a) Thorax length. (b) Wing area. (c) Wing cell number. (d) Ovariole number. *P < 0.05. See
text for details.
Figure S7. Comparison of egg production rate per ovariole in Austrian and Zambian flies
that developed at 18°C or 25°C. *P < 0.05. Fecundity (egg production) was defined as the
mean cumulative number of eggs laid per female during the first 10 days of adulthood. See text for details.
Klepsatel et al., Supporting Information Figure S1.
Klepsatel et al., Supporting Information Figure S2.
Klepsatel et al., Supporting Information Figure S3.
Klepsatel et al., Supporting Information Figure S4.
Klepsatel et al., Supporting Information Figure S5.
Klepsatel et al., Supporting Information Figure S6a.
Klepsatel et al., Supporting Information Figure S6c.
Klepsatel et al., Supporting Information Figure S7.
Klepsatel et al., Supporting Information
Table S1. Climate data for different populations. See text for further details.
Population Locality Mean annual temperature (°C ) Mean seasonal temperature (°C ) Mean temperature of the hottest month
(°C )
Mean temperature of the coldest month
(°C )
Difference between the hottest and the
coldest month (°C )
Difference between the hottest and the coldest month of the
season (°C ) Mean monthly precipitation (mm) Mean monthly precipitation during the season (mm) Season length (month)
South Africa Paarl
16.7 16.7 21.1 12.7 8.4 8.4 42.9 42.9 12
South Africa Phalaborwa
22.5 22.5 26.5 17.5 9 9 44.2 44.2 12 Madagascar Antananarivo 18.3 18.3 20.5 15 5.5 5.5 106.5 106.5 12 Zimbabwe Harare 18.9 18.9 21.7 14.1 7.6 7.6 70.1 70.1 12 Zambia Siavonga 24.3 24.3 29 18.5 10.5 10.5 63.9 63.9 12 Tanzania Uyole 17.7 17.7 20.5 14.5 6 6 79.6 79.6 12 Rwanda Gikongoro 21.0 21.0 21.6 20.3 1.3 1.3 85.1 85.1 12 Gabon Franceville 24.4 24.4 25.5 23 2.5 2.5 154.8 154.8 12 Kenya Thika 17.7 17.7 19.4 15.4 4 4 85.4 85.4 12 Cameroon Oku 16.8 16.8 18.2 15.2 3 3 206 206 12 Ethiopia Dodola 13.9 13.9 15.5 13 2.5 2.5 71 71 12 Ethiopia Gambella 27.7 27.7 30.5 26 4.5 4.5 99.8 99.8 12 Ethiopia Fiche 16.9 16.9 18.5 16 2.5 2.5 99.3 99.3 12
Egypt New Cairo
21.8 21.8 28.4 14.0 14.4 14.4 2.17 2.2 12 Portugal Évora 15.7 19.1 23 9.5 13.5 10 51.5 32.6 7 Switzerland Zürich 8.8 15.6 18 -0.5 18.5 5.5 90.5 113.8 5 Austria Vienna 9.8 17.6 20 -1.5 21.5 5.5 50.6 60.2 5
England Royal Tunbridge
Wells
11.0 15.9 18 4.8 13.2 6.0 62.8 59 5
Sweden Uppsala
Klepsatel et al., Supporting Information
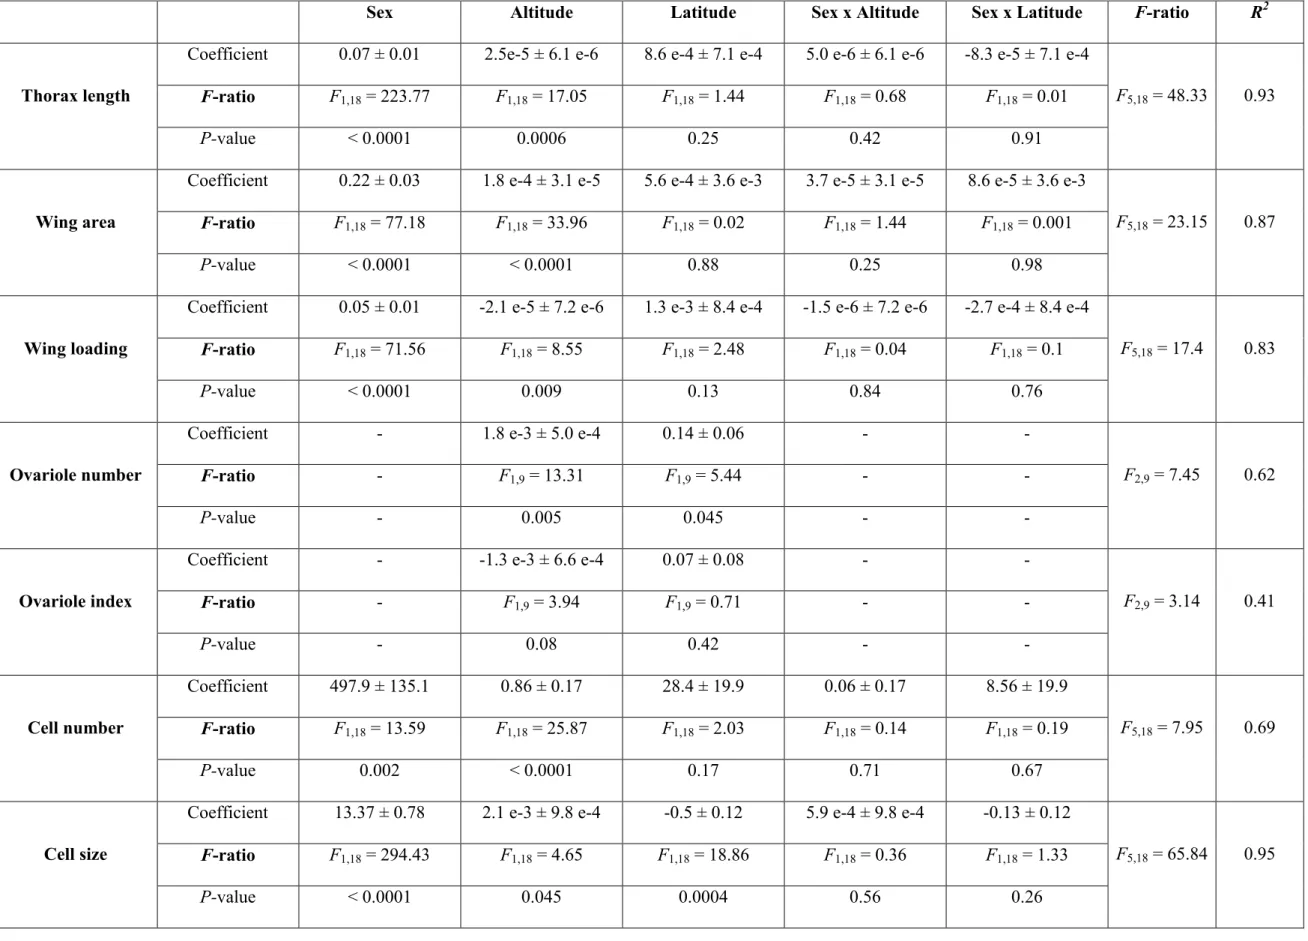
Table S2. Multiple regression analyses of the effects of altitude, latitude and sex on variation in morphological traits in populations from latitudes between 30°N and 30°S. e(number) = 10(number). See text for further details.
Sex Altitude Latitude Sex x Altitude Sex x Latitude F-ratio R2
Thorax length
Coefficient 0.07 ± 0.01 2.5e-5 ± 6.1 e-6 8.6 e-4 ± 7.1 e-4 5.0 e-6 ± 6.1 e-6 -8.3 e-5 ± 7.1 e-4
F5,18 = 48.33 0.93 F-ratio F1,18 = 223.77 F1,18 = 17.05 F1,18 = 1.44 F1,18 = 0.68 F1,18 = 0.01
P-value < 0.0001 0.0006 0.25 0.42 0.91
Wing area
Coefficient 0.22 ± 0.03 1.8 e-4 ± 3.1 e-5 5.6 e-4 ± 3.6 e-3 3.7 e-5 ± 3.1 e-5 8.6 e-5 ± 3.6 e-3
F5,18 = 23.15 0.87 F-ratio F1,18 = 77.18 F1,18 = 33.96 F1,18 = 0.02 F1,18 = 1.44 F1,18 = 0.001
P-value < 0.0001 < 0.0001 0.88 0.25 0.98
Wing loading
Coefficient 0.05 ± 0.01 -2.1 e-5 ± 7.2 e-6 1.3 e-3 ± 8.4 e-4 -1.5 e-6 ± 7.2 e-6 -2.7 e-4 ± 8.4 e-4
F5,18 = 17.4 0.83
F-ratio F1,18 = 71.56 F1,18 = 8.55 F1,18 = 2.48 F1,18 = 0.04 F1,18 = 0.1
P-value < 0.0001 0.009 0.13 0.84 0.76
Ovariole number
Coefficient - 1.8 e-3 ± 5.0 e-4 0.14 ± 0.06 - -
F2,9 = 7.45 0.62
F-ratio - F1,9 = 13.31 F1,9 = 5.44 - -
P-value - 0.005 0.045 - -
Ovariole index
Coefficient - -1.3 e-3 ± 6.6 e-4 0.07 ± 0.08 - -
F2,9 = 3.14 0.41 F-ratio - F1,9 = 3.94 F1,9 = 0.71 - - P-value - 0.08 0.42 - - Cell number Coefficient 497.9 ± 135.1 0.86 ± 0.17 28.4 ± 19.9 0.06 ± 0.17 8.56 ± 19.9 F5,18 = 7.95 0.69 F-ratio F1,18 = 13.59 F1,18 = 25.87 F1,18 = 2.03 F1,18 = 0.14 F1,18 = 0.19 P-value 0.002 < 0.0001 0.17 0.71 0.67 Cell size
Coefficient 13.37 ± 0.78 2.1 e-3 ± 9.8 e-4 -0.5 ± 0.12 5.9 e-4 ± 9.8 e-4 -0.13 ± 0.12
F5,18 = 65.84 0.95 F-ratio F1,18 = 294.43 F1,18 = 4.65 F1,18 = 18.86 F1,18 = 0.36 F1,18 = 1.33
Klepsatel et al., Supporting Information
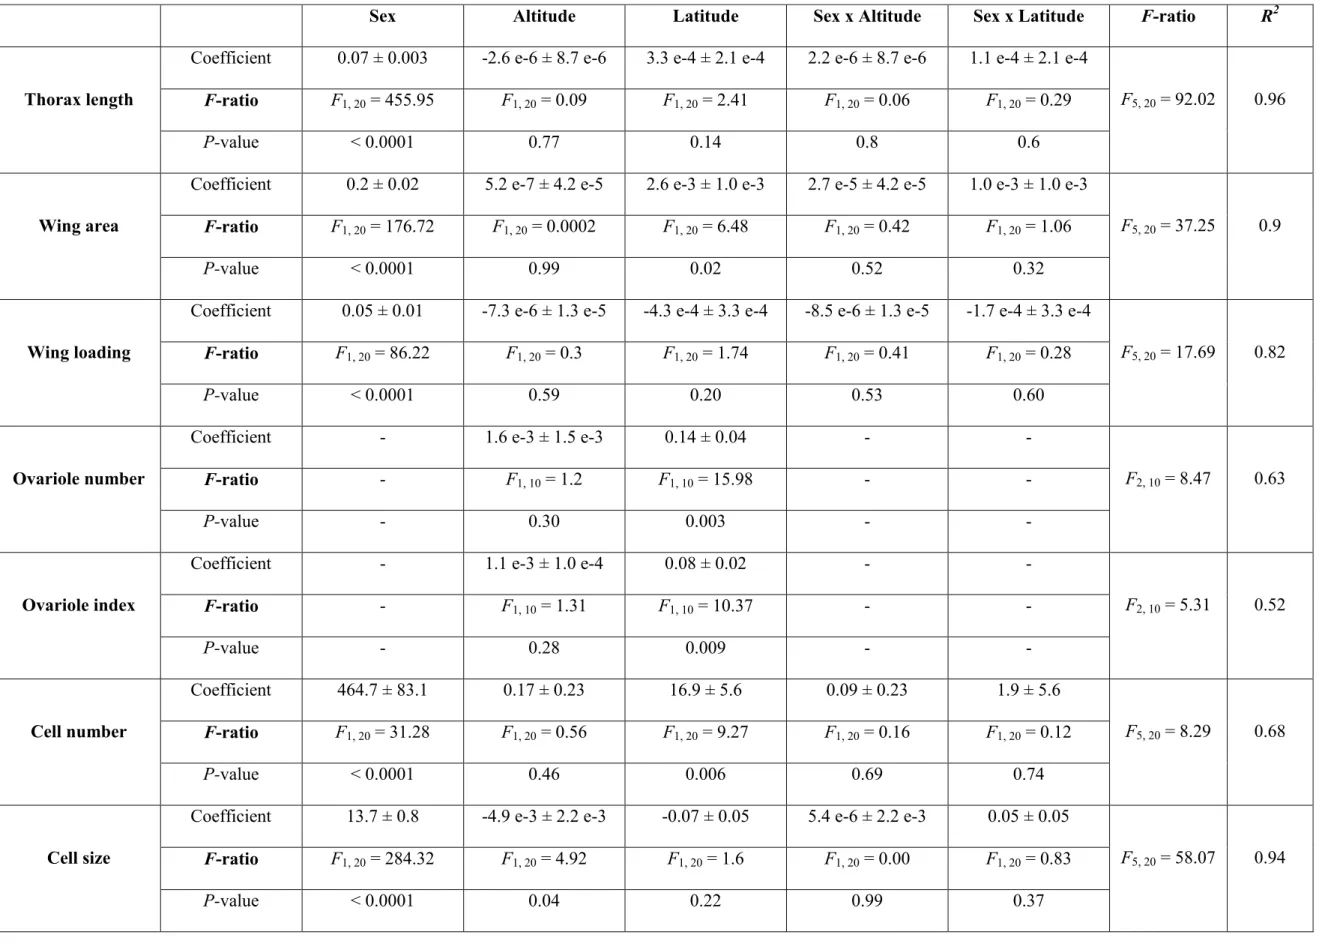
Table S3. Multiple regression analyses of the effects of altitude, latitude and sex on variation in morphological traits in populations with elevations below 1500 m AMSL. e(number) = 10(number). See text for further details.
Sex Altitude Latitude Sex x Altitude Sex x Latitude F-ratio R2
Thorax length
Coefficient 0.07 ± 0.003 -2.6 e-6 ± 8.7 e-6 3.3 e-4 ± 2.1 e-4 2.2 e-6 ± 8.7 e-6 1.1 e-4 ± 2.1 e-4
F5, 20 = 92.02 0.96 F-ratio F1, 20 = 455.95 F1, 20 = 0.09 F1, 20 = 2.41 F1, 20 = 0.06 F1, 20 = 0.29
P-value < 0.0001 0.77 0.14 0.8 0.6
Wing area
Coefficient 0.2 ± 0.02 5.2 e-7 ± 4.2 e-5 2.6 e-3 ± 1.0 e-3 2.7 e-5 ± 4.2 e-5 1.0 e-3 ± 1.0 e-3
F5, 20 = 37.25 0.9 F-ratio F1, 20 = 176.72 F1, 20 = 0.0002 F1, 20 = 6.48 F1, 20 = 0.42 F1, 20 = 1.06
P-value < 0.0001 0.99 0.02 0.52 0.32
Wing loading
Coefficient 0.05 ± 0.01 -7.3 e-6 ± 1.3 e-5 -4.3 e-4 ± 3.3 e-4 -8.5 e-6 ± 1.3 e-5 -1.7 e-4 ± 3.3 e-4
F5, 20 = 17.69 0.82 F-ratio F1, 20 = 86.22 F1, 20 = 0.3 F1, 20 = 1.74 F1, 20 = 0.41 F1, 20 = 0.28
P-value < 0.0001 0.59 0.20 0.53 0.60
Ovariole number
Coefficient - 1.6 e-3 ± 1.5 e-3 0.14 ± 0.04 - -
F2, 10 = 8.47 0.63
F-ratio - F1, 10 = 1.2 F1, 10 = 15.98 - -
P-value - 0.30 0.003 - -
Ovariole index
Coefficient - 1.1 e-3 ± 1.0 e-4 0.08 ± 0.02 - -
F2, 10 = 5.31 0.52 F-ratio - F1, 10 = 1.31 F1, 10 = 10.37 - - P-value - 0.28 0.009 - - Cell number Coefficient 464.7 ± 83.1 0.17 ± 0.23 16.9 ± 5.6 0.09 ± 0.23 1.9 ± 5.6 F5, 20 = 8.29 0.68 F-ratio F1, 20 = 31.28 F1, 20 = 0.56 F1, 20 = 9.27 F1, 20 = 0.16 F1, 20 = 0.12 P-value < 0.0001 0.46 0.006 0.69 0.74 Cell size
Coefficient 13.7 ± 0.8 -4.9 e-3 ± 2.2 e-3 -0.07 ± 0.05 5.4 e-6 ± 2.2 e-3 0.05 ± 0.05
F5, 20 = 58.07 0.94 F-ratio F1, 20 = 284.32 F1, 20 = 4.92 F1, 20 = 1.6 F1, 20 = 0.00 F1, 20 = 0.83
Klepsatel et al., Supporting Information
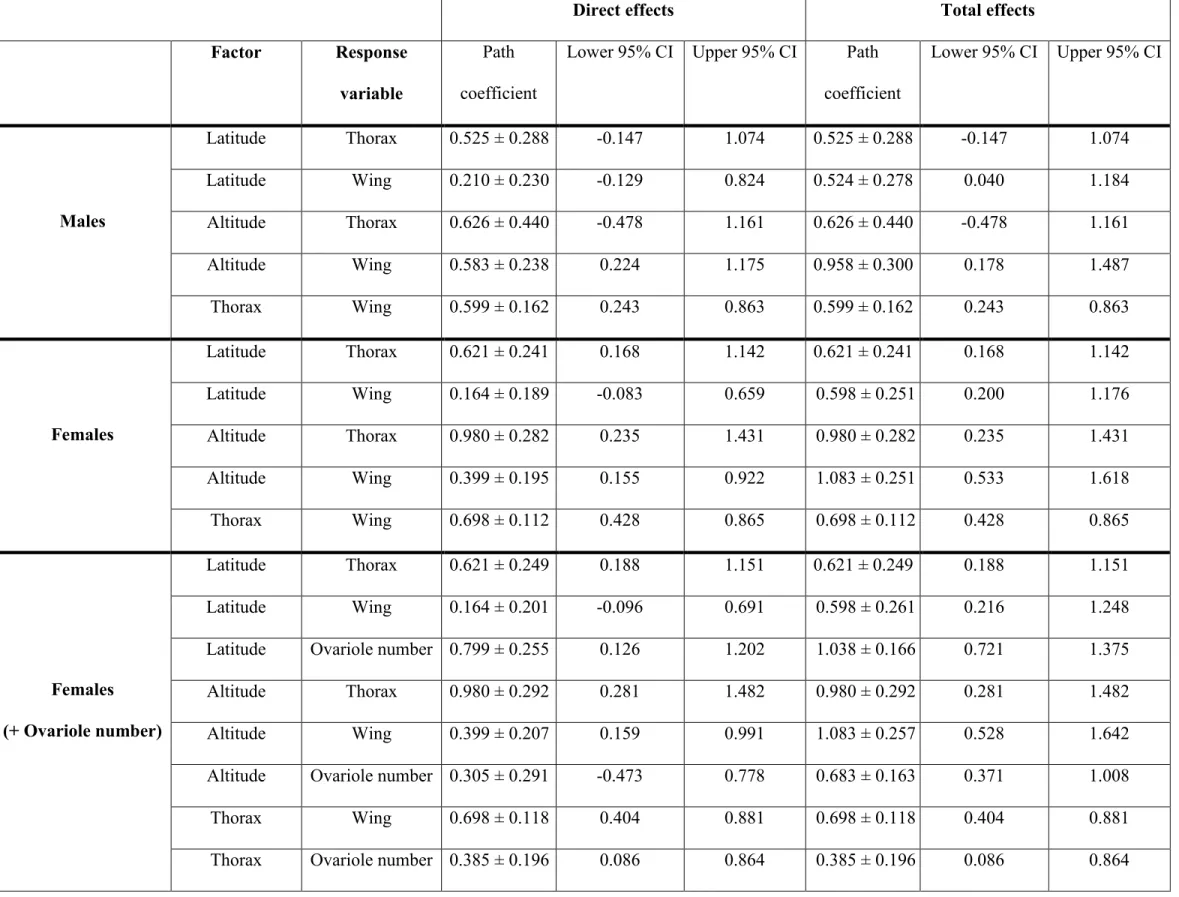
Table S4. Path coefficients and their 95% confidence limits from the path model of altitudinal and latitudinal effects on thorax length, wing area and ovariole number. In females,
the path model was constructed without (Females) and with ovariole number (Females + Ovariole number). Direct effect is the effect of one variable (factor) on another variable (response variable), which is represented in the model by a single (direct) path; indirect effect passes through some other variable. Total effect is the combination of the direct and indirect effects.
Direct effects Total effects
Factor Response variable
Path coefficient
Lower 95% CI Upper 95% CI Path
coefficient Lower 95% CI Upper 95% CI Males Latitude Thorax 0.525 ± 0.288 -0.147 1.074 0.525 ± 0.288 -0.147 1.074 Latitude Wing 0.210 ± 0.230 -0.129 0.824 0.524 ± 0.278 0.040 1.184 Altitude Thorax 0.626 ± 0.440 -0.478 1.161 0.626 ± 0.440 -0.478 1.161 Altitude Wing 0.583 ± 0.238 0.224 1.175 0.958 ± 0.300 0.178 1.487 Thorax Wing 0.599 ± 0.162 0.243 0.863 0.599 ± 0.162 0.243 0.863 Females Latitude Thorax 0.621 ± 0.241 0.168 1.142 0.621 ± 0.241 0.168 1.142 Latitude Wing 0.164 ± 0.189 -0.083 0.659 0.598 ± 0.251 0.200 1.176 Altitude Thorax 0.980 ± 0.282 0.235 1.431 0.980 ± 0.282 0.235 1.431 Altitude Wing 0.399 ± 0.195 0.155 0.922 1.083 ± 0.251 0.533 1.618 Thorax Wing 0.698 ± 0.112 0.428 0.865 0.698 ± 0.112 0.428 0.865 Females (+ Ovariole number) Latitude Thorax 0.621 ± 0.249 0.188 1.151 0.621 ± 0.249 0.188 1.151 Latitude Wing 0.164 ± 0.201 -0.096 0.691 0.598 ± 0.261 0.216 1.248
Latitude Ovariole number 0.799 ± 0.255 0.126 1.202 1.038 ± 0.166 0.721 1.375
Altitude Thorax 0.980 ± 0.292 0.281 1.482 0.980 ± 0.292 0.281 1.482
Altitude Wing 0.399 ± 0.207 0.159 0.991 1.083 ± 0.257 0.528 1.642
Altitude Ovariole number 0.305 ± 0.291 -0.473 0.778 0.683 ± 0.163 0.371 1.008
Thorax Wing 0.698 ± 0.118 0.404 0.881 0.698 ± 0.118 0.404 0.881
Klepsatel et al., Supporting Information
Table S5. Comparison of path coefficients between sexes, based on bootstrap t-test. See text for
further details. t-statistic P-value Latitude Thorax 0.29 0.39 Latitude Wing 0.23 0.41 Altitude Thorax 0.87 0.19 Altitude Wing 0.59 0.28 Thorax Wing 0.25 0.40
Klepsatel et al., Supporting Information
Table S6. Factor loadings. See text for further details.
Factor 1 Factor 2 Factor 3
Altitude 0.75 -0.37 0.35
Latitude -0.83 -0.31 -0.40
Longitude 0.78 0.04 -0.16
Mean annual temperature 0.51 0.86 0.03
Mean seasonal temperature 0.07 0.96 -0.003
Temperature of the hottest month (MAX)
0.04 0.95 -0.26
Temperature of the coldest month (MIN)
0.68 0.68 0.22
Annual
MAX – MIN temperature
-0.83 -0.21 -0.45
Seasonal
MAX – MIN temperature
-0.16 0.36 -0.74
Mean monthly precipitation 0.15 0.07 0.96
Mean monthly precipitation (during season) 0.09 0.01 0.96
Klepsatel et al., Supporting Information
Table S7. Multiple regression analyses of the effects of the three factors with the largest eigenvalues (obtained from factor analysis) and sex on variation in morphological traits. e(number) = 10(number). See text for further details.
Sex Factor 1 Factor 2 Factor 3 Sex x Factor 1 Sex x Factor 2 Sex x Factor 3 F-ratio R2
Thorax length
Coefficient 0.07 ± 4.0 e-3 5.0 e-3 ± 4.3 e-3 -0.8 e-3 ± 4.3 e-3 -2.0 e-3 ± 4.3 e-3 1.9 e-3 ± 4.3 e-3 -3.0 e-3 ± 4.3 e-3 2.2 ± 4.3 e-3
F7, 30 = 41.89 0.91 F-ratio F1, 30 = 287.12 F1, 30 = 1.31 F1, 30 = 3.69 F1, 30 = 0.21 F1, 30 = 0.19 F1, 30 = 0.48 F1, 30 = 0.26 P-value < 0.0001 0.26 0.06 0.65 0.67 0.50 0.61 Wing area Coefficient 0.22 ± 0.02 0.051 ± 0.02 -0.08 ± 0.02 0.03 ± 0.02 6.4 e-3 ± 0.02 -0.02 ± 0.02 0.01 ± 0.02 F7, 30 = 17.06 0.80 F-ratio F1, 30 = 97.96 F1, 30 = 5.12 F1, 30 = 14.18 F1, 30 = 1.27 F1, 30 = 0.08 F1, 30 = 0.71 F1, 30 = 0.21 P-value < 0.0001 0.03 0.0007 0.27 0.78 0.41 0.65 Wing loading
Coefficient 0.05 ± 4.0 e-3 -9.1 e-3 ± 4.0 e-3 0.02 ± 4.0 e-3 -0.01 ± 4.0 e-3 1.8 e-3 ± 4.0 e-3 8.4 e-5 ± 4.0 e-3 1.1 e-3 ± 4.0 e-3
F7, 30 = 26.01 0.86 F-ratio F1, 30 = 149.55 F1, 30 = 5.34 F1, 30 = 16.21 F1, 30 = 10.7 F1, 30 = 0.21 F1, 30 = 0.0005 F1, 30 = 0.08 P-value < 0.0001 0.03 0.0004 0.003 0.65 0.98 0.79 Ovariole number Coefficient - -0.99 ± 0.48 -1.36 ± 0.47 -0.49 ± 0.47 - - - F3, 15 = 4.56 0.48 F-ratio - F1, 15 = 4.28 F1, 15 = 8.23 F1, 15 = 1.06 - - - P-value - 0.06 0.01 0.32 - - - Ovariole index Coefficient - -1.58 ± 0.42 0.01 ± 0.41 -0.71 ± 0.41 - - - F3, 15 = 5.84 0.54 F-ratio - F1, 15 = 14.47 F1, 15 = 0.0009 F1, 15 = 2.98 - - - P-value - 0.002 0.98 0.11 - - - Cell number Coefficient 483.3 ± 109.1 197.6 ± 113.0 -432.0 ± 112.3 19.0 ± 112.3 19.6 ± 113.0 -31.7 ± 112.3 -1.9 ± 112.3 F7, 30 = 5.36 0.56 F-ratio F1, 30 = 19.63 F1, 30 = 3.06 F1, 30 = 14.79 F1, 30 = 0.03 F1, 30 = 0.03 F1, 30 = 0.08 F1, 30 = 0.0003 P-value 0.0001 0.09 0.0006 0.87 0.86 0.78 0.99 Cell size Coefficient 13.8 ± 0.8 1.4 ± 0.8 -0.4 ± 0.8 1.9 ± 0.8 -0.5 ± 0.8 -0.4 ± 0.8 0.4 ± 0.8 F7, 30 = 43.91 0.91 F-ratio F1, 30 = 297.81 F1, 30 = 2.87 F1, 30 = 0.61 F1, 30 = 5.5 F1, 30 = 0.42 F1, 30 = 0.27 F1, 30 = 0.22 P-value < 0.0001 0.10 0.61 0.03 0.52 0.61 0.65
Klepsatel et al., Supporting Information
Table S8. Linear regressions between individual morphological traits.
Trait 1 Trait 2 Population Slope Intercept F-ratio R2 P-value
Thorax length Wing area Austria 2.09 0.25 -0.47 0.25 F1, 28 = 69.00 0.71 < 0.0001
Ethiopia 3.46 0.21 -1.52 0.21 F1, 18 = 265.44 0.94 < 0.0001
Thorax length Wing loading Austria 1.04 0.1 -0.42 0.1 F1, 28 = 113.45 0.80 < 0.0001
Ethiopia 0.62 0.06 -0.1 0.06 F1, 18 = 115.65 0.87 < 0.0001
Thorax length Ovariole number Austria 61.12 12.01 -21.11 12.09 F1, 28 = 25.92 0.48 < 0.0001
Ethiopia 57.92 17.67 -17.8 17.55 F1, 18 = 10.74 0.39 0.004
log(wing area) log(cell number) Austria 0.71 0.09 3.8 0.02 F1, 28 = 56.21 0.67 < 0.0001
Ethiopia 0.62 0.1 3.85 0.03 F1, 18 = 36.89 0.67 < 0.0001
log(wing area) log(cell size) Austria 0.3 0.09 2.2 0.02 F1, 28 = 9.87 0.26 0.004
Klepsatel et al., Supporting Information
Table S9. Spearman rank correlation coefficients () for pairwise correlations between
morphological traits and fecundity, measured in females from the outbred Austrian and Zambian populations. ***P < 0.0001; **P < 0.001; *P < 0.05; all P values after Bonferroni-Holm correction.
See text for further details.
Fecundity Fecundity per ovariole Thorax length Austria 25C 0.5*** 0.23 Austria 18C 0.34* -0.05 Zambia 25C 0.26 0.06 Zambia 18C 0.21 -0.04 Ovariole number Austria 25C 0.33 -0.4* Austria 18C 0.31 -0.46*** Zambia 25C 0.5*** -0.39* Zambia 18C 0.51*** -0.41* Ovariole index Austria 25C -0.17 -0.59*** Austria 18C 0.04 -0.42** Zambia 25C 0.27 -0.4* Zambia 18C 0.28 -0.42*
Klepsatel et al., Supporting Information
Table S10. Two-way analysis of variance (ANOVA) for ovariole index and egg production rate
per ovariole. df - degrees of freedom; SSQ - the sum of squares for each source of variation.
Trait Source of variation df SSQ F-ratio P-value
Ovariole index Population 1 665.24 35.28 < 0.0001 Temperature 1 2408.45 127.71 < 0.0001 Population Temperature 1 0.72 0.04 0.85 Error 277 5223.86 - - Egg production rate per ovariole
Population 1 15.8 2.29 0.13
Temperature 1 102.02 14.78 0.0002
Population Temperature 1 49.92 7.23 0.008