Reference Matching of Dissimilar Binary Odor Mixtures
Anne J. Kurtz&Harry T. Lawless&Terry E. AcreeReceived: 15 May 2009 / Accepted: 22 October 2009 / Published online: 20 November 2009
# 2009 Springer Science + Business Media, LLC
Abstract Hexanal (C6) and octanal (C8) exhibit two different odor qualities at all concentrations: C6 is perceived as green, while C8 is perceived as citrus. This paper examines the odor perception (quality+intensity) of C6–C8 binary mixtures by varying the concentration ratios within the mixtures and using an odor reference-matching task to estimate perceived intensity. Three perceptible concentrations of C6 and C8, low (L), medium (M), and high (H), were prepared. Subjects were trained to match the quality and intensity of blind samples of these standards with their appropriate reference. Mixtures were composed of a focal or“figure” odorant (indicated below in bold) of the same odor quality as the references and a second odorant defined as the “ground” odorant. In subsequent sessions, subjects were asked to evaluate their perception of the quality of the focal odorant in a C6–C8 mixture. Stimuli for C6 matching tasks, where C6 was both the reference and the figure, were: 6L-8M, 6M-8L, 6M-8M, 6M-8H, and 6H-8M. The C8 matching tasks were the same, except that the roles of C6 and C8 were reversed. When the figure odorant was stronger than or iso-intense to the ground odorant, mixtures were often matched to a less intense reference, indicating suppression (compensation) of the figure by the ground odorant.
Keywords Mixtures . Perception . Olfactory Receptor I-7 . Fragrance . Qualia
Introduction
Humans experience the odor perception (quality+intensity) of a mixture rapidly and clearly (Laing and Francis 1989), but the relationship between the composition and the perception of the mixture is not well understood. Odor quality, the element of an odor percept representing the nature of an olfactory experience rather than its intensity, is a brain state of the conscious mind and not a property of the stimulus odorant or ligand. It is defined as“the ways things seem to us” (Dennett 1988), e.g., what it is like to smell hexanal or octanal independent of their intensity. Odor quality is ineffable and intrinsic; therefore, it cannot be measured directly. However, it is immediately apprehensible in con-sciousness, and subjects can reproducibly recognize the same odor quality in a reference standard that they experience in a test material. Therefore, experimental protocols based on matching test materials to reference standards can be devised to provide insight into the perception of qualities when they are produced by components of mixtures.
The theory of elemental processing of odor mixtures asserts that components within a mixture are perceptible parts of the whole (Laing and Wilcox 1983; Laing and Francis1989), while the theory of configural or combina-torial odor processing asserts that components within a mixture create novel odors different from the components (Zou and Buck2006; Malnic et al.1999). Prior research has demonstrated that the greater the number of components in a mixture, the more difficult it is to recognize single components. In a typical experiment, trained subjects were able to successfully identify no more than three components within a complex mixture (Laing and Francis1989). In the minimal case of binary mixtures, Cain and Drexler (1974) confirmed that these mixtures followed the vector summa-tion model of Berglund et al. (1973), in which the perceived
A. J. Kurtz
:
T. E. Acree (*)Department of Food Science and Technology, Cornell University, Geneva, NY 14456, USA
e-mail: [email protected] H. T. Lawless
Department of Food Science, Cornell University, Ithaca, NY 14856, USA
intensity of a mixture of two odorants was the vector sum of the individual intensities with an angle,“α,” greater than zero between the component vectors—the angle that yields simple additivity. Berglund found that α is less than but near to 110° when the components had similar quality. She predicted that α would be greater than 110° when the components had different qualia, a prediction verified by Cain. Cain found α between 114° and 130° for all dissimilar odorant pairs tested, more or less independent of the nature of the odorants. However, when Cain asked subjects to score the intensity of one of the individual components within the mixture, the intensity of that component was suppressed by the presence of the other. This mixture suppression increased as the difference in concentration between the components increased, to the extent that one of the components was completely masked by the other, even though both were above their threshold when tested alone (Cain and Drexler1974).
Köster used a matching protocol in which the subjects expressed the total intensity of a mixture by comparing it to a standard not present in the mixture (Koster 1968,1969, 1971). This technique minimized adaptation, eliminated quantitative scaling, and simplified the task for the subjects. However, Köster asked the subjects to evaluate the total intensity, so we know nothing about the odor intensity of the components. The lack of simple additivity (α=0), however, indicated the presence of mixture suppression. Cain and Drexler (1974) required that the subjects evaluate both the total intensity and the intensity of each binary component in mixtures using a magnitude scaling protocol, and in every case, the perceived intensity of the components was less in the mixture than when smelled individually.
The experiments described in this paper used a reference-matching task that was similar to that used by Koster with two exceptions: (1) The subjects attended to component odors rather than the total intensity, and (2) they matched these component odors to standards of the same compound instead of a different reference. Here, subjects were asked to attend to a single component with a quality they easily recognized and to match their perception of its intensity to one of three concentrations of a pure standard of the compound being attended to. This reference-matching task eliminated scaling and required simple comparisons between samples and chemically definable references. Training, which involved matching single odor-ants with recognizable qualities to pure references, was completed before binary mixtures were tested.
Background
An odor percept has two features: a quality and an intensity formed in the conscious brain after odorants (ligands) bind
to olfactory receptors (ORs), transmembrane proteins located on the ciliary surface of olfactory neurons (ONs). Depolarization of the ONs initiates a pattern of brain activity that is translated into a quality and an associated intensity. One or more ligands can activate a single OR, although the activation seems to be strongest for a particular set of ligands (Zhao et al. 1998). Zhao et al. (1998) identified the first ligand–odorant pair in rats as octanal (C8)-OR-I7. OR-I7 elicited little to no response when exposed to hexanal (C6). Kittel et al. (2008) examined the qualia of a series of straight chain aldehydes ranging in length from six to 12 carbons using free choice profiling, illustrating C6 as “grassy-green” in character, while aldehydes C7–C12 were “citrus,” having distinctly different qualia from C6. Thus, C6 and C8 have dissimilar odor qualia as well as dissimilar OR binding properties, at least for the OR-I7 receptor. Although dissimilar odorants are more easily perceived in odor mixtures (Gottfried et al. 2006), frequent exposure (Dalton and Wysocki 1996) and similar concentration ratios (Berglund et al. 1973) can also enhance the ability to detect an odorant within a mixture.
In the study of vision, the ability to separate an object from its surrounding visual field is referred to as figure– ground segregation. The background or simply ground is everything else in the visual field, while the figure is an object superimposed on the ground (Kandel et al. 2000; Goldstein2002). The ground is understood to exist behind the figure even though there are no visual signals coming from there. Similar figure–ground perception of olfactory information has been proposed to explain both perceptual (Wilson and Stevenson2006) and neurological phenomena (Kadohisa and Wilson2006), but it is clear that, in the case of olfaction, there is the same stimulation from the ground whether the figure is there or not. Nevertheless, the brain produces figure-like perceptions in a winner-takes-all process that is strikingly similar to figure–ground segrega-tion in vision. Although processing visual images is different than the processing of odor images, distinguishing a component odor from the remaining mixture is not unlike figure–ground perception.
Finally, the adaptation process that takes place whenever odors are smelled must modulate mixture perception except at very low potencies where some enhancement or augmentation has been reported (Cain and Drexler 1971). In mixtures, adaptation would be expected to cause the odor quality to change during exposure producing successive experiences. Similarly, the ability to recognize a single component of an odor mixture depends on differences in quality of the components, and which quality a subject attends to can be manipulated by adaptation to the other components (Goyert et al. 2007; Kadohisa and Wilson 2006). It is important to control and account for adaptation in experiments that study mixture suppression.
This study examined the odor perception of two dissimilar odorants in mixtures, hexanal (C6) and octanal (C8), while varying the intensities of the components within the mixtures. Individuals were trained to identify three different concentrations of C6 and C8 as individual components and were then presented with these odorants in binary mixtures. It was expected that the subjects would experience increased difficulty in the ability to identify single odorants within the mixtures as the intensities of the two odorants became iso-intense due to mixture suppres-sion. However, when the odorants were of differing intensity, it was expected that individuals would be able to successfully separate the stronger odorant from the weaker odorant in the mixture. Therefore, in the experi-ments described here, subjects were trained to recognize C6 and C8 aldehydes at three different concentrations and to match standards of these compounds with their perception of the intensity of components of the same quality in mixtures of C6 and C8.
Materials and Methods
Subjects
Six subjects, five women and one man, non-smokers with normal olfactory function and mean age of 28.2 (SD, 3.2) years, volunteered to participate. Experimental protocol was reviewed and approved by the Institutional Review Board of Cornell University. All subjects were paid for their participation.
Materials
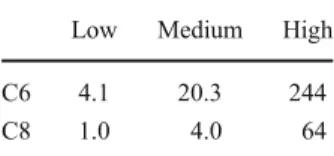
Straight chain aliphatic aldehydes hexanal 98% (C6) and octanal 99% (C8) were obtained from Sigma-Aldrich (St. Louis, MO, USA). All odorants were dissolved in poly (ethylene glycol) (PEG). Low (L), medium (M), and high (H) concentrations were made for both odorants. L, M, and H intensities were determined by dose–response curves collected in bench top study prior to experimentation. A three-alternative forced choice method, described in Cometto-Muniz et al. (2005), was used to determine the three odorant intensities used for both the C6 and C8 stimuli. Intensities for C6 and C8 odorants are listed in Table1.
Odorants were presented in 250 mL polyethylene squeeze bottles modified with 1.5-cm-diameter Teflon ball
fitted around the neck of the bottle for nasal comfort and labeled with random three-digit codes. Two odorants were present within each binary mixture C6 (6) and C8 (8) at one of the three levels (L, M, and H). For example, a mixture written as 6L-8M contained a low concentration of C6 and a medium concentration of C8. There were five binary mixture stimuli: 8M-6L, 8M-6M, 8M-6H (used for both C6 and C8 focus), 6M-8L, and 6M-8H. Stimuli were prepared by dipping perfumer’s blotters 1 cm in PEG solutions of the odorants, placing them in 250-mL polyethylene plastic squeeze bottles, and allowing them to equilibrate for at least 1 h prior to testing. All bottles contained two perfumer’s strips. For single odorants, one strip was dipped in the PEG-based odorant stimuli and the other in pure PEG. The rounded average concentration ratios of both odorants was approximately 1 (L) to 4 (M) to 16 (H).
Subject Training
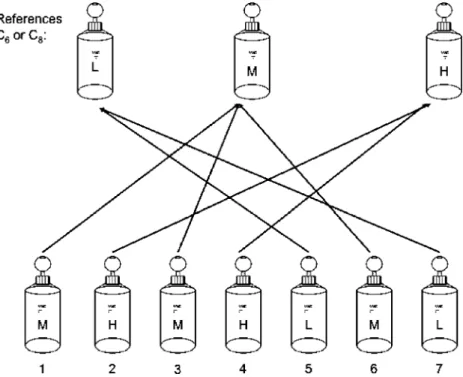
Six subjects were trained to distinguish L, M, and H concentrations of each odor using a reference-matching task (ABC-X) for both C6 and C8. The AB-X sensory task asks subjects to match stimulus X to either reference A or B (Lawless and Heymann1998). The references in the ABC-X task were PEG (A), medium concentration (B), and high concentration (C). Subjects were instructed to smell references A, B, and C and familiarize themselves with the three concentrations. Once familiar with the intensities of the three reference concentrations, subjects were asked to sort seven randomly placed test bottles into the appropriate group. There was a constant set of six bottles composed of two bottles of PEG, two bottles of medium concentration, and two bottles of high concentration. One extra bottle either of PEG, medium concentration, or high concentration was added to the six bottles for a total of seven bottles. The extra bottle was used to ensure that the subjects did not use a process-of-elimination to sort the bottles. An example of a C6 reference-matching task is outlined in Fig. 1. In this example, there are seven test bottles, where two bottles are marked PEG, three test bottles are marked M, and two test bottles are marked H. The subjects' task was to place each bottle of unmarked test bottles in front of the matching reference bottle. Once complete, the subjects alerted the researcher. The researcher checked the place-ment of the bottles and alerted the subjects of any errors. If there were errors, the subject was asked to re-evaluate the bottle. In order to receive a score of 100%, a subject was required to properly match all test bottles to the corresponding reference bottle on two consecutive ses-sions. Obtaining a score of 100% in training indicated a subjects' ability to detect the presence of the odor and properly identify its concentration. Failure to receive a score of 100% meant a subject was required to repeat the
Low Medium High C6 4.1 20.3 244 C8 1.0 4.0 64 Table 1 Low, medium, and
high concentrations of C6 and C8 in millimolar
process where a second failure to score 100% resulted in exclusion from the study. Subjects receiving 100% on a second try were tested again to ensure mastery of discrimination. All subjects were trained in separate sessions for odorants C6 and C8.
Procedure
Subjects were presented with the same concentration of reference A (low), B (medium), and C (high) as in the training session. However, the subjects evaluated nine bottles rather than seven bottles. Three of the bottles contained mixtures. A 30-s break took place between bottle evaluations. Two groups were presented per testing session, with a 5-min break between groups.
In separate sessions, subjects were instructed to evaluate bottles for the intensity of hexanal or the intensity of octanal. If the reference bottles contained hexanal, the subject was asked to identify the intensity of hexanal in the mixture (hexanal reference matching). If the reference bottles contained octanal, the subject was asked to identify the intensity of octanal within the test bottle (octanal reference matching).
Nine different test bottles were presented for evaluation during each of the reference matching sessions. Six of these bottles contained a single odorant: two bottles of low concentration, two bottles of medium concentration, and two bottles of high concentration. The single odorant was always the same as the odorant in the reference bottles. If the reference task was defined as a C6 matching task, all bottles containing single odorants would contain C6 (the
same as in the training). Additionally, three bottles containing binary mixtures were presented. Each mixture bottle contained two odorants: hexanal and octanal. One odor was defined as the figure (the odorant being evaluated), the other as the ground. The figure odor was always the same odor as the reference. Thus, if the reference was hexanal, the subject would be asked to identify the intensity of hexanal within the mixture and try to ignore the intensity of octanal. For example, in a C6 matching task, if a subject was presented with a mixture of 6L-8M (the figure is indicated in bold), the subject would identify the low concentration of C6 within this binary mixture and hopefully match this to the 6L reference.
Figure 2a and billustrates the odor reference-matching task used for testing component perception in a binary mixture. All reference bottles shown at the top of the figures contain the same odorant either C6 or C8 but at different concentrations: low (L), medium (M), high (H), and a blank PEG (not shown in the figure). The seven bottles at the bottom of Fig. 2a and b are test bottles containing L, M, or H concentrations of the same odorant as the reference plus three different binary mixtures. Two different experiments were conducted: Fig. 2a shows the assessment of the medium concentration of an odorant (figure) with three different concentrations of ground odor. If there were no effects from the ground, then all three binary mixtures should have been matched with the medium reference (see arrows in Fig. 2a). If there were sufficient suppression or counteraction, a binary mixture would, on occasion, be associated with a lower reference (see dotted line in Fig.3a). If there were enhancements or
Fig. 1 This figure shows the odor reference-matching task used for training. The three bottles at the top contain the same odorant either C6 or C8 but at different concentrations: low (L), medium (M), high (H), and a blank PEG (not shown in the figure). The panelist must place the test-odor bottle in front of the reference bottle with the most similar perceived intensity. The arrows indicate the place-ment of the test bottle next to the reference of the same con-centration. All the subjects had to match pure standards to the appropriate references before they could participate in a test
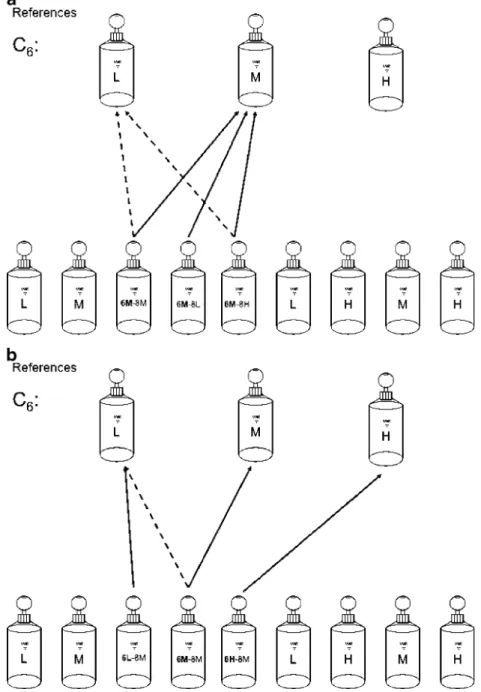
Fig. 2 a, b Odor reference-matching task used for testing component perception in a binary mixture. All reference bottles shown at the top of the figures contain the same odorant either C6 or C8 but at different concentrations: low (L), medium (M), high (H), and a blank PEG (not shown in the figure). The nine bottles at the bottom of Fig.2a and b
are test bottles containing L, M, or H concentrations of the same odorant as the reference including three different binary mixtures. Two different experiments were conducted. a Assessment of the medium concentration of an odorant (figure) with three different concentrations of ground odor. If there were no effects from the ground, then all three binary mixtures should have been matched with the medium reference (see arrows in the Fig. 2a). If there were sufficient suppression or counteraction, a binary mixture would on occasion be associated with a lower reference (see dotted line in Fig. 2a). If there were
enhancements or augmentation, then a binary mixture would be more frequently matched to a reference of higher concentration. If the reference bottles contained C6, the subjects were instructed to assess the intensity of C6 in the test bottles and match it to the intensity of a reference bottle. Choosing the blank PEG could produce a negative response and on occasion did. b Assessment of an odorant (figure) at three different concentrations in the presence of a medium ground. The same protocol was used as in Fig. 2a. If there were no effects from the ground, then all three binary mixtures should have been matched with the appropriate reference (see arrows in the figure). If there were suppression or counteraction of the figure by the ground, then a binary mixture would be more frequently matched to a lower reference level (see dotted line). Enhancement or augmentation would result in a higher choice
augmentation, then a binary mixture would be more frequently matched to a reference of higher concentration. If the reference bottles contained C6, the subjects were instructed to assess the intensity of C6 in the test bottles and match it to the intensity of a reference concentration. Choosing the blank PEG could produce a negative response and on occasion did. Figure2bshows the assessment of an odorant (figure) at three different concentrations in the presence of a medium ground. The same protocol was used
as in Fig.2a. If there were no effects from the ground, then all three binary mixtures should have been matched with the appropriate reference (see arrows in the figure). If there were suppression of the figure by the ground, then a binary mixture would be more frequently matched to a lower reference level (see dotted line).
Figures 2a and b titled “ground constant” and “figure constant” only illustrate the tasks performed when the reference is designated as C6. However, the inverse
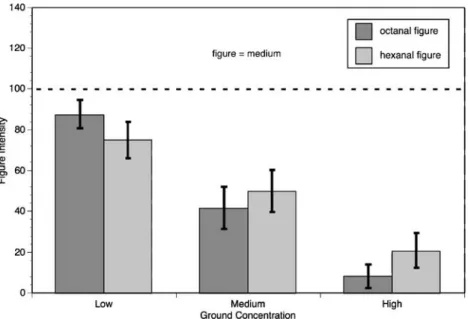
Fig. 4 This figure shows a plot, as in Fig.3, of the perceived figure intensity of a component of octanal–hexanal mixtures. Again two experiments are shown: one in which the octanal is the figure and the focus of the intensity measurement and the other in which hexanal is the figure and the focus of the measurement. In all sessions, unlike Fig.4, the ground is at the same concentra-tion (medium level). In one third of the sessions, the figure is at a low concentration; in one third, the figure is medium; and in one third, the figure is at its highest level
Fig. 3 This figure shows a plot of the perceived figure intensity of a component (figure) of octanal–hexanal mixtures. The ordinate plots figure intensity as a percent of expected placement. The abscissa shows the concentration of the component in the mixture that was varied. Here, the figure was constant, and the ground was varied. Dark gray indicates that octanal was the figure, and light gray hexanal was the figure. The error bars indicate standard error (n=24). Figure intensity was defined as the placement score for the matching task.
The error bars are standard errors. Two experiments are shown: one in which the octanal is the figure and the focus of the intensity measurement and the other in which hexanal is the figure and the focus of the measurement. In all sessions, the figure is at the same concentration (medium level). In one third of the sessions, the ground is at a low concentration; in one third, the ground is medium; and in one third, the ground is at its highest concentration
experiment, where C8 is the reference, was also performed. The figure labeled “ground constant” illustrates the case when the figure odorant (C6) increased from low to high, while the ground concentration, C8, is held constant at a medium concentration. In this task, bottles containing 6L-8M, 6M-6L-8M, and 6H-8M were presented along with figure references 6L, 6M, and 6H where the subjects identified the concentration of C6 in these bottles. The figure labeled “figure constant” illustrates the mixtures presented when the figure (C6) was held constant in a C6 matching task. In this condition, the concentration of octanal (ground) increases from low to high in the bottles, while hexanal (figure) is always medium. These mixtures were 6M-8L, 6M-8M, and 6M-8H.
Data Analysis
The subjects were asked to place the test bottle in front of the reference of the same intensity. The score was the rank of the concentrations in the test bottles chosen (low = 1, medium = 2, high = 3). Ranking was used so that results from octanal and hexanal could be compared on the same scale. After the subjects completed their test-bottle evalu-ation and placement, the researcher recorded the bottle placement. If a test bottle containing 6M were placed in front of the 6L reference, the figure score would be recorded as 1. In Figs. 3and 4, the intensity is the ranked score normalized to 100. The figure intensity plotted in Figs. 3 and 4 was averaged over six subjects and four replications (n=24).
Data were split into two separate groups. One group was defined as a figure constant–ground varied condition and the other group was defined as the figure varied–ground constant condition. Each group included data from both C6 and C8 matching tasks. Both the figure constant–ground varied condition and the figure varied–ground constant conditions were analyzed through one-way ANOVAs with least significant differences (LSDs). The data for both test conditions are presented in Tables2 and 3. These data are also represented in Figs.3 and4.
Results
Figure 3 shows a decrease in the perceived figure intensity when the figure is held constant (always medium concentration), and the ground concentration is varied. As the ground concentration increased from low to high, the intensity of the figure was increasingly suppressed until it was almost completely masked by the high concentration of the ground. Five percent LSD separations (Table 2) showed significant differences between the means of the different strengths, but no
difference between the behavior of C6 and C8 when they functioned as figures.
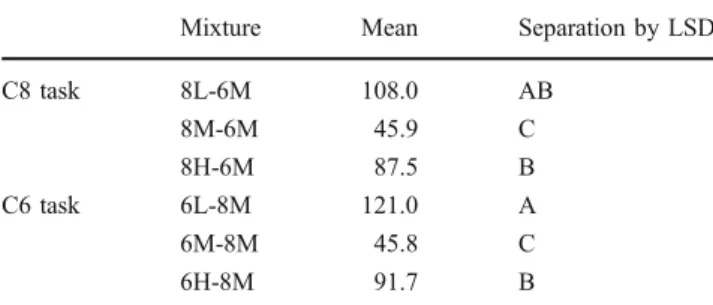
In Fig. 4, the ground is at the medium concentration in every test. The figure is lower than the ground (∼4-fold), iso-intense, or higher than the ground (∼14-fold). As illustrated in both Figs. 3 and 4, when the figure and ground are iso-intense, there is a high level of figure suppression or counteraction. The medium concentrations in Figs. 3 and 4 are replications of the same experimental conditions and yield similar results (∼55% reduction in perceived intensity). However, when the figure concentra-tion is greater than the ground concentraconcentra-tion (Fig. 4), the high concentration figure is seldom placed next to the lower concentration reference.
Furthermore, Tables 2 and 3 show a significant difference between the mixture treatments. All iso-intense mixtures were perceived equally, and C6 and C8 behaved exactly the same whether they were figure or ground. However, the perception of a low figure in the presence of a medium ground was confounded by the lack of a lower concentration to choose. None of the subjects reported any odors other than hexanal and octanal. Interspersed with the mixtures were single odorant at three levels L, M, and H. Subjects correctly matched these single odorants to the reference of equal concentration: L (92 out of 96 times), M (87 out of 96 times), and H (92 out of 96 times).
Table 2 Figure intensity means for figure constant, ground varied tasks Mixture Mean Separation by LSD C8 task 8M-6L 87.0 A 8M-6M 41.7 BC 8M-6H 8.3 D C6 task 6M-8L 75.0 A 6M-8M 50.0 B 6M-8H 20.8 CD
Samples with different letters are different at the 0.05 probability
Table 3 Figure intensity means for ground constant, figure varied tasks Mixture Mean Separation by LSD C8 task 8L-6M 108.0 AB 8M-6M 45.9 C 8H-6M 87.5 B C6 task 6L-8M 121.0 A 6M-8M 45.8 C 6H-8M 91.7 B
Discussion
The two most widely accepted views of odor mixture perception posit that either the perception of mixtures is an elemental process, where each component within the mixture is detectable, or odor detection is a configural process, where the component odorants combine to create a novel odor (Laing and Wilcox1983; Zhao et al.1998). For this study, subjects were asked to identify a single odor within the mixture, forcing the subject to analyze the mixture in an elemental fashion. However, if the odorants were only perceivable as novel within the mixture, subjects would have failed at the odor reference-matching task. Furthermore, when asked, subjects reported no new quality, supporting elemental processing in this case. Depending on the priming task, the subjects were capable of detecting either part of the odor image. In mixtures where the figure odorant was of greater concentration than the ground (8M-6L, 6M-8L), the figure odorant was identified accurately nearly every time, indicating only slight suppression of strong odors by weaker ones, while there was almost complete suppression of the weak odors by the stronger ones.
Some research has demonstrated that odor mixtures create a novel perception (but not necessarily a novel quality); component qualities within the mixture are still detectable to the individual (Laing and Francis 1989) but prior adaptation to different components change which components are detectable (Goyert et al. 2007). When a subject first sniffs an unfamiliar mixture of iso-intense odorants, the perception might be similar to that of seeing an ambiguous image like the Rubin image for the first time, where she may perceive a single image at first and only after repeated exposure or coaching is she able to see the alternate view. This study asked subjects to focus on a single odorant within a binary mixture, forcing the subjects to attend to a particular aspect of the mixture then repeating the experience focusing on a different component. The results for the medium concentrations in both Figs.3and4 show that, at approximately iso-intense medium levels, the subjects can learn to focus on either component of a binary mixture of odorants with different qualities but that their perception of intensity is reproducibly suppressed by ∼50%. In contrast, there was only a slight but significant suppression∼10% of the figure when the subjects focus on the strongest odorant in binary mixture. These data show no evidence of configural processing but significant suppres-sion at all concentration ratios except when the figure is at its lowest concentration. The high degree of accuracy with which the subjects matched single odorants to references during all mixture evaluations indicates that most of the suppression observed in the mixtures was not caused by adaptation.
Conclusions
Large intensity differences between dissimilar odorants in binary mixtures create a figure–ground distinction where the figure is recognizable and enhanced when weak but suppressed when strong. However, when the intensities are similar, distinctions blur, resulting in greater mixture suppression and ambiguous choices. This blurring can be compared to the ambiguous images in visual illusions where the figure and ground assignments are unclear. The fact that the same suppression of the figure was observed in a mixture when only the task was changed—that is, the definition of the figure and ground were switched but the mixture was unchanged—indicates an olfactory figure– ground illusion. Thus, the perceived intensity of individual odorants in binary mixtures of different qualities are likely suppressed or counteracted except when all the odorants are only slightly above their threshold where they are much less suppressed and, on occasion, enhanced or augmented as was predicted by Cain and Drexler in (1974).
Acknowledgements Edward Lavin is acknowledged for assisting with the screening of individuals prior to testing and John Barnard for offering his statistical analysis expertise.
References
Berglund B, Berglund TL, Stevensson LT (1973) A quantative principle of perceived intensity summation in odour mixtures. J Exp Psychol 100:29–38
Cain WS, Drexler M (1971) Scope and evaluation of odor counteraction. Ann N Y Acad Sci 237:427–439
Cain WS, Drexler M (1974) Odors: evaluation, utilization, and control. Ann N Y Acad Sci 237:427–439
Cometto-Muniz J-E, Cain W-S, Abraham M-H (2005) Odor detection of single chemicals and binary mixtures. Behav Brain Res 156:115–123
Dalton P, Wysocki CJ (1996) The nature and duration of adaptation following long-term odor exposure. Perception and Psychophy-sics 58:781–792
Dennett D (1988) Quining qualia. In: Marcel A, Bisiach E (eds) Consciousness in modern science. Oxford University Press, Oxford, pp 381–414
Goldstein EB (2002) Perceptual segration: how objects are separated. Sensation and perception. Wadsworth, Pacific Grove, pp 156–160 Gottfried J-A, Winston J-S, Dolan R-J (2006) Dissociable codes of odor quality and odorant structure in human piriform cortex. Neuron 49:467–479
Goyert H-F, Frank M-E, Gent J-F, Hettinger T-P (2007) Characteristic component odors emerge from mixtures after selective adapta-tion. Brain Res Bull 72:1–9
Kadohisa M, Wilson D-A (2006) Olfactory cortical adaptation facilitates detection of odors against background. J Neurophysiol (Bethesda) 95:1888–1896
Kandel ER, Schwartz JH, Jessell TM (2000) Constructing the visual image. Principles of neuroscience. McGraw-Hill, New York, pp 492–506
Kittel KM, Kurtz AJ, Barnard J, Acree TE (2008) Free-choice profiling of OR-I7 agonists and homologues using GCO. Chem Percept 1:235–241
Koster EP (1968) Relative intensity of odor mixtures at supra-threshold levels. Olfactologia 1:28–41
Koster EP (1969) Intensity in mixtures of odorous substances. In: Pfaffmann C (ed) Olfaction and taste III. The Rockefeller University Press, New York, pp 142–149
Koster EP (1971) Adaptation and cross-adaptation in olfaction: an experimental study with olfactory stimuli at low levels of intensity. University of Utrecht, Utrecht
Laing DG, Wilcox ME (1983) Perception of components in binary odor mixtures. Chem Senses 33:309–319
Laing DG, Francis GW (1989) The capacity of humans to identify odors in mixtures. Physiol Behav 46:809–814
Lawless HT, Heymann HH (1998) The ABX descrimination task. Sensory evaluation of food. Springer, New York, pp 127–129 Malnic B, Hirono J, Sato T, Buck L-B (1999) Combinatorial receptor
codes for odors. Cell 96:713–723
Wilson DA, Stevenson RJ (2006) Learning to smell. The John Hopkins University Press, Baltimore
Zhao H, Ivic L, Otaki J-M, Hashimoto M, Mikoshiba K, Firestein S (1998) Functional expression of a mammalian odorant receptor. Science 279:237–242
Zou Z, Buck L-B (2006) Combinatorial effects of odorant mixes in olfactory cortex. Science 311:1477–1481