No effect of sex on ethanol intake and preference after dopamine
transporter (DAT) knockdown in adult mice
Amine Bahi1&Jean-Luc Dreyer2
Abstract
Rationale Dopamine levels are controlled in part by transport across the cell membrane by the dopamine transporter (DAT), and recent evidence showed that a polymorphism in the gene encoding DAT is associated with alcoholism. However, research in animal models using DAT knockout mice has yielded conflicting results.
Objectives The present study was planned to evaluate the effects of DAT knockdown in the nucleus accumbens (Nacc) on voluntary ethanol consumption and preference in male and female C57BL/6J mice.
Methods For this purpose, animals were stereotaxically injected with DAT siRNA-expressing lentiviral vectors in the Nacc, and using a voluntary, continuous access two-bottle choice model of alcohol, we investigated the importance of accumbal DAT expression in voluntary alcohol intake and preference. We also investigated the effects of DAT knockdown on saccharin and quinine consumption and ethanol metabolism.
Results We show that females consumed more alcohol than males. Interestingly, DAT knockdown in the Nacc significantly decreased alcohol intake and preference in both groups, but no significant sex by group interaction was observed. Also, DAT knockdown did not alter total fluid consumption, saccharin or quinine consumption, or blood ethanol concentrations. Using Pearson correlation, results indicated a strong positive relationship between DAT mRNA expression and ethanol consumption and preference.
Conclusions Taken together, these data provide further evidence that DAT plays an important role in controlling ethanol intake and that accumbal DAT contributes in the modulation of the reinforcing effects of ethanol. Overall, the results suggest that DAT inhibitors may be valuable in the pharmacotherapy of alcoholism.
Keywords Alcoholism . DAT . Dopamine transporter . Ethanol . Lentivirus . shRNA . Two-bottle choice
Abbreviations
BEC Blood ethanol concentration DAT Dopamine transporter LV Lentiviral vectors Nacc Nucleus accumbens
shRNA Short hairpin RNA TBC Two-bottle choice
Introduction
Alcoholism is a common, heritable, chronic relapsing disor-der, with enormous societal impact. Thus, understanding the molecular mechanisms involved in the neuropathophysiology of alcoholism is critical to characterize individuals’ risk and to develop efficient prevention and treatment strategies. However, despite extensive efforts directed toward the devel-opment of medication to treat alcoholism and alcohol use disorders, no effective pharmacotherapy is presently in clini-cal use. Given the obvious importance of dopaminergic neu-rotransmission in alcoholism, the development of drugs that target the dopaminergic system in general, and the dopamine
Electronic supplementary material
* Amine Bahi
1 Department of Anatomy, United Arab Emirates University, Tawam
Medical Campus, Al Ain, United Arab Emirates
2
Division of Biochemistry, Department of Medicine, University of Fribourg, 1700 Fribourg, Switzerland
http://doc.rero.ch
Published in "Psychopharmacology 236(4): 1349–1365, 2019"
which should be cited to refer to this work.
transporter (DAT) in particular, may hold promise as a poten-tial pharmacotherapy for alcoholism.
Extracellular dopamine concentrations are the net result of release and clearance from the synaptic space. In the mamma-lian CNS, uptake through the plasma membrane DAT is the main mechanism for regulating extracellular dopamine levels (Benoit-Marand et al.2000). In fact, the main mechanism for clearing extracellular dopamine of the dorsal striatum and Nacc involves the neuronal DAT, rather than metabolism or diffusion (Cass et al.1993), with the Nacc being more sensi-tive to the effects of inhibitors of dopamine uptake than is the dorsal striatum (Cass et al.1993). By contrast, and because the norepinephrine transporter (NET) is present in much greater concentrations than DAT, in the prefrontal cortex (PFC), do-pamine uptake in the PFC depends primarily on NET (Moron et al.2002). DAT is a member of a larger family of sodium-and chloride-dependent transporters, which includes GABA, noradrenaline, serotonin, and glycine carriers [for review, see Gether et al.2006]. DAT is a membrane protein located on dopaminergic cells, and like other monoamine transporters, it has 12 transmembrane domains with intracellular N- and C-termini and belongs to the SLC6A family of Na+/Cl− -depen-dent symporters (Gainetdinov and Caron2003). DAT is not ubiquitously expressed but is restricted to dopaminergic neu-rons within well-known neurological pathways associated to dopamine neurotransmission. In fact, Richtand and colleagues used a highly sensitive and specific nuclease protection assay and showed that DAT mRNA was located solely in cell bodies of dopaminergic neurons, with the main expression seen in the substantia nigra/ventral tegmentum (SN/VTA), and lower but measurable expression within the hypothalamus (Richtand et al.1995), with a different set of findings revealing an age-d e p e n age-d e n t r e age-d u c t i o n i n t h e n u m b e r o f S N D AT-immunoreactive neurons (Ma et al.1999). Also, immunocy-tochemistry using highly specific monoclonal antibodies indi-cated that mesencephalic DAT immunoreactivity was en-hanced in the dendrites and cell bodies of neurons in the SN pars compacta and VTA, with a dense and heterogeneous staining in the striatum and nucleus accumbens (Ciliax et al. 1999). Positron emission tomography with [11C] altropane indicated that DAT is located also in the midbrain and prefron-tal cortex (Madras et al.2005).
At the functional level, pharmacological or genetic manip-ulation of DAT, using knockout (KO) mice, resulted in distur-bances of many behaviors. For example, DAT KO mice ex-hibit regular deficiency in prepulse inex-hibition (PPI) of the acoustic startle reflex, which is an operational task of sensori-motor gating (Ralph et al. 2001), that was associated with deficits of neuronal development in the prefrontal cortex (Kasahara et al.2011). Moreover, during dopamine neuron neurogenesis, maternal cocaine exposure has long-lasting ef-fects on dopaminergic neuronal functions lasting into early adulthood (Salvatore et al.2004). This effect was correlated,
at least in part, with stable DAT protein levels (Salvatore et al. 2004). As for cognition, nicotine treatment significantly im-proved KO mice impairment in cued spatial learning and memory tasks (Weiss et al.2007). Because dopamine medi-ates food rewarding value, methylphenidate (DAT inhibitor) decreased energy intake from fat and carbohydrates in obese adolescents (Danilovich et al.2014), suggesting that DAT is important for eating behavior. Also, since dopamine content in terminal areas was affected by seizure activity, the chemo-convulsant pentylenetetrazol reduced DAT mRNA expression in the substantia nigra pars compacta/ventral tegmentum area in the rat (Szot et al.1997). Again, as catecholamines are known to regulate thermogenesis and circadian rhythms, the Drosophila melanogaster DAT-defective mutant showed a short sleep phenotype (Kume et al. 2005; Tomita et al. 2015), that was associated with increased metabolic rate and a thermophobic phenotype—a preference for lower tempera-tures compared to wild-type flies (Ueno et al.2012). Likewise, a recent study reported that increased cortical dopamine/DAT, facilitated the clinical efficiency of the norepinephrine reup-take inhibitor, tapentadol, in neuropathic pain (Benade et al.
2017).
In addition, many studies have shown that DAT is impli-cated in the neuropathophysiology of affective disorders such as addiction to psychostimulants, like amphetamine and co-caine, that disturbs transporter trafficking, which in turn trig-gers a rapid insertion or removal of membranous DAT (Schmitt and Reith2010). Furthermore, local infusions of nonviral small interfering RNAs into the ventral tegmental area/substantia nigra increased stress-induced immobility in the tail-suspension test indicating a prodepressant-like pheno-type in mice (Chen and Lai2010). However, Perona and co-workers showed that, compared to WT controls, DAT KO mice displayed significantly higher consumption of sucrose solution suggesting decreased anhedonia, decreased immobil-ity, and increased swimming in the forced-swim test indicating an antidepressant-like phenotype (Perona et al. 2008). This outcome is paralleled by a significantly reduced anxiety-like behavior using the open field test (Pogorelov et al.2005). But findings from positron emission tomography (PET) or single photon emission computed tomography (SPECT) studies, in-vestigating DAT function in the striatum of patients with schizophrenia, yielded several conflicting results [for review, see Brunelin et al.2013]. Because DAT maintains dopaminer-gic homeostasis, several reports showed that DAT KO mice exhibit increased hyperactivity and stereotypic behaviors (Giros et al.1996), altered sensorimotor gating (Ralph et al. 2001), and impaired learning and working memory (Li et al. 2010), all of which reflect certain symptoms of schizophrenia (Gainetdinov et al. 2001) and attention-deficit hyperactivity disorder (ADHD) (Madras et al.2005). Again, since central dopaminergic neurotransmission is significantly involved in the pathogenesis of autism spectrum disorder (ASD), Cartier
and colleagues identified rare, inherited, functional missense variant in DAT gene (resulting in an Arg to Trp substitution at site 51) in separate individuals with ASD (Cartier et al.2015), suggesting a major contribution of DAT in ASD. On the other hand, numerous lines of evidence support aBdopaminergic hypothesis^ in the pathophysiology of Gilles de la Tourette syndrome (TS). In fact, and compared to healthy controls, patients severely affected with TS showed significantly lower methylation levels of DAT gene (Muller-Vahl et al. 2017), suggesting high DAT expression levels. These observations are in line with the results from another study in which a high level of DAT in bilateral striatum was found in drug-naive TS patients compared with that in normal controls (Liu et al. 2010), indicating that hyperfunctional DAT might be involved in the pathophysiology of TS. By contrast, drug-naive patients with obsessive–compulsive disorder (OCD) have a signifi-cantly reduced availability of striatal DAT (Hesse et al. 2005), and treatment with the selective serotonin reuptake inhibitor citalopram increased DAT availability by about 40% (Pogarell et al.2005), indicating an imbalanced mono-aminergic neurotransmitter modulation in OCD.
For alcohol use disorders, a link between a variable number tandem repeat (VNTR) polymorphism in the 3′ untranslated region of DAT and several alcohol withdrawal symptoms has been reported (Sander et al.1997). Interestingly, post mortem brain samples from human alcoholics exhibited a significant downregulation of DAT binding sites in striatal tissue (Hirth et al.2016), which was in line with earlier observations using post mortem tissue samples (Bergstrom et al.2001). Further, using the immediate dopamine precursor [18F]DOP, human in vivo studies revealed that dopamine synthesis was in-creased but DAT availability was reduced in alcoholics (Tiihonen et al.1998). Also, SPECT imaging indicated signif-icantly lower DAT binding in alcoholics on admission for detoxification than in the nonalcoholics (Laine et al.1999). Furthermore, after abstinence (4 weeks), DAT binding levels increased in the alcoholics to reach the levels of the healthy controls (Laine et al.1999). However, Volkow and colleagues reported that alcoholics showed DAT binding levels similar to those in nonalcoholics (Volkow et al.1996). The discrepan-cies between the above-mentioned studies could be, at least in part, explained by some of their limitations, such as the small size of the study samples, and the heterogeneity of the pa-tients, although findings may not generalize to other ethnic backgrounds. Also, these studies did not inspect other aspects of the patients’ genetic environment or their interactions with their environment. The critical importance of DAT implication in the neuropathophysiology of alcoholism was also demon-strated through studies using DAT KO mice that have pro-duced divergent findings. In fact, a study by Savelieva and colleagues found that the partial deletion of DAT, in heterozy-gotes, resulted in increased fluid consumption in female mice but does not change ethanol preference in either sex, whereas
complete deletion of DAT, in KO mice, reduces ethanol pref-erence in females (Savelieva et al.2002). On the contrary, a totally independent study, using different transgenic animals, reported that deletion of DAT gene increased ethanol con-sumption in male KO mice, while female KO mice had higher ethanol preference (Hall et al.2003). These contradictory ob-servations and opposing phenotypic changes are possibly due to mechanisms of functional compensation commonly ob-served in KO mice. Therefore, to circumvent these discrepan-cies, using a different approach we tested the novel hypothesis that DAT in the Nacc contributes to the reinforcing properties of ethanol.
In this study, we used a standard two-bottle choice BTBC^ drinking procedure to model ethanol consumption and preference in mice. Most of the studies used TBC procedures, which involve offering the possibility to drink either a diluted ethanol-containing solution (concentrations range from 3 to 30%) or water, for a fixed amount of time (typically in continuous 24-h periods). The ratio of ethanol intake relative to the total fluid intake is considered a mea-sure of preference. In some cases, the TBC access to eth-anol could be intermittent (Rosenwasser et al.2013), but not always (Crabbe et al. 2012), which results in higher ethanol intake compared to continuous access. The strength of the behavioral procedures was highlighted by work showing that genetically identical mice tested in dif-fering housing and experimental conditions influenced the outcomes from several different laboratories. Although the different research groups took drastic measures to preserve matching experimental conditions, the researchers could not justify 52% of the discrepancy in ethanol intake. Regardless, one of the most reliable behaviors across lab-oratories was ethanol intake in a 6-day TBC procedure (Crabbe et al. 1999). Even though, like any model, the TBC procedure does not reproduce the full spectrum of mechanisms involved in human alcohol consumption, it is considered relevant to human alcohol drinking (Dole 1986; Li et al.1979) and is extensively used in experimen-tal studies of alcohol drinking.
In the current series of experiments, we were specifically interested in determining if reduced ethanol consumption and preference could be achieved when lentiviral-mediated deliv-ery of shRNA was used to target the accumbal DAT mRNAs in adult male and female C57BL/6 mice. In support of our hypothesis and as stated above, DAT mRNA is highly enriched in the Nacc (Ciliax et al.1999), and there is strong evidence that accumbal DAT contributes critically to ethanol-related behaviors (Hall et al. 2003; Morice et al. 2010; Savelieva et al.2002). Therefore, we designed lentiviral vec-tors that expressed shRNA designed to target DAT mRNAs. These vectors, successfully used in our previous studies (Adriani et al.2009; Adriani et al.2010; Boyer and Dreyer 2008), were bilaterally infused into the Nacc of male and
female C57BL/6 mice and subsequently these animals were assessed for voluntary ethanol intake and preference using a standard TBC drinking procedure.
Materials and methods
Animals
Adult (10–12 weeks) male (n = 20) and female (n = 21) C57BL/6J mice were obtained from the local breeding facility of the College of Medicine & Health Sciences and maintained in a temperature-controlled (~ 22 °C) colony room with a 12-h light–dark cycle (06:00 to 18:00 lights on). The mice were housed in groups until they underwent stereotaxic surgery, after which they were singly housed throughout all subsequent testing. Bedding was produced locally and autoclaved before use. Water and food were available ad libitum throughout the experiment. Standard rodents’ chow diet was obtained from the National Feed and Flour Production and Marketing Company LLC (Abu Dhabi, UAE). The local Animal Research Ethics Committee approved the procedures (Application Reference No. A27-12).
Drugs
For the TBC drinking procedure, the ethanol solution (10%, v/v) was prepared from Ethanol absolute BioChemica (Panreac Quimica SAU, Barcelona, Spain) and diluted using tap water. For taste sensitivity, saccharin sodium salt dihydrate (0.04 and 0.08%; w/v) and quinine hemisulfate (35 and 70μM; w/v) were dissolved in tap water. For the blood ethanol concentration (BEC) experiments, ethanol was dissolved in physiological saline 0.9% sodium chloride and sterile water and has been used for intraperitoneal (i.p.) injections at a dose of 1.2 g/kg.
Cloning of DAT shRNAs and lentivirus production
Plasmid construction was described in previously published work from our laboratory (Adriani et al.2009,2010; Boyer and Dreyer2008). In brief, small interfering RNA (siRNA) were designed against rat DAT mRNA, and sequences were confirmed against available data to ensure DAT specificity. The pairwise sequence similarity search using BLAST algo-rithm indicated a 96% homology between rat and mouse quences. The following target within DAT sequence was se-lected, based on Hannon’s design criterion (http://katahdin.
cshl.org: 9331/RNAi/html/rnai.html): AGC CAT GGA TGG
CAT CAG AGC ATA CCT. An XhoI restriction site was added at 3′ and a U6-3′-specific 10mer at 5′, using the pSilencer 1.0-U6 (Ambion, UK) as a template and a U6 promoter-specific forward primer containing BamHI
restriction site (5′-GCG GAT CCC GCT CTA GAA CTA GTG C-3′). The siRNA target was added to the mouse U6 promoter by PCR, using the following PCR program: 120 s at 94 °C (initial denaturation) followed by 35 cycles (45 s at 94 °C, 45 s at 64 °C, and 45 s at 72 °C) in 4% dimethyl sulfoxide (DMSO). The PCR product was digested with BamHI and XhoI, cloned into similar sites into pTK431 (gra-ciously provided by Dr. Tal Kafri, UNC Gene Therapy Center), and predigested with the same restriction enzymes. The ligation product was amplified using DH5α-competent bacteria and DNA minipreps were sequenced to verify the integrity of the construct. The control vector (Mock) consisted of an empty pTK31.
Mock and DAT siRNA-expressing lentiviral vectors (siDAT) were packaged through the co-transfection of human embryonic kidney 293T (HEK293T) cells, using calcium phosphate, with a LV packaging vector (pΔNRF) and a ve-sicular stomatitis virus glycoprotein pseudotyping plasmid (pMDG-VSV-G). Medium was collected at 24 and 48 h post transfection and virus concentrated by centrifugation. The su-pernatant was removed, and the virus was suspended in sterile cold phosphate-buffered saline (PBS) supplemented with 1% bovine serum albumin (BSA). Viral titers (approximately 108–109units/mL) were determined using a p24 antigen ELISA kit (Bahi et al.2004,2005a,b).
Stereotaxic injection of lentiviral vectors into the Nacc
For viral injection, the mice were first anesthetized with a cocktail of ketamine (100 mg/kg, i.p.) and xylazine (10 mg/kg, i.p.) and placed in a stereotaxic frame. A craniotomy was drilled and a 5-μL Hamilton microsyringe filled with a viral solution was lowered into the Nacc using the following coor-dinates: + 1.7 mm AP, ± 0.75 mm ML, and 4.5 mm ventral from the dural surface (Bahi2016; Bahi et al.2016; Bahi and Dreyer2012,2014; Franklin and Paxinos 1997). For each injection, 0.5μL of viral particles were infused at a rate of 0.1 μL/min. Following vector administration, the Hamilton microsyringe was left in situ for an additional 10 min to pre-vent backflow. After recovery, the mice were singly housed with access to two bottles and left to recover 10 days before behavioral experiments started. After recovery, the sex and virus combination yielded four experimental groups: male-mock n = 9, male-siDAT n = 11, female-male-mock n = 10, and female-siDAT n = 11. The experimental timeline is depicted in Fig.1a.
Continuous voluntary access to alcohol
in a two-bottle choice drinking paradigm
Voluntary ethanol consumption and preference were mea-sured using a standard TBC paradigm as previously described (Bahi2016; Bahi et al.2016; Bahi and Dreyer2012,2014). In
brief, 10 days post surgery/viral injection, mice were exposed to a 6-day continued access (24 h/day) TBC, using 10 mL pipettes fitted with stainless drinking spouts (one containing water and the other one containing 10% ethanol). The position of the pipettes (left or right) was changed every other day to avoid side bias. Throughout the experiment, evaporation/ spillage estimates were calculated daily from two pipettes placed in an empty cage. Every day, water and ethanol intakes were measured, and ethanol consumed (g/kg body weight/ 24 h) was calculated for each mouse after the volumes were corrected for any spillage. Fluid intakes in grams were con-verted to milliliters with the assumption that for water 1 mL = 1 g, and for 10% ethanol 1 mL = 0.0789 g. The ethanol pref-erence was calculated as volume of ethanol consumed per total volume of water plus ethanol consumed. Total fluid in-take was calculated and expressed as volume of water plus ethanol consumed per kilogram of body weight per day (ml/ kg/day). The values for ethanol consumption, preference, and the total fluid intake were averaged across the 6-day period.
As displayed in the experimental timeline (Fig.1a), 1 week after the ethanol self-administration procedure, the same mice were tested for saccharin (0.04 and 0.08%) and quinine (35 and 70μM) intake and preference using the same TBC pro-tocol. The aim is to assess whether the decreased ethanol
consumption and preference observed in siDAT-injected mice may be due to the pharmacological effects of ethanol because differential taste reactivity may affect ethanol consumption and preference. For both tastants, each concentration was of-fered for 5 days with the low concentration being presented first, followed by the higher concentration and with bottle position changed daily to control for side preference. Fluid intake (water, saccharin, or quinine) was measured every 24 h, and body weights were recorded every 5 days through-out the whole study. As for ethanol, tastant intakes and total fluid intakes were corrected for body weight of the subject.
Blood ethanol concentrations and alcohol elimination
rate
Ethanol elimination rate was determined to estimate whether DAT knockdown in the Nacc altered ethanol pharmacokinet-ics. An ethanol dose of 1.2 g/kg was intraperitoneally injected. Approximately 50μL of tail blood samples were collected at 1, 2, and 3 h after injection, and plasma samples were spun down and stored at− 20 °C until further analysis. Plasma alcohol concentrations in milligrams per deciliter were mea-sured using an Ethanol Colorimetric Assay Kit (BioVision Research Products, CA, USA) according to the instructions of the manufacturer and as we described previously (Al Ameri et al.2014; Bahi et al.2013,2014). The area under the blood ethanol concentration–time curve (AUC) between 1 and 3 h was determined for each group.
Total RNA isolation and quantitative RT-PCR analysis
The entire accumbal tissue from mice injected with virus was freshly dissected and immediately processed individually for total RNA extraction using TRIzol according to the manufac-turer’s protocol. To verify DAT mRNA knockdown, single-stranded cDNA was synthesized from total RNA using the SuperScript III reverse transcriptase procedure. Following re-verse transcription, quantitative RT-PCR was performed in triplicate using SyberGreen. The temperature cycling param-eters consisted of initial denaturation at 95 °C for 4 min followed by 40 cycles of denaturation at 94 °C for 30 s and annealing and extension at 60 °C for 45 s. PCR for the control gene, cyclophilin, was run with the same cycling parameters. Normalization and relative expression analysis of DAT mRNA expression were done using the 2–△△Ctmethod with cyclophilin as the control because of its low variability be-tween samples.
Statistical analyses
For statistical comparisons, the software package IBM SPSS Statistics 16.0 was used. Data were expressed as means ± SEM. The data representing the effects of DAT knockdown
Fig. 1 Effect of DAT knockdown in males and females on ethanol consumption, preference, and total fluid intake after during a 24-h TBC test. a Summary of the experimental procedure. The data are expressed as mean ± SEM for b ethanol consumption, c ethanol preference, d total fluid intake in males, e ethanol consumption, f ethanol preference, and g total fluid intake in females. *p < 0.01 and **p < 0.001 indicate
signifi-cant differences between mock and siDAT. n = 9–11
on ethanol intake and preference were analyzed using a 2 × 2 × 6 three-way analysis of variance (ANOVA) repeated-measure with virus (mock vs. siDAT) and sex (males vs. fe-males) as the between-subject variable and day as the within-subject variable. The data representing the effects of DAT knockdown on tastants’ intake and preference were analyzed using a 2 × 2 × 2 × 5 four-way ANOVA repeated measures with virus, sex, and concentration as the between-subject var-iables and day as the within-subject variable. The data representing the effects of DAT knockdown on mRNA ex-pression and the AUC for BECs were analyzed using a 2 × 2 two-way ANOVA with virus and sex as the between-subject variables. The data representing the effects of DAT knock-down on BECs were analyzed using a 2 × 2 × 3 three-way ANOVA repeated measures with virus and sex as the between-subject variables and time as the within-subject var-iable. A series of post hoc correlations between levels of DAT mRNA and expression of ethanol-related behaviors were per-formed, using separate linear regressions (Pearson test), in order to provide further insight how changes in DAT mRNA expression may contribute to alterations in ethanol-related be-haviors. The relationship is expressed as the correlation coef-ficient (r). Bonferroni post hoc test was used when comparing among means, and all p values less than 0.05 were considered statistically significant.
Results
DAT knockdown decreased voluntary ethanol
consumption and preference
To determine whether reduced DAT expression would affect ethanol intake and preference, mice were injected bilaterally with siDAT or mock into the Nacc and then tested using the TBC procedure.
Ethanol consumption During the 6-day period, alcohol in-take was stable in both males (F(5, 90)= 0.562, p = 0.729;
Fig.1b) and females (F(5, 95)= 0.196, p = 0.963; Fig.1e).
However, DAT knockdown decreased ethanol consumption in both sex groups (F(1, 18)= 26.884, p < 0.0001; Fig. 1b)
(F(1, 19)= 59.407, p < 0.0001; Fig.1e), respectively. When
the data from both males and females were pooled and an-alyzed, the 2 × 2 × 6 three-way ANOVA test indicated that, indeed, there was no significant effect of time (main effect of day: F(5, 195)= 0.175, p = 0.972). Yet, females consumed
more ethanol than males (main effect of sex: F(1, 37)=
28.661, p < 0.0001). Interestingly, mice infected with siDAT exhibited significantly decreased ethanol consump-tion compared with control mice (main effect of virus: F(1, 37)= 79.947, p < 0.0001). However, the sex × virus (F(1, 37)= 0.802, p = 0.367) and the sex × virus × day (F(5,
185)= 0.036, p = 0.999) interactions were not found to be
significant. The results of the homogeneity by Levene test showed a homogeneous data (F(3, 37)= 2.306, p = 0.093).
Ethanol preference Similarly, when data were expressed as a preference measure (volume of ethanol/total volume con-sumed), the results showed a stable ethanol preference for both males (F(5, 90)= 0.437, p = 0.822; Fig.1c) and females
(F(5, 95)= 0.274, p = 0.926; Fig.1f). However, ethanol
prefer-ence was significantly decreased following DAT knockdown in both sex groups (F(1, 18)= 31.409, p < 0.0001; Fig.1c) (F(1, 19)= 47.561, p < 0.0001; Fig.1f), respectively. The 2 × 2 × 6
three-way ANOVA test between groups showed that ethanol preference was stable across the 6-day period test (main effect of day: F(5, 185)= 0.195, p = 0.964). However, females had
more preference than males (main effect of sex: F(1, 37)=
29.432, p < 0.0001), and that, compared to mock, siDAT in-jection decreased ethanol preference (main effect of virus: F(1, 37)= 76.711, p < 0.0001). The sex × virus (F(1, 37)= 0.014, p =
0.906) and the sex × virus × day (F(5, 185)= 0.051, p = 0.998)
interactions were not found to be significant. The Levene test applied to assess the equality of variances was not found to be significant (F(3, 37)= 0.211, p = 0.888).
Total fluid intake Finally, the total volume of fluid consumed was not affected by time neither in males (F(5, 90)= 0.321, p =
0.899; Fig.1d) nor in females (F(5, 95)= 0.394, p = 0.852; Fig. 1g). Also, viral injection had no effect on the amount of fluid consumed in both sex groups (F(1, 18)= 0.030, p = 0.864; Fig. 1d) (F(1, 19)= 0.722, p = 0.406; Fig.1g), respectively. The
three-way ANOVA, on pooled data from both males and fe-males, revealed that neither sex (F(1, 37)= 0.031, p = 0.862)
nor virus (F(1, 37)= 0.439, p = 0.511) affected the total fluid
intake. Consequently, the sex × virus (F(1, 37)= 0.151, p =
0.700) and the sex × virus × day (F(5, 185)= 0.370, p =
0.868) interactions were not found to be significant (Levene test: F(3, 37)= 2.071, p = 0.121). The Levene test showed
equality of variances (F(3, 37)= 2.071, p = 0.121).
Taken together, these findings suggest that decreased etha-nol consumption following DAT knockdown in the Nacc was not caused by an overall decrease in the total amount of fluid consumed.
DAT knockdown in the Nacc did not affect saccharin
’s
consumption and preference
Because ethanol might affect taste responses, it is critical to examine the sensitivity of both experimental groups to sweet (saccharin) and bitter (quinine) solutions’ tastes to determine whether differences in alcohol consumption are secondary to changes in taste. Therefore, 1 week after completion of the ethanol intake test, the same mice were examined for taste preference using a TBC paradigm. For this purpose, mice
could drink either water or an ascending series of saccharin (0.04 and 0.08%) or quinine (35 or 70μM) concentrations. Saccharin consumption The ANOVA analysis revealed that neither in males (F(4, 144)= 1.432, p = 0.226; Fig. 2a) nor in
females (F(4, 152)= 0.787, p = 0.535; Fig.2c) time affected
saccharin intake. The secondary analysis of pooled data using a 2 × 2 × 2 × 5 four-way ANOVA test indicated that there was no significant effect of time in all outcome measures (main effect of day: F(4, 296)= 1.037, p = 0.389). Also, both
mock-and siDAT-injected mice escalated their saccharin intake when presented tastant in an unrestricted fashion as a choice against water in the TBC test (main effect of concentration: F(1, 74)=
687.357, p < 0.0001) with large increases in saccharin con-sumption being observed when the higher concentration of saccharin (0.08%) was presented. However, neither sex (F(1, 74)= 0.028, p = 0.868) nor virus (F(1, 74)= 0.077, p = 0.783)
affected saccharin intake. Thus, the sex × virus × concentra-tion (F(1, 74)= 0.439, p = 0.510) and the sex × virus ×
concen-tration × day (F(4, 296)= 0.177, p = 0.950) interactions were
not found to be significant. The Levene test used to assess equality of the residual variances across both groups was not found to be significant (F(7, 74)= 0.477, p = 0.848).
Saccharin preference As stated above, we pooled both sex groups’ data, and the analysis using a 2 × 2 × 2 × 5 four-way ANOVA test indicated that time did not affect saccharin pref-erence (main effect of day: F(4, 296)= 0.294, p = 0.882).
Although there was an increased preference for the highly
concentrated saccharin (main effect of concentration: F(1, 74)= 18.648, p < 0.001), no differences in the sweetener
pref-erence were found between mock- and siDAT-injected mice (F(1, 74)= 0.011, p = 0.915) or between males and females (F(1, 74)= 0.001, p = 0.982). Also, neither the sex × virus ×
concen-tration (F(1, 74)= 0.117, p = 0.734) nor the sex × virus ×
con-centration × day (F(4, 296)= 0.522, p = 0.720) interaction was
found to be significant (data not shown). The Levene homo-geneity of variances test was not significant (F(7, 74)= 1.217,
p = 0.304).
Total fluid intake Finally, time did not affect the amount of fluid consumed by males (F(4, 144)= 1.173, p = 0.325; Fig.2b)
or females (F(4, 152)= 0.404, p = 0.806; Fig.2d). When we
pooled the data from both sexes, the four-way ANOVA with repeated measures indicated that none of the factors affected the total amount of fluid intake: (main effect of day: F(4, 296)=
0.462, p = 0.764); (main effect of concentration: F(1, 74)=
0.001, p = 0.983); (main effect of sex: F(1, 74)= 0.002, p =
0.963); (main effect of virus: F(1, 74)= 0.116, p = 0.734).
Therefore, the interaction between the four factors was not significant (F(4, 296)= 0.001, p = 0.977). The change in
vari-ance assessed using Levene homogeneity of varivari-ance test was not significant (F(7, 74)= 1.214, p = 0.306).
DAT knockdown in the Nacc did not affect quinine
consumption and preference
One week after completion of the saccharin intake experi-ment, the same mice had access to either tap water or an ascending series of quinine concentrations (35 and 70μM). Quinine consumption During the 5-day period, quinine intake was stable in both males (F(4, 144)= 0.247, p = 0.911; Fig.3a)
and females (F(4, 152)= 0.443, p = 0.778; Fig.3c). The 2 × 2 ×
2 × 5 four-way ANOVA test, using pooled results from males and females, demonstrated that time had no effect on quinine intake (main effect of day: F(4, 296)= 0.473, p = 0.756).
Although the four experimental groups consumed more qui-nine from the 70-μM solution (main effect of concentration: F(1, 74)= 194.919, p < 0.0001), neither sex (F(1, 74)= 0.148,
p = 0.702) nor virus (F(1, 74)= 0.001, p = 0.984) affected
qui-nine intake. Thus, the sex × virus × concentration (F(1, 74)=
0.053, p = 0.819) and the sex × virus × concentration × day (F(4, 296)= 0.506, p = 0.732) interactions were not found to be
significant. Equality or homogeneity of variances of the groups compared, done by Levene test, was not significant (F(7, 74)= 0.275, p = 0.916).
Quinine preference The 2 × 2 × 2 × 5 four-way ANOVA test, using the pooled data from both sexes, indicated that time did not affect quinine preference (main effect of day: F(4, 296)=
0.078, p = 0.989). In addition, none of the other factors
Fig. 2 Effect of DAT knockdown in males and females on saccharin consumption and total fluid intake after during a 24-h TBC test. The data are expressed as mean ± SEM for a saccharin consumption, b total fluid intake in males, c saccharin consumption, and d total fluid intake in females. *p < 0.0001 indicates significant differences between 0.04 and
0.08%. n = 9–11
affected quinine preference: (main effect of concentration: F(1, 74)= 0.625, p = 0.432); (main effect of sex: F(1, 74)= 0.151,
p = 0.699); (main effect of virus: F(1, 74)= 0.001, p = 0.993).
Therefore, the interaction between the four factors was not significant (F(4, 296)= 0.001, p = 0.977). Therefore, the sex ×
virus × concentration (F(1, 74)= 0.008, p = 0.929) and the sex
× virus × concentration × day (F(4, 296)= 0.077, p = 0.989)
interactions were not found to be significant (data not shown). Evaluation of results from the Levene test of equality of var-iances showed no significant difference (F(7, 74)= 1.814, p =
0.097).
Total fluid intake Finally, when analyzed separately, time did not affect the amount of fluid consumed by males (F(4, 144)=
0.449, p = 0.773; Fig.3b) or females (F(4, 152)= 0.356, p =
0.740; Fig.3d). Also, the 2 × 2 × 2 × 5 four-way ANOVA test, conducted on the pooled data, showed that none of the factors affected the total amount of fluid intake: (main effect of day: F(4, 296)= 0.610, p = 0.655); (main effect of concentration: F(1, 74)= 1.016, p = 0.317); (main effect of sex: F(1, 74)= 0.652,
p = 0.422); (main effect of virus: F(1, 74)= 0.021, p = 0.885).
Also, the interaction between the four factors was not found to be significant (F(4, 296)= 0.203, p = 0.937). In estimating the
homogeneity of the average values, the Levene test was not significant (F(7, 74)= 0.663, p = 0.702).
Taken together, these results suggest that it is, therefore, unlikely that the effects of siDAT injection into the Nacc on voluntary ethanol consumption and preference result from general alterations in sensory abilities or palatability.
siDAT reduced DAT mRNA levels in the Nacc
To determine the persistence of infection in the Nacc, mice were injected bilaterally with 0.5μL of siDAT and examined for mRNA expression after completion of the behavioral ex-periment using quantitative RT-PCR and the results are displayed in Table1. The Levene test used to assess variances was not significant (F(3, 37)= 1.124, p = 0.352). However, the
two-way ANOVA revealed that in the Nacc, DAT mRNA levels were decreased by approximately 60%, indicating that the siDAT was functional (main effect of virus: (F(1, 37)=
31.144, p < 0.0001), regardless of sex (F(1, 37)= 0.196, p =
0.661). Also, the virus × sex interaction was not significant (F(1, 37)= 0.193, p = 0.663).
These results suggest that we could consistently infect the Nacc, the infection lasted for the time required to complete behavioral experiments, and siDAT was effective in downreg-ulating DAT expression in infected accumbal neurons in vivo.
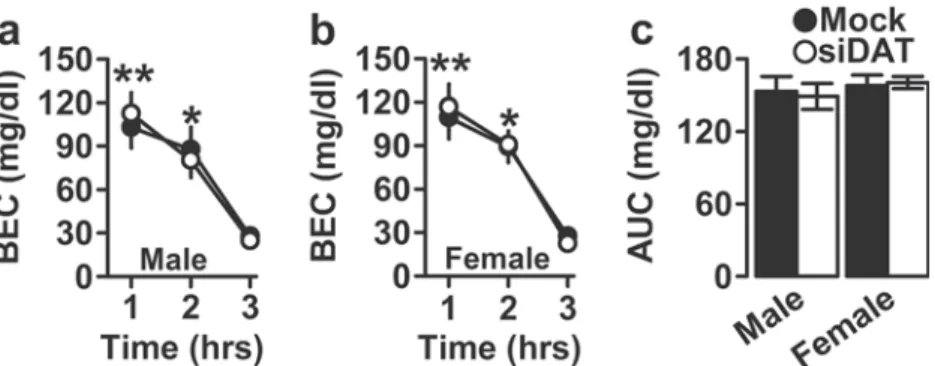
DAT knockdown in the Nacc did not affect BECs
Because differences in ethanol metabolism produced by the treatments might drive differences in voluntary ethanol intake and preference, we examined the time course of BECs after a 1.2-g/kg i.p. injection in the four experimental groups, and BECs from males and females were analyzed separately. In males, and after testing the normality of the data through the Levene test for the three time points (1 h: F(1, 18)= 2.394, p =
0.139; 2 h: F(1, 18)= 0.009, p = 0.924; and 3 h: F(1, 18)= 0.003,
p = 0.955), the one-way ANOVA with repeated measures re-vealed that plasma ethanol concentrations decreased in a time-dependent manner (main effect of time: F(2, 36)= 128.830,
p < 0.0001). However, we found no differences between mock- and siDAT-injected mice with respect to blood ethanol elimination rate at any time point (main effect of virus: F(1, 18)= 0.001, p = 0.977), and the virus × time interaction was
not found to be significant (F(2, 36)= 1.420, p = 0.255)
(Fig. 4a). Similarly, in females, BECs decreased overtime (F(2, 38)= 97.044, p < 0.0001). However, neither DAT
knock-down (F(1, 19)= 0.056, p = 0.816) nor the interaction (F(2, 38)= 0.455, p = 0.638) was found to be significant (Fig.4b).
Also, the Levene test for homogeneity of variance analysis
Table 1 Effect of DAT knockdown in males and females on DAT
mRNA levels. The data are expressed as mean ± SEM for relative DAT mRNA expression (arbitrary units) as measured by quantitative RT-PCR. n = 9–11
Mock siDAT
Males 1.000 ± 0.124 0.443 ± 0.090*
Females 1.000 ± 0.139 0.348 ± 0.078*
*p < 0.0001 indicates significant differences between mock and siDAT Fig. 3 Effect of DAT knockdown in males and females on quinine
consumption and total fluid intake after during a 24-h TBC test. The data are expressed as mean ± SEM for a quinine consumption, b total fluid intake in males, c quinine consumption, and d total fluid intake in fe-males. *p < 0.001 indicates significant differences between 35 and
70μM. n = 9–11
was not found to be significant (1 h: F(1, 19)= 0.095, p = 0.762;
2 h: F(1, 18)= 0.007, p = 0.933; and 3 h: F(1, 18)= 1.551, p =
0.228). The BEC data for both males and females were com-bined and analyzed using two-way ANOVA with repeated measures. The statistical analysis indicated that, as expected, there was a significant effect of time (F(2, 74)= 215.483,
p < 0.0001). However, the main effects of virus (F(1, 37)=
0.012, p = 0.914), sex (F(1, 37)= 0.593, p = 0.446), or the time
× sex × virus interaction (F(2, 74)= 0.282, p = 0.755) were not
found to be significant. Furthermore, and as displayed in Fig. 4c, the area under the curve (AUC) of the blood ethanol levels of the four experimental groups was analyzed and the Levene test used to assess variances was not significant (F(3, 37)=
1.454, p = 0.243). Also, the two-way ANOVA indicated that neither the virus (F(1, 37)= 0.006, p = 0.939) nor sex (F(1, 37)=
0.728, p = 0.399) affected the AUC. Also, the interaction was not significant (F(1, 37)= 0.123, p = 0.728).
Taken together, the changes in ethanol-related behaviors following DAT knockdown did not result from potential dif-ferences in clearance of alcohol.
Significant correlation between DAT mRNA
with ethanol-related behaviors
Using the data of DAT mRNA obtained from the mock- and siDAT-injected mice, a simple linear regression (Pearson) anal-ysis was performed to examine the correlation between DAT transcription levels and ethanol consumption and preference in both males and females, and the scatter plots are provided in Fig.5. Post hoc linear regressions revealed that differences in
Fig. 4 Effect of DAT knockdown in males and females on blood ethanol concentrations (BECs). The data are expressed as mean ± SEM for the time course of ethanol clearance, as measured by BECs over time,
following a 1.2-g/kg ethanol challenge in a male and b female C57BL/ 6J mice. c Area under the curve (AUC) for BECs in male and female
mice. *p < 0.001 for 2 vs. 3 h and *p < 0.0001 for 1 vs. 3 h. n = 9–11
Fig. 5 Pearson correlations in males and females for ethanol-related behaviors. The data repre-sent simple scatter regression be-tween accumbal DAT mRNA levels (arbitrary units) in mock-and siDAT-injected mice with a ethanol consumption, b ethanol preference, and c total fluid intake in males and with d ethanol con-sumption, e ethanol preference, and f total fluid intake in females
DAT mRNA levels within the Nacc accounted for many of the behavioral alterations exhibited by the mice.
In males, and as depicted in Fig. 5a, Pearson correlation coefficients revealed a positive correlation between DAT mRNA levels with ethanol consumption (r = 0.746; F(1, 18)= 22.656, p = 0.00014). However, post hoc linear
regres-sion analysis indicated that this effect was mainly driven by the siDAT-injected (r = 0.882, p = 0.0003), but not mock-injected mice (r = 0.173, p = 0.657). Similarly, DAT mRNA was positively correlated with ethanol preference (r = 0.845; F(1, 18)= 44.972, p < 0.0001). Again, the correlation was only
significant in the siDAT (r = 0.894, p = 0.0002), but not in the mock group (r = 0.527, p = 0.144) (Fig.5b). Finally, and as shown in Fig. 5c, DAT mRNA did not correlate with the amount of total fluid consumed (r =− 0.061; F(1, 18)= 0.067,
p = 0.799).
In females, the Pearson test revealed that there was a pos-itive correlation between DAT mRNA levels with ethanol in-take (r = 0.659; F(1, 19)= 14.562, p = 0.001), that was driven
by the siDAT-injected mice (r = 0.809, p = 0.003), but not the mock controls (r = 0.463, p = 0.177) (Fig.5d). In the same way, DAT mRNA correlated positively with ethanol prefer-ence in female mice (r = 0.709; F(1, 19)= 19.181, p < 0.0001).
The effects on correlation during this test were mainly driven by the siDAT-injected mice (r = 0.777, p = 0.005), but not the mock controls (r = 0.239, p = 0.507) (Fig.5e). Interestingly, and as displayed in Fig.5f, no significant correlation between DAT mRNA and total fluid intake was found (r = 0.007; F(1, 19)= 0.001, p = 0.974).
The results implied that, regardless of the sex of the ani-mals, ethanol consumption and preference were significantly associated with accumbal DAT mRNA expression. That is, all the proposed hypotheses were supported based on Pearson correlation coefficients.
No correlation between DAT mRNA with tastants
’
consumption and preference
We also conducted Pearson correlation coefficients to exam-ine the relationships between DAT mRNA and tastants’ intake and the results are depicted in Fig.6.
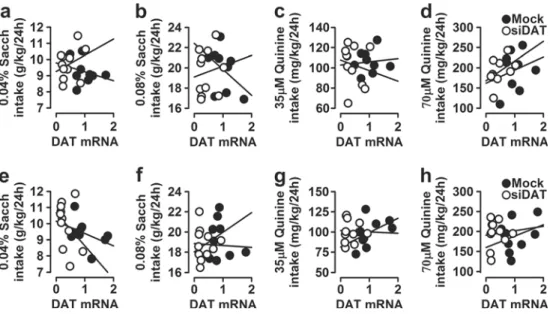
In males, we found that the linear relationships between DAT mRNA and saccharin consumption were not significant for both the 0.04% (r =− 0.139; F(1, 18)= 0.355, p = 0.559;
Fig. 6a) and the 0.08% (r =− 0.066; F(1, 18)= 0.079, p =
0.782; Fig.6b) solutions. Similarly, Pearson correlation coef-ficients indicated that the association between saccharin pref-erence and DAT mRNA was not significant for neither of the solutions (0.04%: r =− 0.077; F(1, 18)= 0.107, p = 0.747;
Suppl. Fig.1a and 0.08%: r = 0.174; F(1, 18)= 0.559, p =
0.464; Suppl. Fig.1b). Finally, for the total amount of fluid consumed, the Pearson correlation coefficients for the DAT mRNA obtained with the 0.04 and 0.08% solutions were not significant: (r =− 0.137; F(1, 18)= 0.344, p = 0.565; Suppl.
Fig.1c) and (r =− 0.094; F(1, 18)= 0.161, p = 0.693; Suppl.
Fig.1d), respectively. Furthermore, according to the Pearson correlation coefficient analyses, quinine consumption demon-strated no correlation with DAT mRNA for both solutions (35μM: r = 0.015; F(1, 18)= 0.004, p = 0.951; Fig.6c and
70μM: r = 0.295; F(1, 18)= 1.709, p = 0.208; Fig. 6d). For
quinine preference, the Pearson correlation coefficients were (r = 0.125; F(1, 18)= 0.287, p = 0.599; Suppl. Fig.2a) for the
35-μM quinine solution and (r = 0.380; F(1, 18)= 1.180, p =
0.187; Suppl. Fig.2b) for the 70-μM quinine solution, sug-gesting no correlation between DAT mRNA and quinine pref-erence. For total fluid intake, a Pearson correlation was con-ducted to test the relationship between DAT mRNA and be-havior response. No significant relationships were observed for the 35-μM (r = − 0.133; F(1, 18)= 0.326, p = 0.575; Suppl.
Fig. 6 Pearson correlations in males and females for tastant-related behaviors. The data repre-sent simple scatter regression be-tween accumbal DAT mRNA levels (arbitrary units) in mock-and siDAT-injected mice with a 0.04% saccharin consumption, b 0.08% saccharin consumption, c
35μM quinine consumption, and
d 70μM quinine consumption in
males and with e 0.04% saccharin consumption, f 0.08% saccharin
consumption, g 35μM quinine
consumption, and h 70μM
qui-nine consumption in females
Fig.2c) and the 70-μM (r = − 0.123; F(1, 18)= 0.275, p =
0.606; Suppl. Fig.2d) quinine solution.
In females, the Pearson correlation coefficient between DAT mRNA and saccharin consumption from the 0.04% so-lution was (r =− 0.410; F(1, 19)= 3.849, p = 0.065; Fig. 6e),
and with the 0.08% solution, it was (r = 0.341; F(1, 19)=
2.507, p = 0.130; Fig. 6f). Pearson correlation also showed no direct relationship between DAT mRNA and preference for the 0.04% (r =− 0.131; F(1, 19)= 0.330, p = 0.572; Suppl.
Fig.1e) or the 0.08% (r = 0.268; F(1, 19)= 1.473, p = 0.240;
Suppl. Fig.1f) saccharin solution. Lastly, Pearson correlations were calculated between DAT mRNA and total fluid intake, and the resulting correlation was not significant for both solu-tions (0.04%: r =− 0.430; F(1, 19)= 4.311, p = 0.052; Suppl.
Fig. 1g and 0.08%: r = 0.316; F(1, 19)= 2.111, p = 0.163;
Suppl. Fig.1h). Furthermore, according to Pearson correlation coefficient, it was observed that there is no significant rela-tionship between DAT mRNA and quinine consumption from either of the solutions (35μM: r = 0.160; F(1, 19)= 0.501, p =
0.488; Fig.6g and 70 μM: r = 0.108; F(1, 19)= 0.226, p =
0.640; Fig.6h). Similarly, there was no statistically significant correlation between DAT mRNA expression and quinine pref-erence for both solutions (35μM: r = 0.130; F(1, 19)= 0.326,
p = 0.575; Suppl. Fig.2e and 70 μM: r = 0.277; F(1, 19)=
1.575, p = 0.225; Suppl. Fig.2f). Finally, the total amount of fluid consumed when the 35- and 70-μM quinine solutions were presented was not affected by DAT mRNA levels ac-cording to the Pearson correlation analysis (r =− 0.191; F(1, 19)= 0.718, p = 0.407; Suppl. Fig.2g and r =− 0.173; F(1, 19)= 0.585, p = 0.454; Suppl. Fig.2h, respectively).
Overall, in both males and females, there was no significant relationship between accumbal DAT mRNA expression and tastants’ intake and preference.
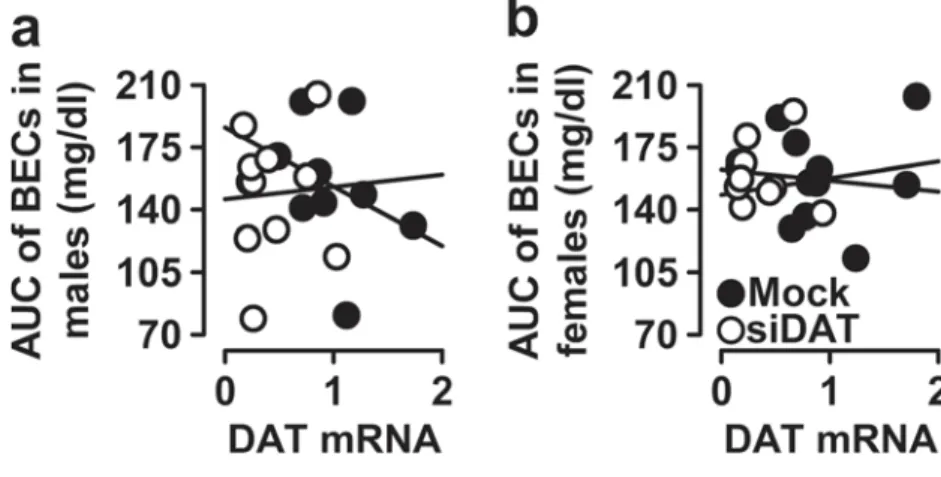
No correlation between DAT mRNA expression
with BECs
To determine whether DAT mRNA expression was associated with BECs in both males and females, Pearson correlation
coefficients were again obtained, and the results are depicted in Fig.7and Suppl. Fig.3.
In males and as shown in Fig.7a, the correlation between DAT mRNA and the AUC for the BECs was not significant (r =− 0.066; F(1, 18)= 0.080, p = 0.781). Also, DAT mRNA
was not associated with BECs at any time point: (BECs @ 1 h: r =− 0.063; F(1, 18)= 0.071, p = 0.793; Suppl. Fig. 3a),
(BECs @ 2 h: r =− 0.057; F(1, 18)= 0.059, p = 0.811; Suppl.
Fig.3b), and (BECs @ 3 h: r =− 0.042; F(1, 18)= 0.032, p =
0.860; Suppl. Fig.3c). Similarly, in females, the Pearson cor-relation did not indicate any cor-relationship between DAT mRNA and the AUC for the BECs (r = 0.015; F(1, 18)=
0.004, p = 0.949; Fig.7b). In addition, DAT mRNA was not associated with BECs at any time point: (BECs @ 1 h: r =− 0.007; F(1, 18)= 0.001, p = 0.977; Suppl. Fig.3d), (BECs @
2 h: r =− 0.045; F(1, 18)= 0.038, p = 0.847; Suppl. Fig. 3e),
and (BECs @ 3 h: r = 0.298; F(1, 18)= 1.853, p = 0.189; Suppl.
Fig.3f).
Taken together, regardless of sex, accumbal DAT mRNA alteration had no effect on BECs and alcohol metabolism.
Discussion
In this study, we explored the role of the accumbal DAT in relation to voluntary ethanol consumption and preference. DAT plays a significant role in ethanol-related behaviors, but its associated actions in the Nacc of adult male and female C57BL/6 mice are still to be determined. To fill this knowl-edge gap, an integrative approach of lentiviral-mediated gene transfer strategy (local DAT knockdown) and behavioral as-says was used. In line with our hypothesis, we found that local DAT knockdown in the Nacc reduced voluntary ethanol con-sumption and preference in a standard TBC drinking test. However, we found no sex-specific differences in males and females. Also, we found a strong correlation between DAT mRNA expression in the Nacc and ethanol-related behaviors. Control experiments showed that DAT knockdown had no
Fig. 7 Pearson correlations in males and females for BECs. The data represent simple scatter regression between accumbal DAT mRNA levels (arbitrary units) in mock- and siDAT-injected mice with AUC of BECs in a males and b females
effects on saccharin and quinine intake and preference as well as ethanol metabolism.
Our findings are partially consistent with the previous re-port that ethanol consumption and preference were reduced in DAT KO females but not in males, despite altered taste pref-erence for saccharin and quinine (Savelieva et al.2002). They also agree with the phenotype of prodynorphin knockouts, which, compared to WT mice, showed that increased ethanol consumption and preference in a TBC paradigm were associ-ated with higher DAT gene expression in the VTA and SN (Femenia and Manzanares2012). Together, these data suggest that accumbal DAT signaling modulates ethanol consumption and preference in mice regardless of the animals’ sex. However, our results do not agree with previous studies reporting that DAT deletion increased ethanol consumption. In detail, Hall and colleagues reported that ablation of DAT increased ethanol consumption in males but not in females, although female heterozygote mice exhibited higher ethanol preferences and there was a trend for female KO mice to drink less ethanol and to have lower preferences (Hall et al.2003). The reasons for these discrepancies are not clear. Nevertheless, one can speculate that the different genetic backgrounds of the mice used in these studies could, at least in part, explain the disparate results. In fact, DAT KO mice from Hall and colleagues’ study were maintained on a mixed C57/129sv background. Interestingly, it was found that inbred C57BL/6J mice showed greater ethanol preference and con-sumption than C57BL/6J × 129S4/SvJae F1 hybrids when ethanol was continuously available (Lim et al.2012), which is in line with previous studies comparing ethanol intake in B6 and 129 mice (Bachmanov et al.1996; Belknap et al.1993; Yoneyama et al.2008). Also, procedural differences are most likely to account for these disagreements, such as the concen-trations of the ethanol solutions used in the studies (up to 32% in the study by Hall and colleagues). Finally, environmental stressors such as ambient odors, noise, and vibrations that might certainly vary between animal facilities could alter eth-anol consumption, suggesting that test standardization should be a major concern for future research to reconciliate these findings. Furthermore, a possible pitfall when using constitu-tive DAT KO animals is that mice may present altered pheno-typic responses due to compensatory mechanisms to cope with the total absence of DAT expression in dopaminergic structures. Therefore, developing and producing conditional DAT KO animals could certainly help overcome these limitations.
In both mock- and siDAT-injected mice, we observed that females consumed more ethanol than males which is consistent with previously published studies. In fact, sev-eral studies reported that, compared to males, female mice consumed more of a high-ethanol concentration solution (10%) in a continuous access paradigm (Middaugh et al. 1999; Yoneyama et al.2008). Also, female adenosine A2A
receptor KO mice showed increased consumption of so-lutions containing 6 and 10% ethanol (Naassila et al. 2002). It should be emphasized that the decreased ethanol consumption observed following accumbal DAT knock-down was associated with a significant decrease in etha-nol preference, with control animals regardless of sex, showing high-ethanol preference ratios (> 50%), which was expected because this phenotype is significantly as-sociated to the genetic background. In fact, our data are in line with those of Yoneyama and colleagues showing that among the 22 inbred mouse strains tested, the C57BL/6J mice showed the highest preference for the 10% ethanol solution (approximately 90%) (Yoneyama et al. 2008). Consequently, it is safe to speculate that the reduced eth-anol preference observed in siDAT-injected mice was a clear indication of a low preference for the 10% ethanol solution over tap water.
Since it was originally introduced (Richter 1926), the TBC model has dominated studies of the neurobiology of alcohol drinking in rodents, and thus, a large body of literature exists using this procedure. Although this test can provide some very useful information about intensity, it is difficult to distinguish the intensity of the stimulus independent of its hedonic characteristics because it is the latter that drives the intake. In fact, Eylam and Spector found, using an operant-conditioning procedure, that the sodium chloride BNaCl^ detection thresholds were lower than the concentration at which the same mice started to consistently avoid the stimulus in a standard TBS proce-dure (Eylam and Spector 2002). Therefore, even though mice could perceive low concentrations of NaCl, they seemingly exhibited no reliable preference or aversion for them. In contrast, detection thresholds for sucrose and glucose correspond, at least in mice, significantly with preference thresholds reported in the literature (Bachmanov et al.2001) most probably because the emo-tional value of these stimuli increases significantly as soon as they are detected (Eylam and Spector 2004). Moreover, one main limitation of the long-term TBC pro-cedure is that post-ingestive measures can influence in-take and, consequently, might confound the interpretation of taste effects. Indeed, it has been reported that increased avoidance of phenylthiocarbamide (PTC) with ascending concentrations, by SWR/J mice, was most possibly due to the development of a conditioned aversion for PTC over consecutive intake tests, rather than the expression of un-conditioned avoidance due to its taste (St John et al. 2005). Taken together, the outcomes from the TBC should be cautiously interpreted considering the limitations of this procedure. Regardless, our findings indicated that the difference in ethanol consumption and preference ob-served between mock and siDAT mice cannot be accredited, at least, to differences in total fluid intake.
It is probable that the palatability or taste sensitivity of ethanol varies between mock and siDAT groups. However, in our studies, there were no significant differ-ences between the two groups of either preference for saccharin, or in avoidance of quinine solutions, suggest-ing that there were no differences in taste preference be-tween groups. These results confirm and extend current data. Our finding that both C57BL/6 experimental groups had higher saccharin preference ratios is consistent with earlier results from our laboratory (Bahi2017; Bahi et al. 2016). Consistent with our results, there is evidence that C57BL/6 mice have higher intakes of several sweet com-pounds, such as saccharin (Belknap et al. 1993). Interestingly, a positive correlation has been found be-tween ethanol intake and sweet solution intake among other inbred strains of mice (Belknap et al.1993) and rats (Stewart et al. 1994). However, our findings are at odds with the work of Costa and colleagues who tested both WT and DAT KO mice and found that the latter had stronger preference toward hedonically sweet tastant (su-crose 400 mM) in TBC test (Costa et al. 2007). Because these studies include an extensive variability of nutritive (sucrose) and nonnutritive (saccharin) sweeteners (Lush 1989), some of which are supposed to have no post-ingestive effects, the findings indicate that there is a ge-netically determined link between alcohol intake and sweet taste perception and we conclude that considerable caution must be exercised in interpreting the results using DAT KO mice.
Because, in humans, there is a significant link between predisposition to alcoholism and lower sensitivity to bitterness (Pelchat and Danowski1992), and the fact that the taste of ethanol has a bitter component to rats (Kiefer et al.1990), a preference for the bitter tastant (quinine) might predict in-creased ethanol consumption. Still, we found no indication for such connection. In fact, despite of the significant differ-ences in ethanol intake between mock- and siDAT-injected mice, both groups showed significant and similar tendencies to avoid the two quinine solutions. However, our results are not in line with the observations that DAT KO mice exhibited no significant difference in licking between quinine and water (Costa et al.2007), suggesting once again that these mice display reduced aversion to quinine. Thus, the altered taste sensitivity in DAT KO mice remains to be explained.
Several studies have used systemic injection of pharmaco-logical agents or constitutive knockout mice gene to study the effects of genes on ethanol consumption and preference, and most of these studies also evaluated the probability that sac-charin, or sucrose, or quinine preference had been affected (Crabbe et al.2006). As in the current study, many of those studies used the same mice tested for ethanol consumption and preference to measure intake and preference for tastants. We propose that controlling ethanol preference studies for
taste sensitivity, and preference or avoidance of other tastants, must be carefully interpreted if tastants are presented after ethanol. The safest way would be a between-subjects design for each tastant, starting with naive mice. Also, a serial proce-dure, using naive mice, in which saccharin preference is left to last could be a more adequate alternative as reported previous-ly (Crabbe et al.2011).
Our data reveal a significant decrease in alcohol intake and preference upon siDAT injection in the Nacc com-pared with mock controls. In this study, we used RT-PCR, rather than immunohistochemistry, to verify DAT accumbal knocked down. A caveat to this approach re-mains the possibility of a Bmiss^ in one or more mice. Indeed, Pearson linear regression analysis indicated that some mice retained levels of DAT that were very similar to control mice. Therefore, we cannot exclude the possi-bility that DAT may have been primarily knocked down in the dorsomedial striatum rather than the ventral stria-tum and findings should be interpreted with caution. Regardless, our hypothesis is that DAT knockdown result-ed in enhancresult-ed dopamine levels in the Nacc. In fact, in-creased extracellular dopamine concentrations in the Nacc in response to alcohol are a direct biochemical evidence of the incentive properties of alcohol (Di Chiara and Imperato 1988). Furthermore, using immunoprecipitation followed by mass spectrometry, ras-specific guanine-nu-cleotide releasing factor 2 (Rasgrf2) has been isolated as a binding partner of DAT (Maiya et al. 2007). One can speculate that reduced DAT expression, following shRNA injection, would be accompanied by a significant reduction of Rasgrf2 expression levels in the Nacc, be-cause after subchronic alcohol treatment, DAT mRNA ex-pression in Rasgrf2 KO mice decreased compared to WT levels (Easton et al. 2014). Interestingly, the work by Stacey and colleagues showed an absence of a accumbal dopamine response in Rasgrf2 KO and a clear reduction in alcohol-induced reinforcement in these mice (Stacey et al. 2012). Taken together, these data suggest that ab-normal dopamine activity in the Nacc following DAT knockdown might, at least in part, account for the de-creased motivational and rewarding effects of ethanol ob-served in these mice.
Mechanistically, about the reduction in ethanol intake and preference we observed following siRNA injection, we can hypothesize that DAT knockdown may be associ-ated with higher accumbal extracellular dopamine levels because of altered DAT mRNA expression and, conse-quently, reduced uptake, like in DAT KO mice (Giros et al.1996). Because increased dopamine levels were as-sociated with disrupted and desensitized D2 autoreceptors (Giros et al. 1996), because operant ethanol self-administration in D2 receptor KO mice was reduced (Risinger et al. 2000), and D2 receptor antagonism
decreased the acquisition of ethanol-induced conditioned taste aversion (Risinger et al.1999), it is safe to speculate that altered D2 receptor expression and/or functions in the Nacc affected ethanol-related behaviors following DAT knockdown. In fact, many studies have suggested that low D2 receptors’ availability is related with alcohol abuse. In fact, Volkow and colleagues showed that D2 receptors’ availability was significantly higher in caudate and ventral striatum in nonalcoholic subjects with a fam-ily history of alcoholism than in nonalcoholic subjects with a negative family history, suggesting that higher D2 receptors’ levels may be protective against alcoholism (Volkow et al.2006). Also, preclinical studies demonstrat-ed that injection of D2-expressing adenoviral vector, into the Nacc of rats previously trained to self-administer al-cohol, was associated with marked reductions in alcohol consumption and preference (43 and 64%, respectively) (Thanos et al. 2001). The same group also reported that D2 overexpression significantly decreased alcohol con-sumption (48%) and preference (37%) in alcohol-preferring rats (Thanos et al. 2004), suggesting that high D2 receptor expression might protect against excessive alcohol intake and preference in subjects with prior histo-ry of alcoholism or in those who are genetically predisposed to self-administer alcohol.
These findings suggest a role for DAT as a possible thera-peutic drug target that may tackle alcoholism and alcohol use disorders in humans. In fact, several DAT inhibitors are now available for treatment of other disorders such as obesity, nar-colepsy, and ADHD. Therefore, there is already significant clinical experience in the use of these medications that could guide strategies for their use to treat alcoholism. Nevertheless, it will be crucial and indispensable to evaluate the risks asso-ciated with treatment against risks assoasso-ciated with continued use of the abused stimulant. Finally, data from both preclinical and clinical studies indicate that patients can be safely main-tained on DAT inhibitors or substrates despite constant access to cocaine or other abuse stimulants [for review, see Howell and Negus2014].
In conclusion, the present study establishes an important role for DAT in ethanol-related behaviors; also, we have dem-onstrated that, regardless of sex, the localized gene knock-down in the Nacc reduced voluntary ethanol intake and pref-erence in a way that cannot be accredited to altered total fluid intake levels, taste preference/neophobia, or ethanol metabo-lism/absorption. Further research involving behavioral, bio-chemical, and electrophysiological assay will clarify the mechanism(s) by which DAT exerts its effects on ethanol consumption.
Acknowledgments The authors would like to acknowledge Mrs. Christine Deforel-Poncet and Dr. Frederic Boyer for their technical assis-tance with the lentiviral vectors’ preparation. The authors are also grateful
to Mr. Mohamed Shafiullah and Dr. Mahmoud Hag Ali from the Central Animal Facility for their advice on animal care and welfare.
Authors’ contribution AB designed the study and wrote the protocol. AB
and JLD managed the literature searches and analyses. AB undertook the statistical analysis, and AB and JLD wrote the first draft of the manu-script. All authors contributed to and have approved the final manumanu-script. Role of the funding source AB was supported by grants from the UAE University (No. NP/13/05) and the National Research foundation (No. 31M082). JLD received grants from the Swiss National Science Foundation 3100-059350 and 3100AO-100686. The funders had no fur-ther role in study design, analysis, writing of the report, or in the decision to submit the paper for publication.
Compliance with ethical standards
Conflict of interest The authors declare that they have no conflict of
interest.
Publisher’s Note Springer Nature remains neutral with regard to
juris-dictional claims in published maps and institutional affiliations.
References
Adriani W, Boyer F, Gioiosa L, Macri S, Dreyer JL, Laviola G (2009) Increased impulsive behavior and risk proneness following lentivirus-mediated dopamine transporter over-expression in rats’ nucleus accumbens. Neuroscience 159:47–58
Adriani W, Boyer F, Leo D, Canese R, Podo F, Perrone-Capano C, Dreyer JL, Laviola G (2010) Social withdrawal and gambling-like profile after lentiviral manipulation of DAT expression in the rat
accum-bens. Int J Neuropsychopharmacol 13:1329–1342
Al Ameri M, Al Mansouri S, Al Maamari A, Bahi A (2014) The histone deacetylase (HDAC) inhibitor valproic acid reduces ethanol con-sumption and ethanol-conditioned place preference in rats. Brain Res 1583:122–131
Bachmanov AA, Tordoff MG, Beauchamp GK (1996) Ethanol consump-tion and taste preferences in C57BL/6ByJ and 129/J mice. Alcohol
Clin Exp Res 20:201–206
Bachmanov AA, Tordoff MG, Beauchamp GK (2001) Sweetener prefer-ence of C57BL/6ByJ and 129P3/J mice. Chem Senses 26:905–913 Bahi A (2016) The oxytocin receptor impairs ethanol reward in mice.
Physiol Behav 139:321–327
Bahi A (2017) Decreased anxiety, voluntary ethanol intake and ethanol-induced CPP acquisition following activation of the metabotropic
glutamate receptor 8BmGluR8^. Pharmacol Biochem Behav 155:
32–42
Bahi A, Al Mansouri S, Al Maamari E (2016) Nucleus accumbens lentiviral-mediated gain of function of the oxytocin receptor regu-lates anxiety- and ethanol-related behaviors in adult mice. Physiol
Behav 164:249–258
Bahi A, Boyer F, Bussard G, Dreyer JL (2005a) Silencing dopamine D3-receptors in the nucleus accumbens shell in vivo induces changes in
cocaine-induced hyperlocomotion. Eur J Neurosci 21:3415–3426
Bahi A, Boyer F, Gumy C, Kafri T, Dreyer JL (2004) In vivo gene delivery of urokinase-type plasminogen activator with regulatable lentivirus induces behavioural changes in chronic cocaine
adminis-tration. Eur J Neurosci 20:3473–3488