HAL Id: hal-02502625
https://hal.archives-ouvertes.fr/hal-02502625
Submitted on 31 Dec 2020
HAL is a multi-disciplinary open access
archive for the deposit and dissemination of
sci-entific research documents, whether they are
pub-lished or not. The documents may come from
teaching and research institutions in France or
abroad, or from public or private research centers.
L’archive ouverte pluridisciplinaire HAL, est
destinée au dépôt et à la diffusion de documents
scientifiques de niveau recherche, publiés ou non,
émanant des établissements d’enseignement et de
recherche français ou étrangers, des laboratoires
publics ou privés.
Distributed under a Creative Commons Attribution - NoDerivatives| 4.0 International
License
ocean acidification
M. Bitter, L. Kapsenberg, Jean-Pierre Gattuso, C. Pfister
To cite this version:
M. Bitter, L. Kapsenberg, Jean-Pierre Gattuso, C. Pfister. Standing genetic variation fuels rapid
adaptation to ocean acidification. Nature Communications, Nature Publishing Group, 2019, 10 (1),
�10.1038/s41467-019-13767-1�. �hal-02502625�
ARTICLE
Standing genetic variation fuels rapid adaptation to
ocean acidi
fication
M.C. Bitter
1
*, L. Kapsenberg
2
, J.-P. Gattuso
3,4
& C.A. P
fister
1
Global climate change has intensi
fied the need to assess the capacity for natural populations
to adapt to abrupt shifts in the environment. Reductions in seawater pH constitute a
con-spicuous global change stressor that is affecting marine ecosystems globally. Here, we
quantify the phenotypic and genetic modifications associated with rapid adaptation to
reduced seawater pH in the Mediterranean mussel, Mytilus galloprovincialis. We reared a
genetically diverse larval population in two pH treatments (pH
T8.1 and 7.4) and tracked
changes in the shell-size distribution and genetic variation through settlement. Additionally,
we identi
fied differences in the signatures of selection on shell growth in each pH
environ-ment. Both phenotypic and genetic data show that standing variation can facilitate adaptation
to declines in seawater pH. This work provides insight into the processes underpinning rapid
evolution, and demonstrates the importance of maintaining variation within natural
popula-tions to bolster species
’ adaptive capacity as global change progresses.
https://doi.org/10.1038/s41467-019-13767-1
OPEN
1Department of Ecology and Evolution, University of Chicago, 1101 E. 57th St., Chicago, IL 60637, USA.2Department of Marine Biology and Oceanography,
CSIC Institute of Marine Sciences, Passeig Marítim de la Barceloneta, 37-49, E-08003 Barcelona, Spain.3Laboratoire d’Océanographie de Villefranche,
Sorbonne Université, CNRS, 181 chemin du Lazaret, 06230 Villefranche-sur-mer, France.4Institute for Sustainable Development and International Relations,
Sciences Po, 27 rue Saint Guillame, 75007 Paris, France. *email:[email protected]
123456789
A
fundamental focus of ecological and evolutionary biology
is determining if and how natural populations can adapt
to rapid changes in the environment. Recent efforts that
have combined natural population censuses with genome-wide
sequencing techniques have shown that phenotypic changes due
to abrupt environmental shifts oftentimes occur concomitantly to
signatures of selection at loci throughout the genome
1–6. These
studies demonstrate the importance of standing genetic variation
in rapid evolutionary processes
7, and challenge classical
popula-tion genetic theory, which assumes that most genetic variapopula-tion
has a small effect on
fitness and that selective forces alter this
variation gradually over a timescale of millennia
8. Though the
mechanisms maintaining such significant levels of genetic
varia-tion in natural populavaria-tions have been historically debated, recent
population genomic surveys have begun to elucidate the role of
spatially and temporally variable selection pressures in this
pro-cess
8. For example, environmental gradients in marine systems
can maintain signatures of balanced polymorphisms between
populations at multiple, putatively functional loci, even amidst
high levels of gene
flow
9–12. While this variation has enabled the
persistence of natural populations inhabiting the contemporary
and historic regimes of environmental variability, it is unclear
whether it will facilitate the magnitude and rate of adaptation
necessary for species persistence under the conditions expected as
a result of global climate change
13.
One pertinent threat facing marine species is ocean
acidifica-tion, the global-scale decline in seawater pH driven by oceanic
sequestration of anthropogenic carbon dioxide emissions
14. The
current rate of pH decline is unprecedented in the past 55 million
years
15, and lab-based studies have shown negative effects of
expected pH conditions on a range of
fitness-related traits (e.g.,
growth, reproduction, and survival) across life-history stages and
taxa
16. Marine bivalves are one of the most vulnerable taxa to
ocean acidification
17,18, particularly during larval development
19.
The ecologically and economically valuable Mediterranean
mus-sel, Mytilus galloprovincialis, is an exemplary species for studying
the effects of ocean acidification on larval development. Low-pH
conditions reduce shell size and induce various, likely lethal,
forms of abnormal larval development
20,21. Sensitivity to low pH,
however, can vary substantially across larvae from distinct
par-ental crosses, suggesting that standing genetic variation could fuel
an adaptive response to ocean acidification
21.
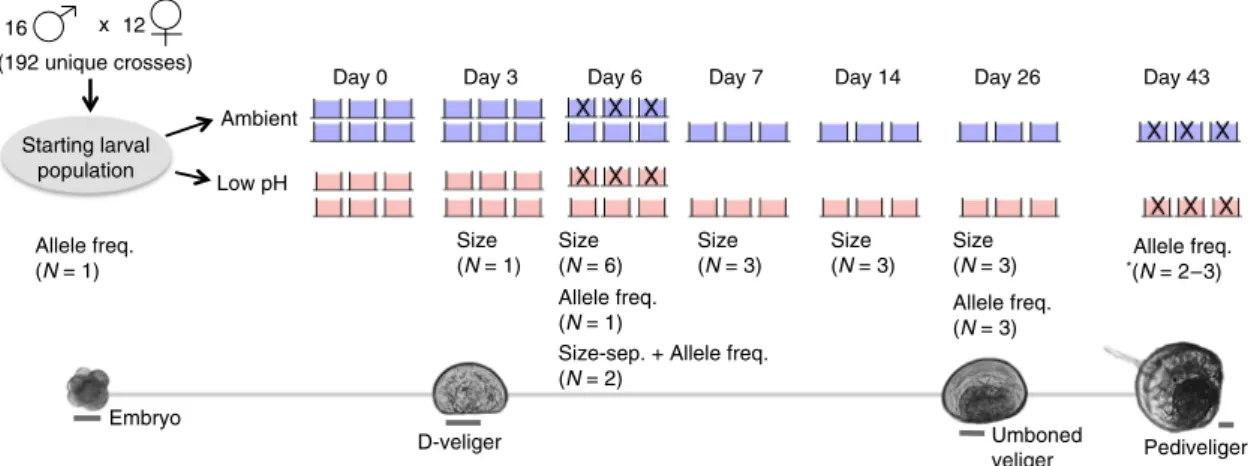
Here, we explored the potential for, and dynamics of, rapid
adaptation to ocean acidification in M. galloprovincialis. We
quantified the effects of low-pH exposure on phenotypic and
genetic variation throughout development in a single population
of M. galloprovincialis larvae (Fig.
1
). Larvae were reared in
ambient and low-pH and (i) shell-size distributions were
quan-tified on days 3, 6, 7, 14, and 26; (ii) the frequency of 29,400 single
nucleotide polymorphisms (SNPs) across the species’ exome was
estimated on days 6, 26, and 43; and (iii) signatures of selection
on larval shell size were determined in each treatment. To
gen-erate a starting larval population representative of the standing
genetic variation within a wild population of M. galloprovincialis,
16 males were crossed to each of 12 females, hereafter referred to
as founding individuals (N
= 192 unique crosses). The resulting
larval population was reared in an ambient (pH
T8.05, N
= 6
replicate buckets) and low-pH treatment (pH
T7.4–7.5, N = 6
replicate buckets). While the low-pH treatment falls outside the
range of annual variability the population currently experiences
(pH
T~7.8–8.1)
21, normal development of M. galloprovincialis
larvae can occur at this pH
21. We thus expected, a priori, that this
value would effectively reveal the presence of variation
under-pinning low-pH tolerance. Furthermore, while our low-pH
treatment falls below the expected 0.4 pH
Tunit decline in
glo-bal mean seawater pH by 2100
14, marine species occupying
unequilibrated coastal regions, such as the lagoon habitat of the
study population, may periodically experience pH conditions that
fall far below projected means during the next century
22.
Our results indicate substantial variation for low-pH tolerance
within M. galloprovincialis, and demonstrate that genotypes
exhibiting elevated
fitness in ambient conditions are distinct from
those exhibiting elevated
fitness in low-pH conditions. In a
broader framework, this study demonstrates a polygenic basis to a
rapid adaptive response and suggests the importance of
main-taining variation within natural populations to bolster species
resilience as global change progresses.
Results
Phenotypic trajectories. As expected, shell size was significantly
affected by pH treatment throughout the experiment (likelihood
ratio test, p
= 0.029), and shell length of low-pH larvae was 8%
smaller than that of larvae reared in ambient pH on days 3 and 7.
Shell length was affected by the interaction of day and treatment
(likelihood ratio test p < 0.001), indicating treatment-specific
growth patterns. From days 7 to 26 the size distributions in each
treatment began to converge, with larvae in low pH being only
Ambient Low pH
Day 0 Day 3 Day 6 Day 7 Day 14 Day 26 Day 43
Allele freq. (N = 1) Allele freq. (N = 1) Allele freq.(N = 3) Allele freq. *(N = 2–3) Size (N = 1) Size (N = 6) Size (N = 3) Size (N = 3) Size (N = 3)
Size-sep. + Allele freq. (N = 2)
Embryo
D-veliger Umboned Pediveliger
veliger
16 x 12
(192 unique crosses)
Starting larval population
Fig. 1 Experimental schematic. Pictures of larvae at key developmental points, cross design, and replication and sampling strategy throughout the experiment. Scale bar for larval pictures set at 50μm. Blue and red buckets correspond to ambient and low-pH treatments, respectively. Replicate buckets marked with an“X” were destructively sampled (i.e., all larvae removed/preserved) and thus absent from the experimental system on subsequent sampling days. *Allele frequency data from two replicate buckets in the ambient treatment was generated on day 43, as the third replicate bucket was sacrificed to optimize protocol for sampling settled larvae.
2.5% smaller than those cultured in the ambient treatment by day
26 (Fig.
2
). In addition, treatment-specific patterns of phenotypic
variation were observable during this period. Specifically, the
coefficient of variation of shell size was elevated in the low-pH
treatment on day 3 (ambient pH CV
= 3.52; low-pH CV = 5.16)
and day 7 (ambient pH CV
= 3.54; low-pH CV = 4.98). This
difference in phenotypic variation was reduced on day 14
(ambient pH CV
= 8.83; low-pH CV = 9.7) and no longer
evi-dent by day 26 (ambient pH CV
= 11.66; low-pH CV = 11.26).
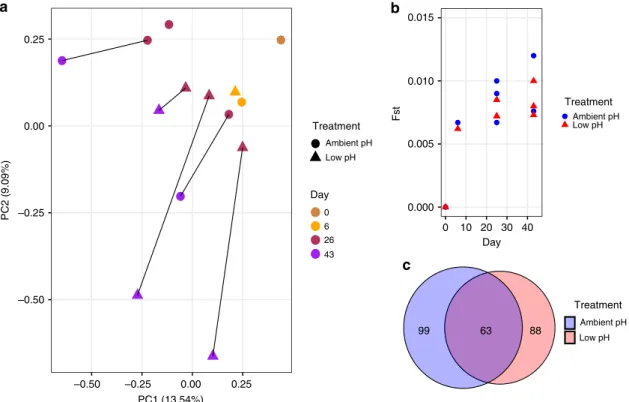
Changes in genetic variation. We identified 29,400 SNPs across
the species exome that were present within the larval population
across all sampling days and treatments. To link the observed
phenotypic trends in each treatment to changes in this variation,
we analyzed the SNP’s using principal component analysis
(PCA), outlier loci identification, and a statistical metric of
genomic differentiation (F
ST). For both ambient and low-pH
treatments, all analyses indicated increasing genomic
differ-entiation of the larval cultures away from the day 0 larval
population. This trend is visually apparent in the PCA, which
incorporated allele frequency data from all larval samples
col-lected during the pelagic stage and settlement (excluding
size-separated groups) (Fig.
3
). Through time there is an observed
increase in Euclidian distance among samples (e.g., days 26 and
43). This may be driven, at least in part, by selection-induced
0.00 0.03 0.06 0.09 0.12 80 120 160 200 0.00 0.03 0.06 0.09 0.12 80 120 160 200 0.00 0.03 0.06 0.09 0.12 80 120 160 200 0.00 0.03 0.06 0.09 0.12 80 120 160 200 pH treatment Low Ambient Density
Larval shell size (µm)
Day 3 Day 7 Day 14 Day 26
Fig. 2 Larval size distributions throughout the shell growing period. Blue and red densities correspond to shell-size distributions in ambient and low-pH treatments, respectively. Larval size was significantly affected by treatment (likelihood ratio test, p = 0.029) and the interaction of day and treatment (likelihood ratio test, p < 0.001) throughout the shell growing period. Source data for thisfigure are provided in the Source Data file.
–0.50 –0.25 0.00 0.25 –0.50 –0.25 0.00 0.25 PC1 (13.54%) PC2 (9.09%) Treatment Ambient pH Low pH Day 0 6 26 43 0.000 0.005 0.010 0.015 0 10 20 30 40 Day Fst Treatment Ambient pH Low pH 63 88 99 Treatment Ambient pH Low pH
a
b
c
Fig. 3 Patterns of genomic variation within larval populations throughout development. a Principal component analysis of allele frequency data from larval samples collected throughout the course of the experiment. Allele frequency data from 29,400 SNPs were used for PCA. PCA point color corresponds to developmental day, while shape corresponds to treatment condition.b FSTbetween the day 0 larval population and each larval population
treatment replicate throughout development. Blue circles and red triangles correspond to ambient and low pH replicate bucket FSTvalues, respectively.
c Venn diagram representing the extent of overlap in outer loci identified in ambient (blue) and low-pH (red) treatments. Source data for this figure are provided in the Source Datafile.
declines in larval survival throughout the pelagic phase, as well as
an increase in the influence of allele frequency drift among
replicate buckets (i.e., persistent random mortality leading to
replicate-specific patterns of selection). Observations of sustained
larval mortality throughout the experiment (indicated via empty
D-veliger shells in buckets) corroborated these trends, as did our
gross estimate of mortality between days 0 and 26 (97.7% and
97.6% in ambient and low-pH treatments, respectively).
We identified SNPs that changed significantly in frequency
between the day 0 larval population and the larvae sampled on
days 6, 26, and 43 in each treatment. Significant SNPs were
identified using a rank-based approach and the observed allele
frequency shift probabilities generated from the Fisher’s Exact
and Cochran–Mantel–Haenszel (CMH) tests. This analysis
indicated pervasive signatures of selection in both treatments,
with thousands of SNPs significantly changing in frequency
throughout the course of the experiment (Supplementary Fig. 1).
To identify a list of outlier loci for each treatment, we identified
loci containing significant SNPs on all sampling days, thus
leveraging independent replicate cultures and multiple sampling
days (see
“Methods” section for details). This resulted in the
identification of 162 and 151 total outlier loci in the ambient and
low-pH conditions, respectively. We compared the overlap in
these lists to identify pH-specific outliers (loci that were outliers
in only one of the pH treatments) and shared outliers (loci that
were outliers in both pH treatments). In total, we identified 99
ambient specific outlier loci (31 annotated), 88 low
pH-specific outlier loci (29 annotated), and 63 shared loci (24
annotated) based on transcriptome provided in Moreira et al.
23(see Supplementary Data 1 for outlier annotations and
Supple-mentary Data 2–4 for outlier loci sequences). Therefore, 58% of
the outlier identified in the low-pH treatment were unique to that
environment (i.e., did not display strong signatures of selection in
the ambient treatment) (Fig.
3
c). This
finding highlights the
potential polygenic nature of low-pH adaptation and
demon-strates that natural populations currently harbor variation at
these putatively adaptive loci.
Another statistical metric of genetic differentiation, F
ST, was
used to identify changes in the magnitude of selection throughout
development. We computed exome-wide estimates of F
STpairwise between the day 0 larval population and each available
replicate bucket on all sampling days. The greatest change in F
SToccurred between days 0 and 6, before elevating more slowly
thereafter, suggesting that the majority of selective mortality in M.
galloprovincialis larvae occurred prior to day 6 (Fig.
3
b).
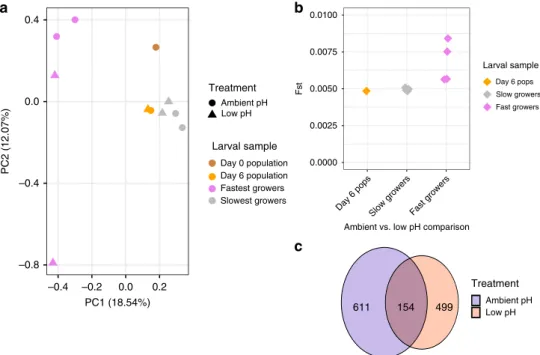
Signatures of selection on shell growth in ambient and low pH.
The size separation of larvae on day 6 isolated the largest 18%
from the smallest 82% of shell growers in the ambient, and the
largest 21% from the smallest 79% of shell growers in the low-pH
treatment (Supplementary Fig. 2). Hereafter, these groups will be
referred to as the fastest and slowest growers, respectively. Shell
size on day 6 was significantly affected by treatment and size class
(likelihood ratio test, p < 0.001). PCA using allele frequency data
from the day 0 starting larval population and larval samples
collected on day 6 revealed a strong genetic signature of size class
(Fig.
4
a). Specifically, the fastest growers segregated along PC1
from the slowest growers in both treatments, with the day 0 larval
population and day 6 larval population samples (from each
treatment) falling in between the size-separated groups. The
number of significant SNP’s differentiating the fastest and slowest
growers in each treatment, hereafter referred to as size-selected
SNPs, was comparable: 963 significant SNPs were identified in
ambient and 846 significant SNPs were identified in the low-pH
treatment (significance determined using CMH test). This led to
the identification of 611 size-selected loci that were unique to the
ambient pH treatment (225 annotated), 499 size-selected loci that
–0.8 –0.4 0.0 0.4 PC2 (12.07%)
a
–0.4 –0.2 0.0 0.2 PC1 (18.54%) Treatment Fst Ambient pH Low pH Larval sample Day 0 population Day 6 population Fastest growers Slowest growers 0.0000 0.0025 0.0050 0.0075 0.0100b
c
Larval sample Day 6 pops Slow growers Fast growers Day 6 popsSlow growers Fast growers
Ambient vs. low pH comparison
154 499 611
Treatment
Ambient pH Low pH
Fig. 4 Patterns of selection on shell growth in ambient and low-pH conditions. a Principle component analysis examining genomic signature of size separation in ambient and low-pH treatments. Allele frequency data are based on 29,400 SNPs and all samples collected on day 6, as well as the day 0 starting larval population. PCA point color corresponds to developmental day, while shape corresponds to treatment.b Exome-wide FSTcomputed
pairwise between ambient and low-pH replicate buckets for the entire larval population (day 6 pops) and the size-selected larvae isolated on day 6 (triangle color corresponds to larval sample) (day 6 Pops: N= 1 pairwise comparison; Slowest and Fastest Growers: N = 4 pairwise comparisons). c Venn diagram representing extent of overlap in loci displaying signatures of selection for shell growth in ambient (blue) and low-pH (red) treatments. Source data for thisfigure are provided in the Source Data file.
were unique to the low-pH treatment (184 annotated), and 154
size-selected loci (51 annotated) that were shared between
environments (Supplementary Data 5 contains existing
annota-tions for size-selected genes in each treatment and Supplementary
Data 6–8 contain associated sequences for size-selected genes).
Therefore, 76% of loci associated with fast shell growth in low-pH
were not associated with fast growth in the ambient treatment,
indicating unique targets of selection on shell growth in each
environment (Fig.
4
c). F
STanalysis corroborated this trend, as
elevated signatures of differentiation were observed between the
fastest growers in ambient and low pH, relative to differentiation
between the slowest growers and full larval populations in
ambient and low-pH treatments (Fig.
4
b).
Discussion
While previous work has shown strong negative effects of low pH
on larval development in bivalves
17–19,24, the results presented
here suggest that standing variation within the species could
facilitate rapid adaptation to ocean acidification. Observed shell
length differences on days 3 and 7 matched expectations for the
species based on previous work (−1 μm per 0.1 unit decrease in
pH)
21. However, this difference was reduced ~50% by day 14.
Mechanistically, low-pH treatment effects on bivalve larval shell
growth are driven by the limited capacity of larvae to regulate
carbonate chemistry, specifically aragonite saturation state, in
their calcifying space
25–27. Our data show that this physiological
limitation is greatest prior to day 7, after which a partial
con-vergence of the size distributions in the ambient and low-pH
treatments was observed.
It is likely that the partial convergence of shell-size
distribu-tions observed by day 14 was, at least in part, driven by natural
selection for low-pH tolerance. We have previously shown that
the smallest D-veligers in the low-pH treatment display an
increased prevalence of morphological abnormalities, which likely
become lethal during the shell growth period
21. Directional
selection against this phenotypic group would shift the size
dis-tribution closer to that of larvae reared in ambient conditions, as
we observed. The unique signatures of selection on shell growth
after 6 days of exposure to low pH, as well as the unique outlier
loci identified in the low-pH environment throughout the larval
period, further strengthen the notion that these phenotypic trends
were rooted in changes in the larval population’s underlying
genetic variation.
Documentation of substantial mortality by day 26 and
increasing genetic differentiation throughout the experiment, as
evidenced by PCA, significant changes in SNP frequencies, and
increasing values of F
ST, further suggest the process of selection
during the shell growth period. The observed trends in F
ST,
however, highlighted a developmental point of heightened
selection occurring before the convergence of the shell-size
dis-tributions. Specifically, when F
STis scaled by duration of
treat-ment exposure, the genomic differentiation between the day 0
larval population and the larval populations on day 6 was three
and
five times greater than that observed between the day 0 larval
population and the larval populations on days 26 and 43,
respectively. This suggests that a largely singular, intense selection
event occurred prior to day 6 and may be responsible for the
majority of genetic differentiation that occurs during larval
growth and settlement. We recently identified two specific early
developmental processes that are sensitive to low-pH conditions
and occur in this timeframe
21. These processes include the
for-mation of the shell
field (early trochophore stage) and the
tran-sition between growth of the
first and second larval shell (late
trochophore stage), both of which occur within 48 h of
fertiliza-tion and result in a suite of size-dependent morphological
abnormalities that likely become lethal during the shell growth
period
21. Traditionally, metamorphosis from the swimming
D-veliger to the settled juvenile is regarded as the main genetic
bottleneck during the development of marine bivalve larvae
28.
Our sampling from the embryo stage through settlement,
how-ever, suggests that there is a major selection event prior to day 6
that may have an even larger effect on shaping genotypes of
settled juveniles than any selection thereafter.
Additional factors that may have led to the observed
pheno-typic dynamics are food-augmented acclimation and selective
mortality via food competition. It has been demonstrated that
increased energy availability can allow marine invertebrates to
withstand pH stress
29and, in the case of Mytilus edulis, food
availability can mitigate the negative effects of ocean
acidifica-tion
30. This compensation, however, is unlikely in our
experi-ment. Our algal concentrations during the period of phenotypic
convergence (days 7–26) fell below optimal concentrations
reported for the species
31,32. In addition, settlement was not
observed in our experiment until 40 days into development. This
falls outside the 3–5 week larval pelagic phase documented in
previous work
31–33, and further demonstrates that the larvae were
indeed food limited in each treatment. This food limitation may
have induced intraspecific competition and facilitated the
selec-tive mortality of less
fit genotypes, thereby producing the
per-vasive signatures of selection observed in both treatments starting
on day 6. Furthermore, selection may have been concentrated on
the smallest larvae in low pH, thus driving the phenotypic
con-vergence between treatments. Ultimately, surviving larvae in the
low-pH treatment were able to partially compensate for the
negative effect of CO
2-acidification on calcification kinetics
26. As
pH tolerance has been shown to exhibit heritability in Mytilus
spp.
34,35, it is possible that multigenerational selection may
indeed allow the population to ultimately recover the offset in
shell-size observed in this experiment.
We identified hundreds of SNPs responding to each pH
treatment throughout the larval period and, via stringent
filtering
techniques, further winnowed these candidates to identify 162
outlier loci in ambient and 151 outlier loci in low-pH conditions.
Eighty-eight of the low-pH outliers (58%) were statistically
unchanged in the ambient conditions. While some of this
treat-ment disparity may be an artifact (i.e., false positives in the low
pH or false negatives in the ambient treatment), it is unlikely that
this is the case for all the unique outliers identified, given our
stringent
filtering techniques. These data thus provide evidence
that loci that were not critical for
fitness in the ambient
envir-onment came under strong selection in the low-pH envirenvir-onment.
The limited amount of overlap in size-selected loci and elevation
of F
STdifferentiation between the fastest growers further indicate
novel targets of selection for accelerated shell growth in the
low-pH environment. As shell growth is a direct proxy for
fitness
21,36,
these data suggest that the most
fit genotypes in ambient
con-ditions may not be the individuals that harbor the adaptive
genetic variation necessary to improve
fitness in simulated ocean
acidification. Furthermore, the near-equal magnitude of mortality
observed in each treatment suggests that adaptation to expected
declines in seawater pH within this species may proceed via a
reshuffling of standing genetic variation, effectively allowing
populations to bypass the dramatic declines in population size
that are characteristic of rapid evolution to abrupt environmental
shifts via
fixation of novel mutations
13.
Ultimately, these
findings contribute to an emerging body of
work demonstrating that rapid adaptation can indeed exhibit a
polygenic basis
2–4,37. Variation at functional loci across the
genome is likely maintained in populations via multilocus
bal-ancing selection between populations spanning environmental
gradients
9–12, or within populations experiencing temporally
fluctuating selection pressures
3,38. For example, populations of M.
edulis inhabiting the Baltic Sea are periodically exposed to the pH
conditions used in this study
34. Given extensive gene
flow and
hybridization of Mytilus populations throughout the Baltic Sea,
Atlantic, and Mediterranean, it is possible such gradients could
maintain adaptive low-pH tolerance throughout these regions,
though we lack explicit demonstration of this within the focal
population.
The dynamics observed in this study further suggest a potential
role of cryptic genetic variation (CGV) in adaptation to climate
change. CGV is defined as a subclass of standing variation with a
conditional effect, such that it becomes adaptive during evolution
to rare or novel environmental conditions
39. This conditional
effect may manifest as a genotype-by-genotype interaction, in
which an allele’s effect is conditional upon the genetic
back-ground (resulting from dominance or epistasis), or
genotype-by-environment interactions, in which an allele’s effect is conditional
upon the environment
39. In the context of the present study, the
low-pH treatment value is indeed rare in the study population’s
natural habitat
21and the pH-specific signatures of selection
indicate some of the variation that was putatively neutral in the
ambient treatment were conditionally beneficial in low-pH.
Furthermore, a defining characteristic of adaptation via cryptic
variation is the release of phenotypic variation in the novel
environment
39. Accordingly, we observed elevation of phenotypic
variation in the low-pH treatment on days 3 and 7, coinciding
with the inferred period of heightened selection (between days 0
and 6). Kingston et al.
35similarly showed that stressful conditions
(low pH, high temperature, and low food conditions) released
phenotypic variation in calcification rates in two species of
Mytilus mussels, and went on to link this variation to a number of
loci of moderate effect
35. While an important avenue of future
research is determining which CGV mechanisms
(genotype-by-genotype or (genotype-by-genotype-by-environment interactions) may be
producing such patterns, the economic and ecological importance
of marine mussels, as well as their global exposure to declining
seawater pH, highlight the need to conserve standing variation in
order to allow the adaptive capacity of natural populations to play
out as climate change progresses. Furthermore, exploring the
interplay of standing variation maintained by balanced
poly-morphisms and cryptic variation during adaptation to climate
change is an exciting avenue of future research, which may lend
fundamental insights into the dynamics of rapid evolutionary
processes.
Our list of low-pH outlier loci provide targets of natural
selection as ocean acidification progresses. Notably, this list
included an HSPA1A gene, which encodes heat shock protein 70
(HSP70) (NCBI Accession: XM_022468949), one of a group of
gene products whose expression is induced by physiological
stressors and generally work to mediate/prevent protein
dena-turation and folding
40. While substantial evidence has
docu-mented the role of HSP70 in the thermal stress response across a
range of taxa
40, emerging transcriptomic studies have also
demonstrated the protein’s role in the physiological response to
low-pH conditions in marine bivalves
41.
The influence of ocean acidification conditions on the
biomi-neralization process of calcifying marine species has been readily
documented
16. Indeed, two of our candidate low-pH outliers
mapped to a tyrosinase (NCBI Accession: XM_022487312) and
chitinase (NCBI: Accession: MG827131.1) gene, each part of
pathways known to be involved in calcium carbonate shell
for-mation in marine bivalves
42. Tyrosinase genes most broadly
function in the process of sclerotization, the mechanism by which
marine bivalves form the shell’s periostracum
43, and activity of
tyrosinase is heightened during larval shell biogenesis
44,45. The
outlier identified in this study mapped to a tyrosinase tyr3
isoform, which has previously been shown to be upregulated in
response to low-pH conditions in the Antarctic pteropod
46and
M. edulis
47. Chitinase genes produce organic scaffolds during
shell formation in marine bivalves and have additionally been
shown to change expression in response to seawater acidification
in Mytilus
47.
While such gene expression-based studies provide insight into
the underlying physiological responses to changes in seawater
chemistry, our study demonstrates the presence of underlying
genetic variation within these putatively adaptive loci. This
pro-vides, to our knowledge, the
first documentation of standing
genetic variation at functionally relevant loci within marine
bivalves, and ultimately offers robust evidence for the species’
capacity to adapt to changes in seawater pH. We are currently
investigating these candidates more deeply through a
combina-tion of comparative transcriptomics, quantitative PCR and in situ
hybridizations.
Many outlier loci in low pH were also outliers in the ambient
treatment (42%). This likely represents the action of selection
against recessive homozygotes within the population, termed
genetic load
48, and selection induced by the laboratory regime.
The influence of genetic load has been demonstrated to induce
signatures of selection in neutral environments in a range of
highly fecund species, such as plants and marine bivalves
28,49.
Our crossing scheme likely amplified this signature, as equal
proportions of all pairwise crosses were conducted, thereby
maximizing the likelihood of lethal, or less
fit, homozygotes in the
day 0 larval population. These shared signatures of selection
could be further associated with selective pressures induced by the
laboratory conditions, such as salinity, temperature, or the food
resources, which are independent of the pH manipulation, yet still
may have favored a subset of genetic backgrounds in this
genetically diverse species
50.
Species persistence as global climate change progresses will, in
part, hinge upon their ability to evolve in response to the shifting
abiotic environment
13. Our data suggest that the economically
and ecologically valuable marine mussel, M. galloprovincialis,
harbors standing variation that would facilitate rapid adaptation
to ocean acidification. We have further demonstrated that
gen-otypes exhibiting elevated
fitness in current ocean conditions may
be distinct from those exhibiting elevated
fitness in future oceans.
Ultimately, these
findings support conservation efforts aimed at
maintaining variation within natural populations to increase
species resilience to future ocean conditions. In a broader
evo-lutionary framework, the substantial levels of genetic variation
present in natural populations have historically puzzled
evolu-tionary biologists
51. Though this study does not address the
processes that maintain this variation, we demonstrate its utility
in rapid adaptation, thereby advancing our understanding of the
mechanisms by which natural populations evolve to abrupt
changes in the environment.
Methods
Larval cultures. Mature M. galloprovincialis individuals were collected in Sep-tember 2017 from the underside of afloating dock in Thau Lagoon (43.415 °N, 3.688 °E), located in Séte, France. Thau Lagoon has a mean depth of 4 m and connection to the Mediterranean Sea by three narrow channels. pH variability at the collection site during spawning season ranges from pHT7.80 to 8.1021. Mussels
were transported to the Laboratoire d’Océanographie (LOV) in Villefranche-sur-Mer, France and stored in aflow-through seawater system maintained at 15.2 °C until spawning was induced.
Within 3 weeks of the adult mussel collection, individuals were cleaned of all epibiota using a metal brush, byssal threads were cut, and mussels were warmed in seawater heated to 27 °C (~+12 °C of holding conditions) to induce spawning. Individuals that began showing signs of spawning were immediately isolated, and allowed to spawn in discrete vessels, which were periodically rinsed to remove any potential gamete contamination. Gametes were examined for viability and stored on ice (sperm) or at 16 °C (eggs). In total, gametes from 12 females and 16 males
were isolated to generate a genetically diverse starting larval population. To produce pairwise crosses, 150,000 eggs from each female were placed into 16 separate vessels, corresponding to the 16 founding males. Sperm from each male was then used to fertilize the eggs in the corresponding vessel, thus eliminating the potential effects of sperm competition and ensuring that every male fertilized each female’s eggs. After at least 90% of the eggs had progressed to a four-cell stage, equal volumes from each vessel were pooled to generate the day 0 larval population (~2 million individuals), from which the replicate culture buckets were seeded. A total of 100,000 individuals were added to each culture buckets (N= 12, 18 embryos mL−1). The remaining embryos were frozen in liquid nitrogen, and stored at−80 °C for DNA analysis of the day 0 larval population. Likewise, gill tissue was collected from all founding individuals and similarly stored for downstream DNA analyses. Larvae were reared at 17.2 °C for 43 days. Starting on day 4, larvae were fed 1.6 × 10⁸cells of Tisochrysis lutea daily. Beginning on day 23, to account for
growth and supplement diet, larvae diet was complemented with 0.2μL of 1800 Shellfish Diet (Reed Mariculture) (days 23–28 and day 38) and ~1.6 × 10⁸cells of
Chaetoceros gracilis (days 29–37 and 39–41). Algae were added as a pulse to each experimental replicate, twice daily (early morning, late afternoon). As the system wasflow-through on days 0–26, the density of algae declined between consecutive pulses. The number of algae in each pulse was determined daily within the algal stock solution, and values reported above are the average of daily algal additions. Evidence of food consumption by larvae was indicated by observed food in larval guts, as well as substantial growth of larvae throughout the experiment. Larval sampling. We strategically sampled larvae throughout the experiment to observe phenotypic and genetic dynamics across key developmental events, including the trochophore to D-veliger transition (day 6), the shell growth period (days 4–26), and the metamorphosis from D-veligers to settlement (days 40–43). On day 6 of the experiment, larvae were sampled from three of the six replicate buckets per treatment. A subset of larvae (N= 91–172) from each bucket was isolated to obtain shell length distributions of larvae reared in the two treatments. The remaining larvae were separated by shell size using a series of six Nitex mesh filters (70, 65, 60, 55, 50, and 20 μm; Supplementary Fig. 2b) and frozen at −80 °C. The smallest size group contained larvae arrested at the trochophore stage, and therefore unlikely to survive. The remainingfive size classes isolated D-veligers from the smallest to the largest size. The shell length distribution of the larvae was used to inform, a posteriori, which combination of size classes would produce groups of the top 20% and bottom 80% of shell growers from each treatment. The relevant size groups from two replicates per treatment were then pooled for downstream DNA analysis of each phenotypic group. For the third replicate, a posteriori, all size groups were pooled in order to compute the allele frequency distribution from the entire larval population in each treatment on day 6. This sample was incorporated into analyses of remaining replicate buckets, which were specifically used to track shifts in phenotypic and genetic dynamics throughout the remainder of the larval period in each treatment.
Following size separation on day 6, the remaining replicate buckets (N= 3 per treatment) were utilized to track changing phenotypic and allele frequency distributions in the larval population through settlement. Larvae were sampled for size measurements on day 3 (N= 30–36 individuals), day 7 (N = 38–71 individuals), day 14 (N= 37–104 individuals), and day 26 (N = 49–112 individuals). Also on day 26, an additional ~1,000 larvae per replicate were frozen and stored at−80 °C pending DNA analysis. Finally, on day 43, settled individuals were sampled from each bucket (settlement wasfirst observed on day 40 in all buckets). Treatment water was removed, and culture buckets were washed three times with FSW to remove unsettled larvae. Individuals that remained attached to the walls of the bucket were frozen and stored at−80 °C for DNA analysis. Culture system and seawater chemistry. Larvae were reared in a temperature-controlled sea table (17.2 °C) and 0.35μm filtered and UV-sterilized seawater (FSW), pumped from 5 m depth in the bay of Villefranche. Two culture systems were used consecutively to rear the larvae, both of which utilized the additions of pure CO2gas for acidification of FSW. First, from days 0 to 26 the larvae were kept
in aflow-through seawater pH-manipulation system. Briefly, seawater pH (pHT
8.05 and pHT7.4) was controlled in four header tanks using a glass pH electrode
feedback system (IKS aquastar) and pure CO2gas addition and constant CO2-free
air aeration. Two header tanks were used per treatment to account for potential header tank effects. Each header tank supplied water to three replicate culture buckets (drip rate of 2 L h−1),fitted with a motorized paddle and Honeywell Durafet pH sensors for treatment monitoring (see Kapsenberg et al.52for
cali-bration methods).
On day 27 of the experiment, theflow-through system was stopped due to logistical constraints and treatment conditions were maintained, in the same culture buckets, using water changes every other day. For water changes 5 L of treatment seawater (70% of total volume) was replaced in each culture using FSW preadjusted to the desired pH treatment. Seawater pH in each culture bucket was measured daily, and before and after each water change.
All pH measurements (calibration of Durafets used from days 0 to 26 and monitoring of static cultures from days 27 to 43) were conducted using the spectrophotometric method and purified m-cresol dye and reported on the total scale (pHT)53. Samples for total alkalinity (AT) and salinity were taken from the
header tanks every 2–3 days from days 0 to 26 and daily during the remainder of the experiment. ATwas measured using an open cell titration on Metrohhm
Titrando 88853. Accuracy of ATmeasurements was determined using comparison
to a certified reference material (Batch #151, A. Dickson, Scripps Institution of Oceanography) and ranged between−0.87 and 5.3 μmol kg−1, while precision was 1.23μmol kg−1(based on replicated samples, n= 21). Aragonite saturation and
pCO2 were calculated using pH and ATmeasurements and the seacarb package54
in R with dissociation constants K1and K255, Kf56and Ks57. Seawater chemistry
results are presented in Supplementary Tables 1 and 2.
Shell-size analysis. Shell size was determined as the maximum shell length par-allel to the hinge using brightfield microscopy and image analysis in ImageJ soft-ware. All statistical analyses were conducted in R (v. 3.5.3). As larval shell length data did not pass normality tests (Shapiro–Wilk test), shell-size was log-transformed to allow parametric statistical analysis. We tested the effect of day, treatment, and the interaction of the two using linear-mixed effects models, with day and treatment asfixed effects and replicate bucket as a random effect (lmer). Effects of treatment and size class on log-transformed shell length from size-separated larvae were also analyzed using a linear-mixed effect model in which size class, treatment, and their interaction werefixed effects, while larval bucket was a random effect. Significance of the fixed effects were tested against a null model using a likelihood ratio test.
DNA extraction and exome sequencing. We implemented exome capture, a reduced-representation sequencing approach, to identify SNPs and their frequency dynamics throughout the course of the experiment. Exome capture targets the protein-coding region of the genome, and thus increases the likelihood that identified polymorphisms are in or near functional loci58. Genomic DNA from
each founding individual and larval sample was extracted using the EZNA Mollusc Extraction Kit, according to manufacturer’s protocol. DNA was quantified with a Qubit, and quality was determined using agarose gel, Nanodrop (260/280), and TapeStation analysis.
Genomic DNA was hybridized to a customized exome capture array designed and manufactured by Arbor Biosciences (Ann Arbor, Michigan) and using the species transcriptome provided in Moreira et al.23. Specifically, in order to design a
bait set appropriate for capture of genomic DNA fragments, 90-nucleotide probe candidates were tilled every 20 nucleotides across the target transcriptome contigs. These densely tiled candidates were MEGABLASTed to the M. galloprovincialis draft genome contigs available at NCBI
(GCAA_001676915.1_ASM167691v1_genomic.fna), which winnowed the candidate list to only baits with detected hits of 80 nucleotides or longer. After predicting the hybrid melting temperatures for each near-full-length hit, baits were further winnowed to those with at most two hybrids of 60 °C or greater estimated melting temperature in the M. galloprovincialis genome. This collection of highly specific baits with near-full-length hits to the draft genome were then down-sampled to a density of roughly one bait per 1.9 kbp of thefinal potential target space, in order to broadly sample the target while stillfitting within our desired number of myBaits kit oligo limit. Thefinal bait set comprises 100,087 oligo sequences, targeting 94,668 of the original 121,572 transcriptome contigs.
Genomic DNA from each sample was subject to standard mass estimation quality control, followed by sonication using a QSonica QR800 instrument and SPRI-based dual size selection to a target modal fragment length of 350 nucleotides. Following quantification, 300 ng total genomic DNA was taken to library preparation using standard Illumina Truseq-style end repair and adapter ligation chemistry, followed by six cycles of indexing amplification using unique eight nucleotide dual index primer pairs. For target enrichment with the custom myBaits kit, 100 ng of each founder-derived library were combined into two pools of 14 libraries each, whereas 450 ng of each embryonic and larval-pool derived library were used in individual reactions. After drying the pools or individual samples using vacuum centrifugation to 7μL each, Arbor followed the myBaits procedure (v. 4) using the default conditions and overnight incubation to enrich the libraries using the custom probe set. After reaction cleanup, half (15μL) of each bead-bound enriched library was taken to standard library amplification for ten cycles using Kapa HiFi polymerase. Following reaction cleanup with SPRI, each enriched library or library pool was quantified using qPCR, indicating yields between 30 and 254 ng each.
The captured libraries were sequenced at the University of Chicago Genomics Core Facility on three lanes of Illumina HiSeq 4000 using 150-bp, paired-end reads. The captured adult libraries were sequenced on an individual lane, while the 22, pooled larval samples were split randomly between the remaining two lanes. Average coverage for founding individuals was 40×, while average coverage in pooled samples was 100×.
Read trimming and variant calling. Raw DNA reads werefiltered and trimmed using Trimmomatic59, and aligned to the species reference transcriptome provided
in Moreira et al.23using bowtie260. Variants in the founding individuals were
identified using the Genome Analysis Toolkit’s Unified Genotyper61. These
var-iants werefiltered using VCFTOOLs62with the following specifications: Minor
Allele Frequency of 0.05, Minimum Depth of 10x, and a Maximum Variant
Missing of 0.75. The resulting.vcffiles provided a list of candidate bi-allelic poly-morphisms to track at each time point, treatment, and phenotypic group in the larval samples. Accordingly, GATK’s Haplotype Caller was used to identify these candidate polymorphisms within each larval alignmentfile, and the resulting.vcf wasfiltered using VCFTOOLs and the following specifications: Minor Allele Fre-quency of 0.01, Minimum Depth of 50x, and Maximum Depth of 450x. Only variants that passed qualityfiltering and were identified in all larval samples (i.e., each day, treatment, and phenotypic group) were retained for downstream ana-lyses. This process resulted in a candidate SNP list of 29,400 variants. Allele fre-quencies for each variant were computed as the alternate allelic depth divided by total coverage at the locus.
Allele frequency analysis. To explore how the allele frequency of the 29,400 SNPs changed in each environment throughout the course of the experiment, we used a combination of PCA, outlier loci identification tests, and a statistical test of genomic differentiation (FST). We visualized patterns of genetic variation
throughout the experiment with PCA (prcomp function in R). Prior to PCA, the allele frequency matrix was centered and scaled using the scale function in R. Only larval samples that encompassed the full phenotypic distribution within a parti-cular bucket were included in this analysis. In other words, the rows of the allele frequency matrix corresponding to larval samples that were selectively segregated based on shell size were removed, and PCA was run using the day 0 larval population and larval samples collected from each treatment on days 6, 26, and 43. A separate PCA was then implemented using allele frequency data from the day 0 larval population and all day 6 larval samples, which included discrete size groups from each treatment. This analysis thus explicitly examined a genomic signature of the individuals that were phenotypically distinct.
We next sought to identify the presence, number, and treatment-level overlap of genetic variants that significantly changed in frequency between larval samples. Specifically, Fisher’s Exact Test (FET) and the CMH test were used to generate probabilities of observed allele frequency changes, using the package Popoolation63
in R. P values for each SNP were converted to q values in the R package q value64,
and significant SNPs were identified as those SNPs with a q value < 0.01. As the CMH test computes probabilities for SNPs based on consistent changes among replicates, it is a powerful approach to identifying significantly changed SNPs when treatment replicates are available63. Accordingly, this test was used identify
significant allele frequency changes between the day 0 larval population and the day 26 ambient and low-pH treatment replicates (N= 3), the day 0 larval population and the settled individuals from ambient (N= 2) and low-pH treatment replicates (N= 3), and between the top 20% and bottom 80% of growers in each treatment (N= 2). This test thus produced a single, significant SNP list for each treatment on days 26 and 43, as well as the size-separated day 6 larvae. As treatment replicates were not available the ambient and low-pH larval population samples on day 6, an alternate contingency table test, FET, was used to obtain a list of significant SNPs for this day of sampling (with identical rank-based approach/ multiple testing corrections as those used for the CMH tests). The resulting lists of significant SNPs for days 6, 26, and 43 were then compared with identify outlier loci for each treatment. Specifically, outliers were identified for each treatment as those loci containing significant SNPs on each sampling day (i.e., SNPs overlapping among a treatment’s three significant SNP lists). As the buckets sampled on day 6 were independent cultures from those buckets sampled on days 26 and 43, this process leverages both multiple independent larval cultures and sampling days to obtain a robust outlier list for each treatment.
To provide a third, independent metric of genomic change in the larval population throughout the experiment, we computed the FSTstatistic for a series of
comparisons. Specifically, we implemented a methods-of-moments estimator of FSTfrom Pool-seq data in an analysis of variance framework, as described in Hivert
et al.65(poolFstat package in R). A global (exome-wide) FSTstatistic was computed
pairwise between the day 0 larval population and the day 6 ambient and low pH larvae replicate buckets, day 26 ambient and low-pH larvae replicate buckets, and settled individuals from all replicate buckets in ambient and low pH. FSTwas also
computed to compare differentiation between phenotypic groups (top 20% and bottom 80% of growers) on day 6. As poolFstat necessitates an approximation of population size, we parameterized the model using larval counts obtained on days 0 and 26, and estimates of larval population size for days 6 and 43. The population size in each replicate bucket on day 0 was 100,000 individuals, as larval counts were conducted on the starting larval culture and an equal volume (containing 100,000 individuals) was added to each replicate bucket. To calculate population sizes on day 26, 200 mL of seawater was extracted from each replicate bucket, from which larvae were concentrated using a 70μm mesh filter and subsequently photographed using brightfield microscopy. This mesh size was selected based on data obtained from the size selection of larvae (Supplementary Fig. 1), and chosen tofilter out D-veligers that had failed to grow, and therefore survive, beyond day 6. The number of photographed larvae on day 26 thus provided a proxy for the population size at this time point: population size was estimated to be 3685, 2090, and 1183 in the ambient replicates and 2503, 1733, and 2888 in the low-pH replicates. These estimates suggest average mortality rates of 97.7 and 97.6 % in the ambient and low-pH conditions, respectively. These estimates are in accordance with previous studies that have similarly reported substantial mortality of marine bivalve larvae
reared in laboratory settings66–69. Larval counts from day 26 were used to estimate
a broad range of feasible population sizes on days 6 and 43. Specifically, given the observed population sizes on day 26 (reported above), FSTwas computed over
large ranges of population sizes on day 6 (10,000–40,000 individuals) to encompass both linear and nonlinear declines in population size throughout the growth period. While larval counts were additionally not conducted on day 43 (all larvae sampled on this day needed to be preserved for sequencing to ensure accurate allele frequency estimates), the larvae were observable to the naked eye at this time point. This allowed for the observations that there were: (1) no treatment-specific patterns in the total number of settled larvae and (2) the number of settled larvae was greater than 100 but far less than 400 individuals at this time point. FSTwas thus
computed using input pool sizes between 100 and 400 individuals for day 43 samples. Results demonstrating how computed values of FSTchanged according
to these differences in input pool size are reported in Supplementary Table 3. Gene identification/Ontologies. We next sought to explore the biological path-ways that were associated with survivorship in each pH treatment and/or size group during the experiment. To accomplish this, we indexed our list of outlier loci using the annotated transcriptome provided in Moreira et al.23. Their annotation
utilizes NCBI’s nucleotide and nonredundant, Swissprot, KEGG, and COG data-bases, thus providing a thorough survey of potential genes and pathways associated with our candidate SNPs. We generated gene lists for pH-specific outlier loci, which were identified as loci that showed signatures of selection on all sampling days and were unique to each environment. We also generated a candidate gene list for loci that exhibited shared signatures of selection in each treatment. These lists thus only contain robust outlier loci (i.e., containing significant SNPs in multiple independent replicates), with potentially strong effect sizes (i.e., containing sig-nificant SNPs at multiple developmental stages). Lastly, we used the Moreira et al.23
annotation to explore the genes that exhibited signatures of selection for shell growth in ambient and low-pH conditions, as well as shared signatures of selection for shell size in each treatment.
Reporting summary. Further information on research design is available in the Nature Research Reporting Summary linked to this article.
Data availability
Exome capture nucleotide sequences generated for this study are available as an NCBI SRA project (PRJNA578149). Data necessary to replicate allfigures presented in the paper, as well as thosefigures and tables from the supplement are provided as a Source Data File. All raw data used in analyses are publicly available at: [https://github.com/ MarkCBitter/Mgallo_SelectionExperiment].
Code availability
Code used to analyze data and generatefigures for this paper is publicly available at [https://github.com/MarkCBitter/Mgallo_SelectionExperiment].
Received: 15 May 2019; Accepted: 22 November 2019;
References
1. Umina, P. A., Weeks, A. R., Kearney, M. R., McKechnie, S. W. & Hoffmann, A. A. A rapid shift in a classic clinal pattern in drosophila reflecting climate change. Science 308, 691–693 (2005).
2. Rodríguez-Trelles, F., Tarrío, R. & Santos, M. Genome-wide evolutionary response to a heat wave in drosophila. Biol. Lett. 9, 20130228 (2013). 3. Bergland, A. O., Behrman, E. L., O’Brien, K. R., Schmidt, P. S. & Petrov, D. A.
Genomic evidence of rapid and stable adaptive oscillations over seasonal time scales in drosophila. PLoS. Genet. 10, e1004775 (2014).
4. Campbell-Staton, S. C. et al. Winter storms drive rapid phenotypic, regulatory, and genomic shifts in the green anole lizard. Science 357, 495–498 (2017). 5. Schiebelhut, L. M., Puritz, J. B. & Dawson, M. N. Decimation by sea star
wasting disease and rapid genetic change in a keystone species, Pisaster ochraceus. Proc. Natl Acad. Sci. 115, 7069–7074 (2018).
6. De Wit, P., Rogers-Bennett, L., Kudela, R. M. & Palumbi, S. R. Forensic genomics as a novel tool for identifying the causes of mass mortality events. Nat. Commun. 5, 3652 (2014).
7. Barrett, R. D. H. & Schluter, D. Adaptation from standing genetic variation. Trends Ecol. Evol. 23, 38–44 (2008).
8. Messer, P. W., Ellner, S. P. & Hairston, N. G. Can population genetics adapt to rapid evolution? Trends Genet. 32, 408–418 (2016).
9. Pespeni, M. H. & Palumbi, S. R. Signals of selection in outlier loci in a widely dispersing species across an environmental mosaic. Mol. Ecol. 22, 3580–3597 (2013).
10. Bay, R. A. & Palumbi, S. R. Multilocus adaptation associated with heat resistance in reef-building corals. Curr. Biol. 24, 2952–2956 (2014). 11. Gagnaire, P.-A., Normandeau, E., Côté, C., Hansen, M. M. & Bernatchez, L.
The genetic consequences of spatially varying selection in the panmictic American Eel (Anguilla rostrata). Genetics 190, 725–736 (2012).
12. Silliman, K. Population structure, genetic connectivity, and adaptation in the Olympia oyster (Ostrea lurida) along the west coast of North America. Evol. Appl. 12, 923–939 (2019).
13. Hoffmann, A. A. & Sgrò, C. M. Climate change and evolutionary adaptation. Nature 470, 479–485 (2011).
14. Hoegh-Guldberg, O. et al. Climate Change 2014: Impacts, Adaptation, and Vulnerability. Part B: Regional Aspects. In Contribution of Working Group II to the Fifth Assessment Report of the Intergovernmental Panel on Climate Change. (Cambridge University Press, Cambridge, United Kingdom and New York, NY, USA).
15. Hönisch, B. et al. The geological record of ocean acidification. Science 335, 1058–1063 (2012).
16. Kroeker, K. J. et al. Impacts of ocean acidification on marine organisms: quantifying sensitivities and interaction with warming. Glob. Change Biol. 19, 1884–1896 (2013).
17. Gazeau, F. et al. Impacts of ocean acidification on marine shelled molluscs. Mar. Biol. 160, 2207–2245 (2013).
18. Thomsen, J., Haynert, K., Wegner, K. M. & Melzner, F. Impact of seawater carbonate chemistry on the calcification of marine bivalves. Biogeosciences 12, 4209–4220 (2015).
19. Kurihara, H. Effects of CO2-driven ocean acidification on the early developmental stages of invertebrates. Mar. Ecol. Prog. Ser. 373, 275–284 (2008).
20. Ventura, A., Schulz, S. & Dupont, S. Maintained larval growth in mussel larvae exposed to acidified under-saturated seawater. Sci. Rep. 6, 23728 (2016).
21. Kapsenberg, L. et al. Ocean pHfluctuations affect mussel larvae at key developmental transitions. Proc. R. Soc. B Biol. Sci. 285, 20182381 (2018). 22. Melzner, F. et al. Future ocean acidification will be amplified by hypoxia in
coastal habitats. Mar. Biol. 160, 1875–1888 (2013).
23. Moreira, R. et al. RNA-Seq in Mytilus galloprovincialis: comparative transcriptomics and expression profiles among different tissues. BMC Genomics 16, 728 (2015).
24. Gazeau, F. et al. Impact of ocean acidification and warming on the Mediterranean mussel (Mytilus galloprovincialis). Front. Mar. Sci. 1, 1–12 (2014).
25. Waldbusser, G. G. et al. A developmental and energetic basis linking larval oyster shell formation to acidification sensitivity. Geophys. Res. Lett. 40, 2171–2176 (2013).
26. Waldbusser, G. G. et al. Saturation-state sensitivity of marine bivalve larvae to ocean acidification. Nat. Clim. Change 5, 273–280 (2015).
27. Melzner, F., Thomsen, J., Ramesh, K., Hu, M. Y. & Bleich, M. Mussel larvae modify calcifyingfluid carbonate chemistry to promote calcification. Nat. Commun. 8, 1709 (2017).
28. Launey, S. & Hedgecock, D. High genetic load in the Pacific Oyster Crassostrea gigas. Genetics 159, 255–265 (2001).
29. Pansch, C., Schaub, I., Havenhand, J. & Wahl, M. Habitat traits and food availability determine the response of marine invertebrates to ocean acidification. Glob. Change Biol. 20, 765–777 (2014).
30. Thomsen, J., Casties, I., Pansch, C., Körtzinger, A. & Melzner, F. Food availability outweighs ocean acidification effects in juvenile Mytilus edulis: laboratory andfield experiments. Glob. Change Biol. 19, 1017–1027 (2013). 31. Phillips, N. E. Effects of nutrition-mediated larval condition on juvenile
performance in a marine mussel. Ecology 83, 2562–2574 (2002).
32. Pettersen, A. K., Turchini, G. M., Jahangard, S., Ingram, B. A. & Sherman, C. D. H. Effects of different dietary microalgae on survival, growth, settlement and fatty acid composition of blue mussel (Mytilus galloprovincialis) larvae. Aquaculture 309, 115–124 (2010).
33. Carl, C., Poole, A. J., Williams, M. R. & Nys, Rde Where to settle—settlement preferences of Mytilus galloprovincialis and choice of habitat at a micro spatial scale. PLoS. ONE. 7, e52358 (2012).
34. Thomsen, J. et al. Naturally acidified habitat selects for ocean acidification–tolerant mussels. Sci. Adv. 3, e1602411 (2017).
35. Kingston, S. E., Martino, P., Melendy, M., Reed, F. A. & Carlon, D. B. Linking genotype to phenotype in a changing ocean: inferring the genomic architecture of a blue mussel stress response with genome-wide association. J. Evol. Biol. 31, 346–361 (2018).
36. Allen, J. D. Size-specific predation on marine invertebrate larvae. Biol. Bull. 214, 42–49 (2008).
37. Brennan Reid, S., Garrett April, D., Huber Kaitlin, E., Heidi, Hargarten & Pespeni Melissa, H. Rare genetic variation and balanced polymorphisms are important for survival in global change conditions. Proc. R. Soc. B Biol. Sci. 286, 20190943 (2019).
38. Wittmann, M. J., Bergland, A. O., Feldman, M. W., Schmidt, P. S. & Petrov, D. A. Seasonallyfluctuating selection can maintain polymorphism at many loci via segregation lift. Proc. Natl Acad. Sci. 114, E9932–E9941 (2017). 39. Paaby, A. B. & Rockman, M. V. Cryptic genetic variation: evolution’s hidden
substrate. Nat. Rev. Genet. 15, 247–258 (2014).
40. Feder, M. E. & Hofmann, G. E. Heat-shock proteins, molecular chaperones, and the stress response: evolutionary and ecological physiology. Annu. Rev. Physiol. 61, 243–282 (1999).
41. Cummings, V. et al. Ocean acidification at high latitudes: potential effects on functioning of the antarctic bivalve laternula elliptica. PLoS. ONE. 6, e16069 (2011).
42. Arivalagan, J. et al. Insights from the shell proteome: biomineralization to adaptation. Mol. Biol. Evol. 34, 66–77 (2017).
43. Zhang, C., Xie, L., Huang, J., Chen, L. & Zhang, R. A novel putative tyrosinase involved in periostracum formation from the pearl oyster (Pinctada fucata). Biochem. Biophys. Res. Commun. 342, 632–639 (2006).
44. Huan, P., Liu, G., Wang, H. & Liu, B. Identification of a tyrosinase gene potentially involved in early larval shell biogenesis of the Pacific oyster Crassostrea gigas. Dev. Genes. Evol. 223, 389–394 (2013).
45. Yang, B. et al. Functional analysis of a tyrosinase gene involved in early larval shell biogenesis in Crassostrea angulata and its response to ocean acidification. Comp. Biochem. Physiol. B Biochem. Mol. Biol.https://doi.org/10.1016/j. cbpb.2017.01.006.
46. Johnson, K. M. & Hofmann, G. E. Transcriptomic response of the Antarctic pteropod Limacina helicina antarctica to ocean acidification. BMC Genom. 18, 812 (2017).
47. Hüning, A. K. et al. Impacts of seawater acidification on mantle gene expression patterns of the Baltic Sea blue mussel: implications for shell formation and energy metabolism. Mar. Biol. 160, 1845–1861 (2012). 48. Turner, J. R. G. & Williamson, M. H. Population size, natural selection and the
genetic load. Nature 218, 700 (1968).
49. Plough, L. V., Shin, G. & Hedgecock, D. Genetic inviability is a major driver of type III survivorship in experimental families of a highly fecund marine bivalve. Mol. Ecol. 25, 895–910 (2016).
50. Romiguier, J. et al. Comparative population genomics in animals uncovers the determinants of genetic diversity. Nature 515, 261–263 (2014).
51. Lewontin, R. C. & Hubby, J. L. A molecular approach to the study of genic heterozygosity in natural populations. II. amount of variation and degree of heterozygosity in natural populations of DROSOPHILA PSEUDOOBSCURA. Genetics 54, 595–609 (1966).
52. Kapsenberg, L. et al. Advancing ocean acidification biology using durafet®pH
electrodes. Front. Mar. Sci. 4, 1–9 (2017).
53. Dickson, A. G., Sabine, C. L. & Christian, J. R. Guide to best practices for ocean CO2measurements. (PICES Special Publication, 2007).
54. Gattuso, J.-P., Epitalon, J.-M., and Lavigne, H. Seacarb: Seawater Carbonate Chemistry. R package version 3.1.1https://cran.r-project.org/package= seacarb(2016).
55. Lueker, T. J., Dickson, A. G. & Keeling, C. D. Ocean pCO2 calculated from dissolved inorganic carbon, alkalinity, and equations for K1 and K2: validation based on laboratory measurements of CO2 in gas and seawater at equilibrium. Mar. Chem. 70, 105–119 (2000).
56. Perez, F. F. & Fraga, F. The pH measurements in seawater on the NBS scale. Mar. Chem. 21, 315–327 (1987).
57. Dickson, A. G. Standard potential of the reaction: AgCl(s)+ 12H2(g) = Ag(s) + HCl(aq), and and the standard acidity constant of the ion HSO4− in synthetic sea water from 273.15 to 318.15 K. J. Chem. Thermodyn. 22, 113–127 (1990).
58. Cosart, T. et al. Exome-wide DNA capture and next generation sequencing in domestic and wild species. BMC Genomics 12, 347 (2011).
59. Bolger, A. M., Lohse, M. & Usadel, B. Trimmomatic: aflexible trimmer for Illumina sequence data. Bioinforma. Oxf. Engl. 30, 2114–2120 (2014). 60. Langmead, B. & Salzberg, S. L. Fast gapped-read alignment with Bowtie 2. Nat.
Methods 9, 357–359 (2012).
61. Van der Auwera, G. A. et al. From FastQ data to high confidence variant calls: the genome analysis toolkit best practices pipeline. Curr. Protoc. Bioinforma. 43, 11.10.1–33 (2013).
62. Danecek, P. et al. The variant call format and VCFtools. Bioinformatics 27, 2156–2158 (2011).
63. Kofler, R. et al. PoPoolation: a toolbox for population genetic analysis of next generation sequencing data from pooled individuals. PLoS. ONE. 6, e15925 (2011).
64. Storey, J. D., Bass, A. J., Dabney, A. & Robinson, D. qvalue: Q-value estimation for false discovery rate control. R package version 2.18.0,http://github.com/ jdstorey/qvalue(2019).
65. Hivert, V., Leblois, R., Petit, E. J., Gautier, M. & Vitalis, R. Measuring genetic differentiation from pool-seq data. Genetics 210, 315–330 (2018).
66. Mallet, A. L., Zouros, E., Gartner-Kepkay, K. E., Freeman, K. R. & Dickie, L. M. Larval viability and heterozygote deficiency in populations of marine