HAL Id: inserm-00131795
https://www.hal.inserm.fr/inserm-00131795
Submitted on 27 Mar 2010
HAL is a multi-disciplinary open access archive for the deposit and dissemination of sci-entific research documents, whether they are pub-lished or not. The documents may come from teaching and research institutions in France or abroad, or from public or private research centers.
L’archive ouverte pluridisciplinaire HAL, est destinée au dépôt et à la diffusion de documents scientifiques de niveau recherche, publiés ou non, émanant des établissements d’enseignement et de recherche français ou étrangers, des laboratoires publics ou privés.
Distributed under a Creative Commons Attribution - NonCommercial - NoDerivatives| 4.0 International License
and constancy.
Gaël Obein, Kenneth Knoblauch, Françoise Viénot
To cite this version:
Gaël Obein, Kenneth Knoblauch, Françoise Viénot. Difference scaling of gloss: nonlinearity, binocu-larity, and constancy.. Journal of vision (Charlottesville, Va.), ARVO Journals, 2004, 4 (9), pp.711-20. �10.1167/4.9.4�. �inserm-00131795�
Journal of Vision (2004) 4, 711-720 http://journalofvision.org/4/9/4/ 711
Difference scaling of gloss:
Nonlinearity, binocularity, and constancy
Gaël Obein
Centre de Recherches sur la Conservation des Documents Graphiques, CNRS FRE 2743 – Muséum National d’Histoire Naturelle, Paris, France
Kenneth Knoblauch
Inserm U371, Cerveau et Vision, IFR 19 Institut Fédératif des Neurosciences, Université Claude Bernard Lyon 1, Bron, France
Françoise Viénot
Centre de Recherches sur la Conservation des Documents Graphiques CNRS FRE 2743 – Muséum National d’Histoire Naturelle, Paris, France
Gloss is an attribute of visual appearance that originates from the geometrical distribution of the light reflected by the surface. We used the maximum likelihood difference scaling (MLDS) procedure (L. T. Maloney & J. N. Yang, 2003) to estimate gloss scales over an extended range. Observers’ judgments were obtained for a series of 10 black, coated samples for two directions of illumination, in binocular and monocular vision. The results showed a nonlinear relation between gloss percept and instrumental specular gloss values. Sensitivity is higher at extreme scale values than in the middle. In binocular vision, the sensitivity to gloss is higher than in monocular vision exclusively for high gloss levels. Lastly, we found that gloss difference scales, when expressed in terms of the samples rather than the photometric characteristics, vary little with the direction of illumination. Gloss scaling thus seems to be independent of the geometrical variations of the luminous flux at the surface of the sample. By analogy with the term “color constancy,” we call this property “gloss constancy.”
Keywords: gloss, visual scaling, binocular vision, constancy
Introduction
Objects that have identical shapes can be identified through surface visual attributes, such as color, texture, transparency, and gloss (Chubb, Olzak, & Derrington,
2001; Christie, 1986). Of these, gloss has received the least attention, possibly because of the difficulties, until recently, of easily and adequately measuring and specifying the stimulus cues that generate this phenomenon. In 1984, the CIE introduced a major change in the definition of gloss. Gloss is “the mode of appearance by which reflected high-lights of objects are perceived as superimposed on the face due to the directionally selective properties of that sur-face” (CIE, 1987). Thus, gloss is no longer considered as a purely physical property of the material and is clearly de-fined as a visual percept, a visual quantity associated with surfaces consequent to their geometrical properties.
Glossiness is a ubiquitous characteristic of surfaces in the natural world, and recent studies have emphasized its significance in surface perception and color constancy (D’Zmura & Lennie, 1986). Given that gloss is a perceptual attribute, a full characterization of it will depend on both the particularities of the visual response to gloss and the underlying physics of the phenomenon. Indeed, the rela-tion between the physical stimulus and perceived gloss is
complex and not well understood. The aim of the present study is to quantify several aspects of the perception of gloss in relation to the physical stimulus.
From the physicist’s viewpoint, gloss originates from an uneven geometrical light distribution reflected by the sur-face of an object, with an increased flux in the specular di-rection. In a seminal work that has had considerable influ-ence on the design of industrial gloss measuring devices, Hunter (1975) described six types of gloss that he associated with different aspects of the interaction of surface geometry and light. Unfortunately, there is a tendency to confuse his terms, which are descriptions of the appearance of gloss, with the physical conditions which yield these descriptions. For example, devices to measure what he referred to as specular gloss, called “glossmeters,” have been standardized (ISO 2813, 1978) and are widely used in industry. Never-theless, the limits of this measure have been recognized for a long time (Harrison, 1945), and the tendency today is to exploit the bi-directional reflectance distribution function (BRDF). The BRDF, however, is a function of five vari-ables, and measuring it remains a difficult and time-consuming task.
From a perceptual viewpoint, gloss is a qualitative ap-praisal, often ill-defined, because the different physical sources described by Hunter result in different types of
gloss (e.g., contrast gloss, distinctness of image, etc.) (Hunter, 1975). While BRDF measurements have become more rapid, thanks to their widespread applications in digi-tal imagery, very few psychophysical studies have been car-ried out to quantify gloss.
Early studies by Hunter and Judd (1939) and Harrison and Poulter (1951) demonstrated that gloss perception de-pends not only on the quantity of light reflected in the specular direction, but also on the width of the specular peak. These authors recognized the multi-dimensional na-ture of gloss and the necessity of goniophotometric or BRDF measurements to characterize it adequately. Never-theless, Billmeyer and O’Donnell (1987), in a study to ex-amine the perceptual dimensions of gloss, found one di-mension to be sufficient to describe visual evaluations. In a multidimensional analysis of visual judgments on several limited series, they found the second dimension to be non-significant. In contrast, Ferwerda, Pellacini, and Greenberg (2001), using digital images of balls presented in a realistic virtual environment and using a three-variable BRDF algo-rithm, found the appearance of gloss to require two dimen-sions. One of these dimensions seems to be similar to the “contrast gloss” and the second to the “distinctness of im-age,” described by Hunter.
These previous studies indicate that the appearance of gloss depends not only on the specular luminous flux but also on the particular shape of the specular peak of the re-flected light. Studies of the BRDF of surfaces (Glassner,
1995) indicate that the size and shape of the specular peak depend on the roughness of the surface, the refractive in-dex of the material, and the direction of illumination (see
Figure 2). Thus, we can ask how these factors influence the perception of gloss. In addition, the interaction of these factors with the direction of view suggests that perceived gloss may differ under monocular and binocular viewing (Harrison, 1945), a possibility that has been little studied (Czepluch, 1976). In the present study, we examine the relation of perceived gloss to the specular gloss and evaluate the influence of the direction of illumination and binocu-larity on this percept.
Equipment
A light booth was designed specifically for the experi-ment that allows precise positioning of the sample, the light source, and the observer.
Samples and specular gloss
We used a custom-prepared gloss series (3C Conseil), composed of 10 items of A6 (15 x 10.5 cm) black coated paper. The size of the samples was chosen according to the ASTM D4449 norm (ASTM D4449, 1990) that recom-mends using surface sizes from 7 to 30 cm wide and 14 to 40 cm long for visual examination.
The measurement of specular gloss for nonmetallic sur-faces has been standardized for three particular incident
angles (60°, 20°, and 85°). The specular gloss, expressed in gloss unit (gu), is given by the ratio of the flux reflected, in a given diaphragm centered on the specular direction at the surface of the sample to the flux reflected, in the same con-ditions, at the surface of a standard. The standard is com-monly a piece of polished black glass having a refractive index n = 1.567 (Budde, 1980). Specular gloss measure-ments at 60° were made using a Zethner glossmeter on the samples from four sets of the series to control isotropy and homogeneity of the samples. The specular gloss values measured from the series at 60° range from 1 to 90 gloss units (gu), as reported in Table 1. Specular gloss values did not vary significantly from one set to another. Isotropy was assessed for each of the samples of the four sets by measur-ing specular gloss at five different positions. The variances of these measures are also listed in Table 1.
Sample gloss at 60°Specular mean value Specular gloss at 60° variance Specular gloss at 20° mean value Specular gloss at 20° variance N001 90.9 0.5 63.3 1.7 N002 75.9 0.7 34.2 1.0 N003 61.6 1.2 23.0 0.3 N004 51.3 1.0 13.2 0.4 N005 47.2 1.4 11.0 0.3 N006 36.0 1.1 6.1 0.2 N007 24.5 0.7 3.1 0.04 N008 11.8 0.4 1.5 0.05 N009 4.6 0.1 0.8 0 N010 1.3 0.1 0.5 0.05 Table 1. Specular gloss value of the samples of the gloss scale. Average of 20 measurements.
Table 1 also shows that the values of specular gloss measured at 20° differ systematically from those collected at 60°. These values were found to range from 0.6 to 66.3 gu, with a considerably expanded scale for high glossy samples. Standarization is often performed with reference to the specular gloss at 60. This choice has posed difficulties in defining a meaningful gloss scale, in that industrial stan-dards recommend variously one scale or the other to quan-tify matte or glossy samples without specifying what the link is between the two scales.
We have intentionally restricted our study to the quan-tification of the visual perception of gloss for a series of black samples, although we recognize that the surface color may be taken into account by the visual system to construct the gloss sensation (Ng et al., 2003; Mikula, Ceppan, & Vasko, 2003). The advantage of using black samples is that it is primarily the surface reflection that is responsible for highlights perceived as superimposed on the surface. In the case of black samples, volume diffusion being absent, the observation of the highlights due to the surface reflection prevails. For this reason, black samples allow us to study accurately the sensitivity of the visual system to luminous variations linked to surface reflection.
Journal of Vision (2004) 4, 711-720 Obein, Knoblauch, & Viénot 713
Light booth
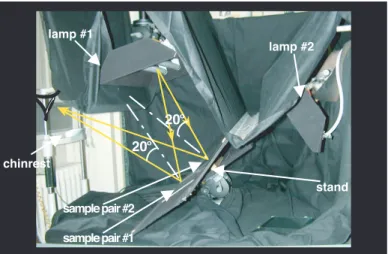
l stand sample pair #1 sample pair #2 chinrest 20º 20º lamp #2 lamp #1Figure 1. Side view of the booth built for gloss observations. Set up for illumination and observation at 20°. Light path is high-lighted in yellow. Lamp #2 is prepared for illumination and obser-vation at 60°, when the sample stand is in appropriate position. The two lamps and the stand are mounted on rotation and trans-lation systems to allow an architecture of 5 and 4 deg of free-dom, respectively. The booth is 1m x 1m x 1m. Black curtains allow the isolation of the booth from straylight. The light origi-nates from two fluorescent tubes (15 W, 450-mm long) that illu-minate several samples. The tubes have been set up according to the ASTM D4449-90 standard recommendations.
The booth is composed of a structure that allows con-trol of the surroundings, a dedicated light, and support to manage the geometrical conditions of illumination and viewing. The design of the light booth was inspired by the ASTM D4449 (ASTM D4449, 1990) standard, which rec-ommends a method for visual evaluation of gloss differ-ences between surfaces of similar appearance.
The lamp housing is fixed on a system that offers 5 deg of freedom (x, y, z, θ, and φ). The prop allows free and ac-curate positioning of the samples between the lamp and the observer. According to the angular configuration tested, it can be moved and tilted in the booth. Moreover, so that all the samples are seen in the same situation by observers, it was essential to ensure a fixed angle between pairs (see
Figure 1). The observer’s head was fixed by a chin-rest, which guaranteed that the visual direction was in the specu-lar direction.
Experimental protocol
Maximum likelihood difference scaling
We used the technique of maximum likelihood differ-ence scaling (MLDS) (Maloney & Yang, 2003) to estimate the evolution of perceived gloss as a function of the 10 samples of our gloss series. MLDS has been demonstrated to be a robust and reliable technique for estimating under-lying perceptual scales. For example, it has been successfully applied in quantifying color differences along a line in tris-timulus space (Maloney & Yang, 2003) and also for quanti-fying the perceived distortion of an image as a function of compression (Knoblauch, Charrier, Cherifi, Yang, & Ma-loney, 1998).
In this procedure, an ordered sequence of four surfaces, i, j, k, and l, is sampled from the full set. These are presented to the observer as two pairs, (i, j), (k, l), one pair chosen randomly to be placed above the other. The observer’s task is to select the pair whose elements display the greater difference in appearance. If the pair (i, j) is selected, the quadruplet is assigned the value R = 0, otherwise R = 1. With a collection of N stimuli, it is possible to present N!/((4)!(N – 4)!) paired-comparisons. For example, for a collection of 10 samples, 210 non-overlapping quadruplets can be formed.
It is assumed that each of the 4 stimuli, i, j, k, and l, generate in the observer a response indicated as ψi, ψj, ψk,
and ψl, respectively. These perceptual values are unknown,
but it is supposed that they satisfy
|ψi − ψj | > |ψk − ψl | (1)
if and only if the pair (i, j) is judged to display a greater dif-ference between its elements than the pair (k, l).
To estimate the underlying perceptual scale, it is as-sumed that the observer bases his judgments on a decision
variable, ∆, computed from the underlying sensory re-sponses to each of the physical samples as
∆ = |ψi − ψj | - |ψk − ψl | . (2) When ∆ > 0, the observer selects the pair (i, j), other-wise the other pair. The MLDS procedure permits the es-timation of a perceptual scale that predicts the relative magnitudes of differences between pairs. With ψ0 and
ψ9 fixed at values of 0 and 1, respectively, the values ψi, i = 1 – 8 are estimated by maximizing the likelihood,
(
)
1(
(
)
1 / 2 q 1 / 2 q N R R q q q L s − s =)
= Φ ∆ − Φ ∆ ∏
(3)where Φ is the cumulative normal distribution function, q = ijkl and s is the standard deviation of the observer’s judgments. Including the value of s, 9 parameters in total are estimated based on the 210 judgments. In practice, the logarithm of the likelihood is computed and its negative minimized. All calculations were performed in the Matlab computing environment.
The log likelihood was subsequently used to test differ-ences between the estimated scales for different conditions using a nested hypothesis test (Hoel, 1984). In short, the log likelihoods were compared under two hypotheses, that a single perceptual scale sufficed to describe both condi-tions (9 parameters) or that a different perceptual scale was necessary for each condition (m × 9 parameters, where m is the number of conditions). The test can be described as
χ2 = 2 (l
20º 40º 60º 0º -20º -40º -60º -80º 20º 40º 60º 0º -20º -40º -60º -80º reflection angle reflection angle 0 60 120 0 600 1200 cd m. -2 cd m. -2
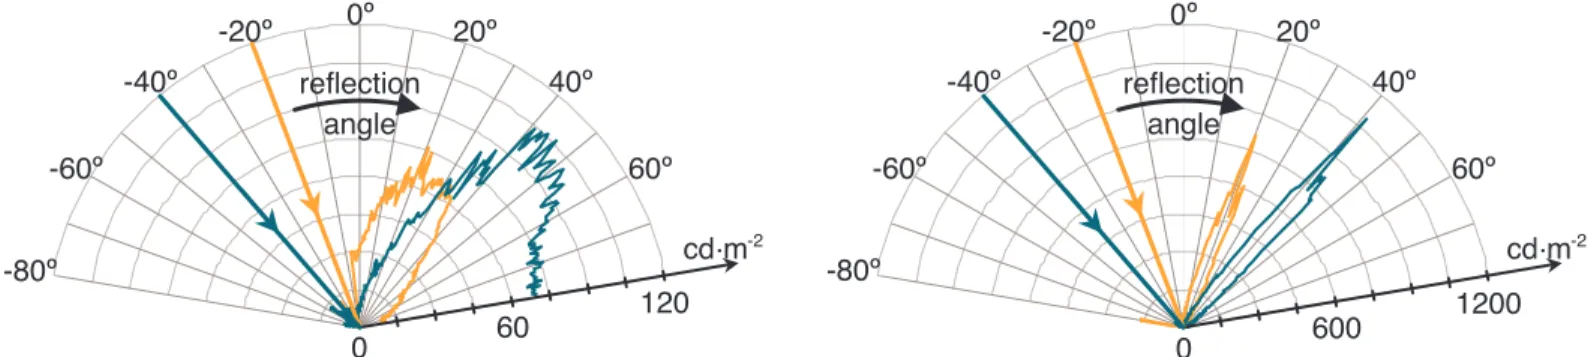
Figure 2. Sections of the BRDF in the plane of incidence. Left; sample N009 (4.6 gu). Right; sample N007 (24.5 gu). Orange, incident angle of 20°; green, incident angle of 40°. The shape of the peak varies according to the level of specular gloss and the incident angle (measurements made with the EZ Contrast device [ELDIM]).
where li is the log likelihood under the hypothesis of a sin-gle perceptual scale, i = 0, or multiple perceptual scales, i = 1, and the difference is distributed as χ2 with 9 (m − 1)
deg of freedom.
Experiments
Six observers completed the experiments. All had bet-ter than 12/10 corrected visual acuity.
The goal of these experiments is to quantify gloss to be able to relate the perception of gloss and the reflection of light at the surface of the material. The geometrical distri-bution of the light reflected at the surface is completely described by the BRDF. For black surfaces, for which there is no volume diffusion, the BRDF contains a unique peak called the specular peak (Figure 2). The height and shape of this peak depend on both intrinsic parameters of the sur-face and on the direction of illumination (Obein, Leroux, & Viénot, 2000). We study the evolution of the perception of gloss in conditions where the surface finish, the direc-tions of illumination, and observation are controlled.
The sensitivity of the visual system to intrinsic parame-ters of gloss was tested in each experiment by estimating the perceptual scale for the 10 samples of the gloss series. The “gloss difference scale” is obtained by presenting 210 dif-ferent quadruplets to the observer. The samples are fixed on two sliding boards. Each board contains five adjacent samples.
The operator slides the boards in front of the observer (Figure 3). Two boards of five samples shifted in parallel behind a window allow the observer to perform four com-parisons. The sequence of the quadruplets on the boards was predetermined according to a randomization proce-dure. At the beginning of each session, the starting board is chosen at random. The boards are then presented in their numbered order.
While the system of boards enables us to save time, the sequence is not entirely random. From the notation of
Figure 3, it can be seen that quadruplet B always falls be-tween A and C. In addition, A and B always have two common samples. For each configuration, four repetitions
were performed to allow repeatability to be tested. These repetitions also permit a further randomization. The boards presented at the top in session one are moved to the bot-tom in session two. This procedure is repeated in sessions three and four, but furthermore, the boards are rotated by 180°. After the four sessions, an observer has made 840 judgments based on 4 x 210 quadruplets, none of which are presented in the same configuration.
Responses of the observers were hand-recorded by the operator. A session lasted about 45 min. For each quadru-plet, the observer responded to the question, “Which pair exhibits the larger difference?” The observer was permitted to reconsider his decision after having responded. Re-sponse time was neither limited nor recorded. The MLDS method was used to estimate a gloss difference scale based on the observer’s responses. The scale was fixed at 0 for the most matte and 1 for the glossiest samples.
We tested the influence of the direction of illumina-tion by using two different angles of incidence of the light on the samples: 20° and 60°. These two values were chosen
Figure 3. An observer performing the experiment. Observer judges double pair B. Two boards of five samples are presented. The experimenter shifts the boards in front of the observer. The observer judges successively quadruplets A, B, C, and D. Two boards allow the observer to make four paired-comparisons, four by four.
Journal of Vision (2004) 4, 711-720 Obein, Knoblauch, & Viénot 715
to match standard specular gloss measurements at 20° and 60°. To test the hypothesis that binocular vision plays a role in gloss perception, judgments at 20° and 60° incident light were carried out under both binocular and monocular conditions. Monocular tests were performed using the dominant eye.
Results and discussion
In brief, visual observations were obtained for four dif-ferent configurations: 20°/binocular (20B), 20°/monocular (20M), 60°/binocular (60B), and 60°/monocular (60M). For each configuration, four repetitions were performed to test statistical repeatability and to improve accuracy of the gloss difference scales obtained.
The evolution of the gloss sensation for 60°
specular gloss
The estimated perceptual gloss scales in binocular vi-sion at 60° incident illumination angle (60B configuration) for six observers are shown in Figure 4. In this configura-tion, observers are in the same position as the detector of the glossmeter.
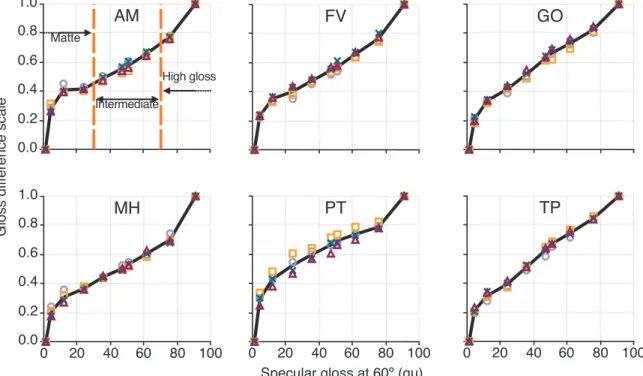
For all observers, perceived gloss increases monotoni-cally with the specular gloss values. Nevertheless, the rela-tion is nonlinear. The curves seem to display three seg-ments, which we have named matte, intermediate, and high gloss (Figure 4a).
Over the matte region, less than 30 gu, the slope and, thus, the visual sensitivity to changes in gloss unit (gu) are
very high. When these samples are viewed in the specular direction, the highlight seems to fill the whole surface. The samples in the matte region mimic grey samples that would become lighter as the gloss index increases. This observa-tion could explain why the curve over the matte region fol-lows a shape similar to that of the lightness response curve of the human observer (Wyszecki & Stiles, 1982).
In the high gloss region, over 70 gu, the slope of the visual response also increases steeply. In this region, the image of the source is clearly visible, and the observer can judge the distinctness of the image (DOI) of the fluorescent tubes. Note that the slope in this region seems to vary be-tween observers.
In the intermediate range, between 30 and 70 gu, the visual response is almost linear and the sensitivity is at its lowest value. This section can be considered either as the junction between two domains, or perhaps as a domain by itself. It is possible that the observer identifies the images of the two tubes and bases his judgment on the spatial con-trast between the highlights and the background.
The profiles obtained are similar to the ASTM D523 (ASTM D523, 1989). The compression in the matte region agrees with the one-third exponent proposed by Ferwerda et al. (2001). With one exception, our results agree with those in the literature based on other scaling techniques. For example, Hunter and Judd (1939) and Harrison and Poulter (1951) asked subjects to arrange sets of closely spaced glossy samples in order. They obtained scales based on the average ranks across observers. The idea is that over a range for which perceived gloss changes slowly, there will 1.0 0.6 0.8 0.4 0.2 0.0 AM FV GO 0 20 40 60 80 100 TP 0 20 40 60 80 100 Specular gloss at 60º (gu)
PT 1.0 0.6 0.8 0.4 0.2 0.0 0 20 40 60 80 100 Gloss dif ference scale MH Matte Intermediate High gloss
Figure 4. Gloss difference scales of 6 observers. Configuration 60B (incidence 60°, binocular vision). Each color represents the result from one session, calculated from 210 paired-comparisons. The curve represents the scale calculated from the 4 x 210 = 840 judg-ments. The three proposed subdivisions, matte, intermediate, and high gloss, are indicated on the first graph.
1.0 0.6 0.8 0.4 0.2 0.1 1 10 100 Gloss dif ference scale FV
Specular gloss at 60º (gu)
AM TP 0.1 1 10 100 0.1 1 10 100 FV60Bx FV20Bx AM60Bx AM20Bx TP60Bx TP20Bx
Figure 5. Gloss difference scales obtained by three observers with 60° geometry (orange symbols) and 20° geometry (blue symbols). The abscissa represents specular gloss (log scale) readings on a calibrated glossmeter.
be more differences between observers in the assigned ranks. In this case, the means across these levels will be similar, whereas when gloss changes rapidly, there will be fewer individual differences and the ranks will change more rapidly.
When normalized between 0 and 1, Judd and Hunter’s scale resembles ours. Harrison and Poulter did not test matte surfaces, but their results resemble ours in the inter-mediate domain. In contrast, our gloss scales differ consid-erably from those obtained by Billmeyer and O’Donnell (1987). They speculate that the peculiar curvature in their data can be attributed to their psychophysical method which employed anchor-pairs as comparisons.
MLDS gives equal weight to each sample. In addition, scales are obtained on individual observers, permitting the study of individual differences.
The results of Ferwerda et al. were based on synthesized images and a model of surface reflectance. This approach should be viewed as complementary to ours based on real stimuli. While our approach does not provide the flexibility offered by digital imagery (Fleming, Dror, & Adelson,
2003) to generate and present stimuli, the responses, based on real stimuli, do not depend on a specific BRDF algorithm nor were our stimuli limited by the gamut of the display.
Influence of the direction of illumination on the perception of gloss
Gloss scales were obtained for samples illuminated and viewed from two different directions, 20° and 60°. The gloss difference scales obtained by three observers, using binocular vision for these two viewing conditions, are plot-ted in Figure 5 as a function of the specular gloss measured for each respective geometrical configuration.
At first glance, the curves for the two viewing angles appear to evolve differently as a function of specular gloss. The differences in shape might be taken to suggest that observers scale gloss differently for the two different con-figurations. The non-monotonic change in the lateral sepa-ration of the curves, however, is governed by the values in
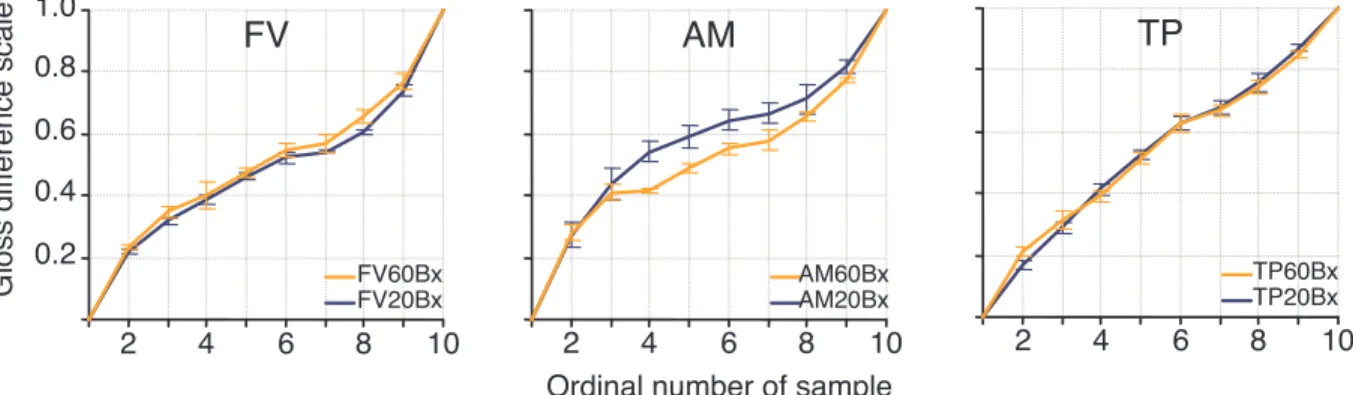
Table 1. Observers, in fact, scale the stimuli from the two configurations in a remarkably similar fashion, as illus-trated in Figure 6, in which the scale values are replotted in terms of the physical sample numbers rather than their physical characteristics. Similar results were found for all observers.
Such an apparent gloss constancy would be under-standable if the change of viewing geometry scaled the specular gloss by a constant. In that case, a simple normali-zation by the maximum specular gloss with a scaling by the
TP
Ordinal number of sample
AM
1.0 0.6 0.8 0.4 0.2 2 4 6 8 10 Gloss dif ference scaleFV
2 4 6 8 10 2 4 6 8 10 TP60Bx TP20Bx AM60Bx AM20Bx FV60Bx FV20BxFigure 6. Gloss difference scales obtained by three observers with 60° geometry (orange symbols) and 20° geometry (blue symbols). The abscissa indicates the ordinal number of sample in the series.
Journal of Vision (2004) 4, 711-720 Obein, Knoblauch, & Viénot 717
range of gloss values would produce identical scales. The complex change in specular gloss with viewing angle would prevent such a rescaling strategy from being effective (even before considering the nature of a mechanism capable of performing such a transformation). Replotting the data as a function of the absolute luminance of the specular peak does not account for the differences in the scales, either.
The results suggest that observers integrate information from sources other than the luminous flux reflected by the samples because the flux varies significantly when the inci-dent angle is modified, yet observers classify samples with respect to each other similarly, independently of the inci-dent angle. In other words, observers behave as if they were sensitive to intrinsic parameters of the samples.
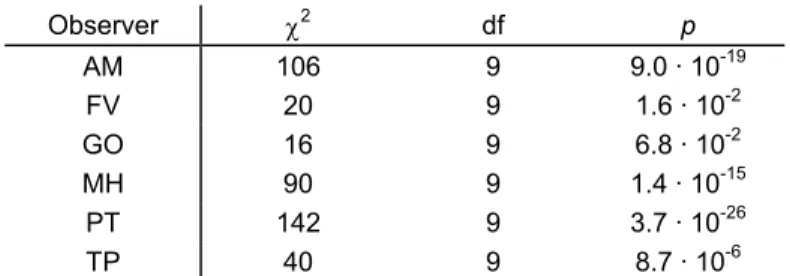
We tested whether a single scale would suffice to de-scribe the scales obtained for the two viewing configura-tions. The results shown in Table 2 reject this strong hy-pothesis for four of the observers at a level p < .001. Never-theless, the similarity of the scales with viewing condition given the differences in the physical stimuli, from Table 1, is striking. Thus, in what follows, we will plot the visual gloss judgments as a function of the specular gloss meas-urements at 60°, even if the judgments were obtained at 20°.
From the definition of color constancy to the
definition of gloss constancy
In everyday life, the spectral distributions of light that illuminate our environment continually vary. We breakfast in winter under incandescent lamps; we travel in daylight and work under fluorescent tubes. Changes in the illumi-nant light spectrum modify the trichromatic values of the light reaching our eyes from surfaces. Both the physical and the colorimetric specifications change. Nevertheless, the colors of the objects around us appear invariable. The phe-nomenon of “color constancy” has long been known. Helmholz proposed in the 19th century that our perception of color is performed by inferring the illumination (Helm-holtz, 1867/1962). Recent studies have focused on analyz-ing the mechanisms mediatanalyz-ing color constancy (Brainard & Wandell, 1986; Maloney & Wandell, 1986; Viénot, 1998).
Our results demonstrate that the gloss difference scales obtained in the 60° and 20° configurations are nearly iden-tical. Thus, although the reflected luminous flux varies con-siderably from one geometry to another, it seems that the visual system compensates for these variations (Obein, Knoblauch, Chrisment, & Viénot, 2002). Our results pro-vide epro-vidence for “gloss constancy,” a property that is in the geometrical domain analogous to “color constancy” in the spectral domain. As an observer is able to assign a color to a sample in spite of the variations of the spectral distribution of the light, he evaluates differences in gloss level between a pair of samples similarly, in spite of the variations of the geometrical distribution of the light. This phenomenon was already alluded to in a study by Nishida and Shinya (1998) on the ability to recover surface reflectance properties from shading patterns of surfaces and by Fleming et al. (2003) in their work on human surface reflectance estimation accord-ing to the statistics of illumination. Both used images dis-played on a CRT. Nishida and Shinya suggest that observ-ers obtain constancy on the basis of similarities in the sur-face luminance histogram across viewing angles, while Fleming et al. propose that constancy requires “typical” real world statistics of the illumination. Our findings using real surfaces, for which the surface luminance distributions are not limited by the gamut of the display and for which the changes are complex with direction (as shown in
Figure 2), complement these earlier studies that exploited simulated images on a CRT.
χ2
In a world in which the stimulus for vision is con-stantly in flux and subject to multiple interpretations, gloss constancy mechanisms would play a similar role as that of other constancy mechanisms, to compensate for these variations in the construction of a stable and coherent rep-resentation of the surround world (Blake & Bulthoff, 1990; Le Rohellec, 1999).
Influence of binocular vision on the
percep-tion of gloss
The contribution of binocular vision to gloss perception has frequently been raised in the literature. A classic hy-pothesis is that retinal disparity plays a role in the percep-tion of gloss (Harrisson, 1945; Czepluch, 1976; Seve,
1993). However, it is easy to verify that one can judge the gloss of a surface with one eye closed. Thus, to answer this question, it seems necessary to quantify accurately the evo-lution of gloss perception in binocular and monocular vi-sion.
Observations were collected at two angular configura-tions with binocular and monocular vision. Differences between the scales, thus, originate only from the mode of vision. Examples of the scales obtained are shown in
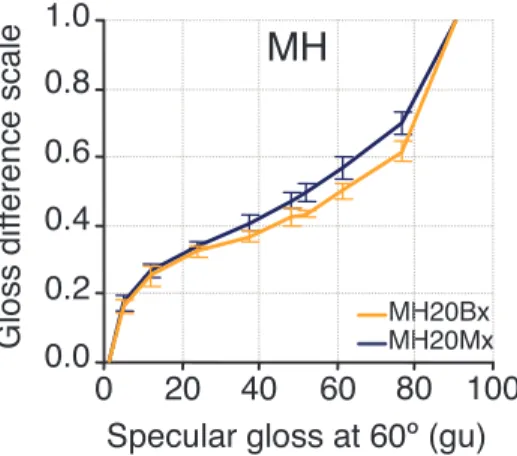
Figure 7. The monocular scale is positioned systematically above the binocular scale. The monocular curve rises more steeply than the binocular curve except between the highest two values. Such a result suggests that binocular factors play an important role mainly in the judgment of high gloss
val-Observer df p AM 106 9 9.0 · 10-19 FV 20 9 1.6 · 10-2 GO 16 9 6.8 · 10-2 MH 90 9 1.4 · 10-15 PT 142 9 3.7 · 10-26 TP 40 9 8.7 · 10-6
Table 2. Results of the test of the hypothesis that a single scale suffices to describe the scales obtained at 20° and 60° incident light. At a level p < .001, the hypothesis is rejected for four of the six observers.
ues [i.e., specular gloss (60°) value > 70 gu]. For such sam-ples, the image of the light source can be seen through the surface. The image of the source is localized precisely in the binocular situation because it is sampled by each eye from a different point of view, and under our viewing conditions, is fused. The impact of the image may, thus, be greater in binocular vision due to the contribution of stereoscopic depth cues. Observers have reported that to judge these highly glossy samples, their criterion is based on the DOI, or inversely, its loss of sharpness. Visually, this could lead to a change in performance, as indicated in Figure 7. This interpretation is consistent with our suggestion concerning the shape of the gloss scale: On very glossy samples, the judgment is based exclusively on the DOI.
Standard observer
By construction, the series of samples that we used was manufactured according to a controlled industrial process and permits a one-dimensional scaling only. Interestingly, due to gloss constancy, the observer discounts changes of illumination and viewing conditions and makes a unique gloss judgment. This allows a comparison between observ-ers, for all observations realized in a given mode of vision (binocular or monocular).
In Figure 8, we have plotted all gloss difference scales obtained in binocular vision. Although we have no expla-nation of the source of inter-observer variability, note that the reproducibility of each observer’s gloss scale is high. The gloss scales derived with our six observers, calculated from 10,080 paired-comparisons, show similar tendencies, thus opening the possibility of defining a simple one-dimensional gloss scale.
The gloss difference scale of the « mean » observer shows, as for each observer, an increasing sensitivity in the matte and in the high gloss domain, while minimizing in-ter-individual variations. The interpretation of the shape of this curve seems important. It accounts for the average
evo-lution of the gloss sensation with respect to a series of black gloss samples, that is with respect to the factor known as “surface reflection,” which is probably the most critical fac-tor for gloss sensation.
1.0 0.6 0.8 0.4 0.2 0 20 40 60
Specular gloss at 60º (gu)
Gloss dif ference scale
MH
MH20Bx MH20Mx 0.0 80 100Figure 7. Gloss difference scales obtained in binocular and mo-nocular vision, for the same observer: 20° configuration, with monocular vision (blue symbols) and binocular vision (orange symbols). The scales differ most at high values.
Plotted as a function of the specular gloss at 60°, the curve offers to manufacturers a link between the glossmeter measurement and the gloss sensation. Specular gloss being usually controlled, such a curve could be used to specify the design of a uniform gloss scale. Such a material scale could serve as a useful standard to quantify the gloss level of a surface according to its perceptual characteristics. Plotted according to other factors, necessarily intrinsic to the sur-face (because of the phenomenon of gloss constancy), such as the surface roughness or the refractive index, it would open the door to new studies for determining which pa-rameters are coded and integrated by the visual system to construct the sensation of gloss.
Conclusion
Using a psychophysical approach, we quantified the evolution of gloss perception along a particular gloss scale that presents 10 levels of specular gloss value approximately regularly distributed between 0 and 100 gloss units. Visual estimations were obtained in binocular and monocular vi-sion, and under two different directions of illumination (20° and 60°). We found that the relation between gloss sensation and specular gloss value is nonlinear. The human observer is more sensitive to variations in the matte and the high glossy regions. Comparison of gloss difference scales obtained in monocular and binocular modes of vision shows that the sensitivity of the observers is improved in binocular vision mainly for the judgment of very glossy samples. We hypothesize that observers use binocular indi-ces when the judgment can be assimilated to a DOI judg-ment. Gloss difference scales obtained under two different illuminations are very similar. This result indicates that in constructing the perception of gloss, the visual system is
1.0 0.6 0.8 0.4 0.2 0 20 40 60
Specular gloss at 60º (gu)
Gloss dif
ference scale
0.0
80 100
Figure 8. Gloss difference scales obtained in binocular vision, with respect to the specular gloss measured at 60°. All meas-urements from six observers at 20° and at 60° are drawn in light colors. Black curve: average gloss difference scale.
Journal of Vision (2004) 4, 711-720 Obein, Knoblauch, & Viénot 719
able to compensate for luminous flux variations due to a change in angle of illumination and to maintain an invari-able gloss percept, typical of the sample itself. In analogy with the term “color constancy,” this phenomenon could be called “gloss constancy.”
Specular highlights are thought to play an important role in color constancy. Several authors have hypothesized that highlights provide the reference stimuli on which color constancy computations are based (D’Zmura & Lennie,
1986; Yang & Maloney, 2001; Yang & Shevell, 2001; Yang & Shevell, 2003). Usually, images from computer graphics gain photorealism when gloss is accurately depicted. To display veridical images of the scene, the calculation of color at every point of the scene takes into account the ge-ometry of the light rays. Conversely, when the correspon-dence between color and light geometry is violated, an er-roneous color is attributed to objects (Bloj, Kersten, & Hurlbert, 1999).
To build a stable representation of the environment, numerous constancy mechanisms are required, including color and gloss constancy. Objects are recognized in part through their surfaces. Cues extracted from the luminance distribution of an image must be exploited for identifying surfaces. Coherence between indices related to color and gloss ought to be conserved as the spectral and geometrical distribution of the illumination is varied (Fleming et al.,
2003). If otherwise, it would likely interfere with the ro-bustness of surface recognition.
Acknowledgments
This research was partially supported by the Bureau National de Métrologie. Thanks to Alain Chrisment and staff from 3C Conseil, Marc Himbert, Jean Bastie, and col-leagues from BNM, and Thierry Leroux, Sébastien Morteau, Dominique Grellard, Vincent Leroux, and staff from ELDIM. Thanks to Jean Le Rohellec for pictures, and to observers from Paris XI Optometry School.
Commercial relationships: none. Correponding author: Gaël Obein. Email: [email protected].
Address: CRCDG, Muséum National d’Histoire Naturelle, 36, rue Geoffroy-Saint-Hilaire, 75005 Paris, France.
References
ASTM D4449–90 (1990). Standard test method for visual evaluation of gloss differences between surfaces of similar appearance. ASTM standards on color and ap-pearance measurement (6th ed.). West Conshohocken, PA: ASTM.
ASTM D523–89 (1989). Standard test method for specular gloss. ASTM standards on color and appearance measure-ment (6th ed.) West Conshohocken, PA: ASTM.
Billmeyer, F. W., & O’Donnell, F. X. D. (1987). Visual gloss scaling and multidimensional scaling analysis of painted specimens. Color Research and Application, 12(6), 315-326.
Blake, A., & Bülthoff, H. (1990). Does the brain know the physics of specular reflection? Nature, 343, 165-168. [PubMed]
Bloj, M. G., Kersten, D., & Hurlbert, A. C. (1999). Percep-tion of three-dimensional shape influences colour per-ception through mutual illumination. Nature, 402, 877-879. [PubMed]
Brainard, D. H., & Wandell, B. A. (1986). Analysis of the retinex theory of color vision. Journal of the Optical Society of America A, 3(10), 1651-1661. [PubMed] Budde, W. (1980). The calibration of gloss reference
stan-dards. Metrologia, 16, 89-93.
Christie, J. S. (1986). Evaluation of the attribute of appear-ance called gloss (Publication CIE 118/1). CIE-Journal, 5(2), 41-56.
Chubb, C., Olzak, L., & Derrington, A. (2001). Second-order processes in vision: Introduction. Journal of the Optical Society of America A, 18(9), 2175-2178. [PubMed]
Commission Internationale de l’Eclairage (1987). CIE In-ternational lighting vocabulary (4th ed.) (Publication CIE 17.4 - 1987). Paris: Bureau central de la CIE.
Czepluch, W. (1976). Zusammenhänge zwischen binokularer betrachtungsweise und visuellem glanzeindruck. Lichttechnik, 28, 16-18.
D’Zmura, M., & Lennie, P. (1986). Mechanisms of color constancy. Journal of the Optical Society of America A, 3(10), 1662-1672. [PubMed]
Ferwerda, J. A., Pellacini, F., & Greenberg, D. P. (2001). A psychophysically-based model of surface gloss percep-tion. Proceedings of SPIE, 4299, 291-301. [Article] Fleming, R. W., Dror, R. O., & Adelson, E. H. (2003).
Real-world illumination and the perception of surface reflectance properties. Journal of Vision, 3(5), 347-368, http://journalofvision.org/3/5/3/, doi:10.1167.3.5.3. [PubMed][Article]
Glassner, A. (1995). Principles of digital image synthesis (Vol. 2) . San Francisco: Morgan Kaufmann.
Harrison, V. G. W. (1945). Definition and measurement of gloss. Cambridge: W. Heffer & Sons.
Harrison, V., & Poulter, S. (1951). Gloss measurement of papers – the effect of luminance factor. British Journal of Applied Physics, 2, 92-97.
Helmholtz, H. (1962). Treatise on physiological optics (J. Southall, Trans.). New York, Dover. (Original work published 1867)
Hoel, P. (1984). Introduction to mathematical statistics (p. 215). New York: John Willey & Sons.
Hunter, R. S. (1975). The measurement of appearance (1st ed.). New York: John Wiley & Sons.
Hunter., R., & Judd, D. (1939). Development of a method of classifying paints according to gloss. ASTM Bulletin, March 1939, 11-18.
ISO 2813 (1978). Paint and varnishes: Measurement of the specular gloss of non-metallic paint films at 20°, 60° and 85°. Geneva: International Organization for Stan-dardization.
Knoblauch, K., Charrier, C., Cherifi, H., Yang, J. N., & Maloney, L. T. (1998). Difference scaling of image quality in compression-degraded images [Abstract]. Perception, 27(Suppl.), 174.
Le Rohellec, J. (1999). Les couleurs subjectives: L’illusion d’une illusion. Techne, 9/10, 139-152.
Maloney, L. T., & Wandell, B. A. (1986). Color constancy: A method for recovering surface spectral reflectance. Journal of the Optical Society of America A, 3(1), 29-33. [PubMed]
Maloney, L. T., & Yang, J. N. (2003). Maximum likelihood difference scaling. Journal of Vision, 3(8), 573-585, http://journalofvision.org/3/8/5/, doi:10.1167/3.8.5. [PubMed][Article]
Mikula, M., Ceppan, M., & Vasko, K. (2003). Gloss and goniocolorimetry of printed materials. Color Research and Application, 28(5), 335-342.
Ng, Y., Ziese, E., Mashtare, D., Kessler, J., Wang, J., Kuo, C., et al. (2003). Standardization of perceptual based gloss and gloss uniformity for printing systems. Proceed-ings of Fifth International Symposium on Multispectral Color Science, 88-93.
Nishida, S., & Shinya, M. (1998). Use of image-based in-formation judgments of surface-reflectance properties. Journal of the Optical Society of America A, 15(12), 2951- 2965. [PubMed]
Obein, G., Knoblauch, K., Chrisment, A., & Viénot, F. (2002). Perceptual scaling of the gloss of a one-dimensional series of painted black samples [Abstract]. Perception, 31, 63.
Obein, G., Leroux, T., & Viénot, F. (2000). Variability of the 3D repartition of haze with the incident beam ge-ometry. Proceedings of CGIP, 296-299.
Sève, R. (1993). Problems connected with the concept of gloss. Color Research and Application, 18(4), 241-252. Viénot, F. (1998). Perception de la couleur. In Vision:
Aspects perceptifs et cognitifs (pp. 149-168). Marseille: Solal Editeurs.
Wyszecki, G., & Stiles, W. (1982). Color and science: Con-cepts and methods, quantitative data and formulae (2nd ed.)(p. 496). New York: John Wiley & Sons.
Yang, J. N., & Maloney L. T. (2001). Illuminant cues in surface color perception: Tests of three candidate cues. Vision Research, 41(20), 2581-2600. [PubMed]
Yang, J. N., & Shevell, S. K. (2001). Stereo disparity im-proves color constancy. Vision Research, 42(16), 1979-1989. [PubMed]
Yang, J. N., & Shevell, S. K. (2003). Surface color percep-tion under two illuminants: The second illuminant reduces color constancy. Journal of Vision, 3(5), 369-379, http://journalofvision.org/3/5/4/, doi:10.1167/ 3.5.4. [PubMed][Article]