HAL Id: hal-02173572
https://hal.sorbonne-universite.fr/hal-02173572
Submitted on 4 Jul 2019
HAL is a multi-disciplinary open access archive for the deposit and dissemination of sci-entific research documents, whether they are pub-lished or not. The documents may come from
L’archive ouverte pluridisciplinaire HAL, est destinée au dépôt et à la diffusion de documents scientifiques de niveau recherche, publiés ou non, émanant des établissements d’enseignement et de
Sharing resources, not a common code
Valentina Borghesani, Maria Dolores de Hevia, Arnaud Viarouge, Pedro
Pinheiro-Chagas, Evelyn Eger, Manuela Piazza
To cite this version:
Valentina Borghesani, Maria Dolores de Hevia, Arnaud Viarouge, Pedro Pinheiro-Chagas, Evelyn Eger, et al.. Processing number and length in the parietal cortex: Sharing resources, not a common code. Cortex, Elsevier, 2019, 114, pp.17-27. �10.1016/j.cortex.2018.07.017�. �hal-02173572�
M
ANUS
CR
IP
T
AC
CE
PTE
D
1Processing number and length in the parietal cortex:
sharing resources, not a common code.
Valentina Borghesani1,2,3,4*, Maria Dolores de Hevia5,6*, Arnaud Viarouge7 *, Pedro Pinheiro Chagas1,2,3, Evelyn Eger2,3, & Manuela Piazza2-4
* joint first authorship
1. Université Pierre et Marie Curie, Paris 6, Paris, France; 2. Cognitive Neuroimaging Unit, INSERM, Gif sur Yvette, France; 3. NeuroSpin Center, DSV, I2BM, CEA, Gif sur Yvette, France; 4. Center for Mind/Brain Sciences, University of Trento, Italy; 5. Université Paris Descartes, Sorbonne Paris Cité, Paris, France;
6. Laboratoire Psychologie de la Perception, CNRS UMR 8242, Paris, France;
7. Laboratory for the Psychology of Child Development and Education, CNRS UMR 8240, University Paris Descartes, USPC, Paris, France - University of Caen Normandy, Caen, France.
Corresponding author:
V.B. ([email protected]) Department of Neurology,
Memory and Aging Center,
University of California San Francisco
675 Nelson Rising Lane, Mission Bay Campus, San Francisco, CA 94158, USA
ACKNOWLEDGEMENTS
This research was supported by a Marie Curie Intra European Fellowship for Career Development (SpaNum 272633) to M.D.d.H.
M
ANUS
CR
IP
T
AC
CE
PTE
D
ABSTRACT
A current intense discussion in numerical cognition concerns the relationship between the processing of numerosity and other non-numerical quantities. In particular, it is a matter of debate whether number and other quantities (e.g. size, length) are represented separately in the brain or whether they share a common generalized magnitude representation. We acquired high-resolution functional MRI data while adult subjects engaged in a magnitude comparison task involving either numerosity (i.e., which of the two sets has more elements?) or line length (i.e., which of the two lines is longer?). We compared the activation evoked by the two different types of quantity and observed a common recruitment of a vast portion of occipital and parietal cortices. Using MVPA, we demonstrated that some of the commonly activated regions represented the discrete and continuous quantities via a similar distance-dependent magnitude code. However, we found no effect of distance across the two quantity representations, failing to support the existence of a common, dimension invariant, generalized quantity code. Taken together, these findings indicate that although the processing of number and length is supported by partially overlapping neural resources, representations within these regions do not appear to be based on a common neural code.
M
ANUS
CR
IP
T
AC
CE
PTE
D
3Introduction
Number and spatial extent are two quantitative dimensions that are strongly correlated in the environment. Since the seminal work of Piaget on ‘number conservation’, demonstrating that preschool children overestimate longer arrays of elements as being more numerous (Piaget & Szeminska, 1941), several studies have presented evidence supporting the hypothesis that the representations of number and spatial extent are tightly related in the human brain (see for reviews Hubbard, Piazza, Pinel, & Dehaene, 2005; Lourenco & Longo, 2011). For instance, human infants expect that an increase (or decrease) in the number of objects is accompanied by an equivalent increase (or decrease) in object's size (de Hevia, Izard, Coubart, Spelke, & Streri, 2014; de Hevia & Spelke, 2010; Lourenco & Longo, 2010). Other studies have shown that irrelevant numerical information interferes with line bisection accuracy in both adults and children, by biasing the subjective center of the line towards the larger number (de Hevia, Girelli, & Vallar, 2006; de Hevia & Spelke, 2009). Number has also been found to interfere in line length comparison tasks, causing subjects to judge horizontal arrays that contain more elements as longer (Dormal & Pesenti, 2007). Furthermore, studies using Stroop-like paradigms have shown that the physical and numerical size of Arabic digits influence each other in both children (Girelli, Lucangeli, & Butterworth, 1999; Rousselle & Noël, 2008) and adults (Henik & Tzelgov, 1982). Finally, a group of studies demonstrated that numerosity estimation and comparison are influenced by individual item size or the space occupied by arrays of dots, producing incongruency effects: performance is generally lower when numerical and size dimensions are incongruent (e.g., when the most numerous array also contains the smallest items) (Hurewitz, Gelman, & Schnitzer, 2006; Nys & Content, 2012; Sophian & Chu, 2008; for reviews see Bonn & Cantlon, 2012; Leibovich, Katzin, Harel, & Henik, 2016; but see Gebuis, Cohen Kadosh, & Gevers, 2016 for opposite findings, i.e., number overestimation associated with smaller items).
At the brain level, some evidence suggests that the processing of number and spatial extent share a common neural substrate in the intra-parietal cortex (e.g., Cohen Kadosh et al., 2005; Dormal & Pesenti, 2009; Fias et al., 2003; Fink et al., 2000; Holloway & Ansari, 2010). For example, using fMRI Pinel and colleagues (2004) investigated the brain regions engaged when subjects are asked to compare pairs of stimuli on the basis of number, size and luminance. They found a significant overlapping activation in the
M
ANUS
CR
IP
T
AC
CE
PTE
D
parietal cortex elicited by number and size comparisons, which reflected their reciprocal behavioral interference observed in a Stroop paradigm. Crucially, performance on both numerical and length judgment tasks can be disrupted by stimulating the right IPS with repetitive transcranial magnetic stimulation (Dormal, Andres, & Pesenti, 2012). At a finer scale, electrophysiological work in monkeys has identified neurons in the IPS that selectively respond to either numerosity or length, as well as neurons that are tuned to both dimensions (Tudusciuc & Nieder, 2007).
Behavioral and neural evidence for a close link between different dimensions of magnitude, in particular number and length, has led to hypothesize the existence of a unique, abstract magnitude system representing different levels of magnitude irrespectively of the specific type of dimension considered (see ATOM theory originally described in Walsh, 2003). According to this view, different types of magnitudes are represented in a common neural structure by a dimension invariant code, regardless of whether they are discrete (as numerosity) or continuous (as spatial extent or time) dimensions. While the literature is compatible with such a view, especially behavioral interference and mapping effects, recent brain imaging studies cast doubt on the existence of a unique representational system for magnitude, and are suggestive of the existence of domain-specific magnitude representations. For example, recent human high-resolution fMRI studies using a population receptive field mapping approach have revealed that human parietal cortex hosts overlapping, topographically organized maps for both numerosity and size (Harvey, Fracasso, Petridou, & Dumoulin, 2015; Harvey, Klein, Petridou, & Dumoulin, 2013). Crucially, however, even if positive correlations between numerosity and size preferences were found, and particularly so in the right IPS, indicating a partial alignment across the two representations, the tuning functions describing responses to number and size, as well the precise cortical organization of their respective maps displayed important differences. These results support the conclusion that, while recruiting partially overlapping neuronal populations, thus sharing neural resources, these two quantitative dimensions do not share the exact same neural/representational code.
In the present study, we used fMRI to test the hypothesis of a generalized magnitude code which commonly represents number and size. We collected high-resolution whole-brain fMRI data while subjects were either evaluating the number of objects in a set or the length of a single segment, and investigated the neural representational similarity across different levels of magnitude of number and length using a
M
ANUS
CR
IP
T
AC
CE
PTE
D
5MVPA approach, the state-of-the-art tool for investigating neural representational spaces and the unique way to isolate segregated representations if they occur at the level of finer-scale activation patterns within regions (Kriegeskorte, Mur, & Bandettini, 2008). This method has previously been used to demonstrate that numerosity is represented according to a magnitude metric in parietal cortex (Eger et al., 2009; Knops et al., 2014): the distributed patterns of activation evoked by sets of similar numerosities (e.g., 5 vs. 6 dots) are more similar (confusable) compared to those evoked by numerosities that are further apart (e.g., 5 vs. 10 dots). No previous studies used this method to address the question of whether length is also similarly represented according to a magnitude code, nor, crucially, whether numerosity and length are represented by a common magnitude code.
In our study, participants were asked to compare two consecutively presented numerosities (arrays of a varying number of objects) or line lengths (horizontal lines of varying length). For each trial, we considered in our analyses only the brain responses evoked during the presentation of the first magnitude, on which no active comparison task was being performed, to ensure that a potential neural overlap in the processing of these dimensions would not be related to the comparison/response selection process itself. We first asked whether perceiving and holding in mind number and length information (with no concurrent active comparison and no active number to line mapping processes involved) yields overlapping evoked activity in the brain. To this end, we analyzed the brain responses with a mass-univariate approach, and compared the relative amplitude of the BOLD signal across the blocks where subjects were processing number and length vs. their respective fixation baselines. This allowed us to isolate voxels that are activated both during number and length processing, and to select in an unbiased fashion the ROIs within which to investigate, using representational similarity analysis (RSA), the following questions. First, we asked whether in the commonly activated brain regions number and length are both represented according to a magnitude code (to this end, we searched for a “distance effect” in the distributed pattern of fMRI activation). Second, we asked whether this code generalized across dimensions (searching for a “dimension invariant distance effect”).
M
ANUS
CR
IP
T
AC
CE
PTE
D
Materials and Methods
Subjects
We recruited 18 healthy adult volunteers (average age 24.5 years, 8 males), right-handed and with normal or corrected-to-normal vision. Data from 2 participants were discarded due to excessive movement in the scanner (n=1) or to a technical failure (n=1). All participants provided signed informed consent and received a monetary compensation for their participation. Experimental procedures were approved by the local ethical committee.
Stimuli
Numerical stimuli consisted in arrays of randomly oriented, non-overlapping lines with constant thickness and varying lengths. Length stimuli consisted in single horizontal lines of varying length and thickness. Each dimension varied along 3 levels of magnitude (small/medium/large) in one set of the stimuli (first appearing magnitude -Mag1-) and along 5 levels (extra small/small/medium/large/extra large) in a second set of the stimuli (second appearing magnitude -Mag2-). Examples of stimuli are shown in Figure 1. The ratio between the two values to be compared across the Number and Length conditions was the same across trials; therefore, the values in Mag2 were the next smallest or the next largest values for each given Mag1. The numerical ratios between two exemplars of consecutive magnitudes (e.g., small number/medium number) for Number ranged between 0.44 and 0.5; for Length, they ranged between 0.56 and 0.6 (e.g., short length/medium length). These ratios, corresponding to an equivalent high level of discriminability for Number and Length, were derived from data collected in 28 adult subjects in a preceding pilot comparative judgement task using similar stimuli, where ratios close to the ones used here led to an accuracy level that was superior to 95% for both Number and Length (Weber fraction w = .174 for Number, and w = .13 for Length). Two sets of stimuli were generated for each dimension, corresponding to two control conditions. For one set, the total surface area co-varied with magnitude: i.e., more numerous/longer stimuli occupied larger total surface areas on the screen. As in this set the area/thickness of single elements is constant, we refer to it as the set controlled for element size. For the other set, the total surface area was maintained constant across magnitudes and identical across the two dimensions: i.e., the area of individual elements was inversely related to number magnitude, and the line thickness was
M
ANUS
CR
IP
T
AC
CE
PTE
D
7inversely related to their length. We refer to this second set as controlled for total surface area. The total surface area used for the second set closely matched the one used for the medium level of magnitudes in the first set of stimuli. In all the stimuli, the items could occupy random locations within a disc with a diameter corresponding to a visual angle of 30 degrees. Numbers ranged between 5 and 98. In the number stimuli, the individual items had a constant thickness occupying a visual angle of 0.5 degrees, and a length varying between 0.12 and 2.33 degrees, depending on the control condition. In the length stimuli, the lines’ lengths ranged between corresponding visual angles of 2.89 and 26.13 degrees. The lines’ thickness occupied a constant visual angle of 0.7 degrees in the first control condition, and ranged between 0.13 and 2.1 degrees in the second control condition. Stimuli were generated using Matlab software (https://www.mathworks.com/products/matlab.html).
fMRI task
During the fMRI scans, subjects had to compare the relative magnitude of sequentially presented pairs of stimuli (Fig. 1). Each trial began with the presentation of one magnitude (Mag1), followed by the presentation of the comparison rule to be applied (hereafter Rule). Then, the second magnitude (Mag2) appeared, and the subjects were asked to provide the answer. Mag1 and Mag2 always belonged to the same dimension, i.e. both either Number or Length. We introduced the extra small and extra large levels of magnitudes in Mag2 so that each level of magnitude in Mag1 could be either small or large with respect to the level of magnitude in Mag2. The Rule could be symbolic (i.e., < or >) or lexical, with the appropriate wording for each dimension: i.e. “longer?” or “shorter?” for Length trials, “smaller?” or “larger?” for Number trials.
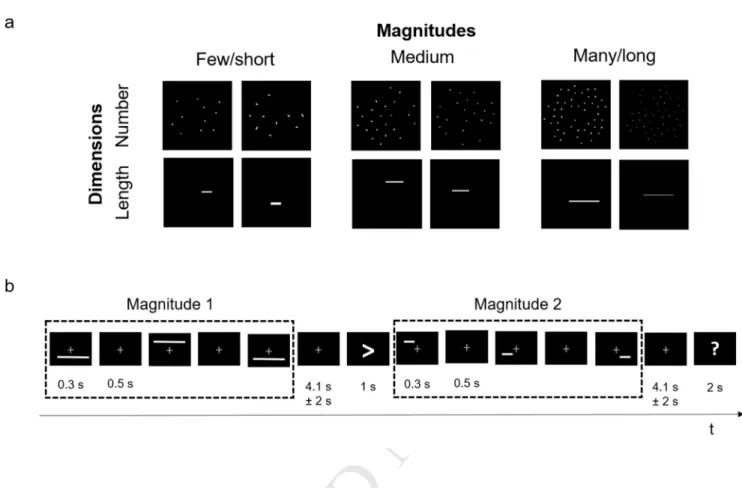
Each magnitude presentation consisted of three images (each with a different spatial configuration) flashed for 300 ms, with a 500 ms blank in between. This manipulation was introduced for two reasons: first, in order to increase the brain response to the stimulus, and second, it allowed subjects to better encode the magnitude independently of the items’ spatial locations. The inter-stimulus interval preceding the presentation of the Rule was jittered by ±2 s around the mean value of 4.1 s, while the Rule was presented for 1 s. Finally, the question mark signaling participants to respond remained on the screen for 2 s. A fixation cross remained on the screen throughout the entire trial to help subjects avoiding eye
M
ANUS
CR
IP
T
AC
CE
PTE
D
movements. The task was designed in a way such that the ratio between the two values to be compared across the Number and Length conditions was constant: the values in Mag2 were the next smallest or the next largest values for each given Mag1. Therefore, no behavioral distance effects could be measured in the scanner.
Subjects underwent 6 experimental runs of 32 trials each, with dimensions (i.e., Number and Length) and magnitudes (i.e., small, medium, and large) being pseudo randomized. The only constraint was a minimum of five trials for each level of magnitude in Mag1 in each dimension (5*3*2 = 30 trials). Two additional trials were randomly picked from all dimensions and levels of magnitude. Stimuli were presented with Matlab Psychophysics toolbox (http://psychtoolbox.org/).
MRI and fMRI protocols
Data were collected at NeuroSpin (CEA-Inserm, Saclay, France) on a 3 Tesla Siemens Magnetom TrioTim scanner using a 32–channel head coil. Each subject underwent one session including an anatomical acquisition (7 minutes long) and 6 functional runs (each 8.5 minutes long on average). Anatomical images were acquired using a T1-weighted Mprage sagittal scan (voxels size 1x1x1 mm, 160 slices). Functional images were acquired using high-resolution multiband imaging sequences (multi–band acceleration factor = 2; iPAT factor = 2; 64 interleaved axial slices; voxel size = 1.5x1.5x1.5 mm; repetition time (TR) = 2.300 ms; echo time (TE) = 32 ms; field of view = 192 mm).
fMRI data pre-processing and first level model
Pre–processing of the raw functional images was conducted with the Statistical Parameter Mapping toolbox (SPM12, http://www.fil.ion.ucl.ac.uk/spm/software/spm12/). It included realignment of each scan to the first of each given run, co-registration of anatomical and functional images, normalization to MNI space using the parameters derived from segmentation-based normalization of the anatomical scan, high-pass filtering (128s), and spatial smoothing (Gaussian kernel of FWHM 3 mm). Functional images were then analyzed with a general linear model (GLM) including 12 regressors convolved with the standard hemodynamic response function to account for the effects of the different Mag1 trial types (3 magnitudes
M
ANUS
CR
IP
T
AC
CE
PTE
D
9[small, medium and large] * 2 dimensions [Length and Number] * 2 controls [constant total surface and constant element size]), 6 regressors for the different Mag2 instances (3 magnitudes [extra small/small, medium and large/extra large] * 2 dimensions [Length and Number]), 6 regressors for the different rules, and 2 for left and right button press responses. The 18 events corresponding to the 12 regressors defining the first magnitudes and the 6 regressors defining the second magnitudes were coded as having a duration of 1900 ms in order to account for the presentation parameters, while the others were modelled as single impulse functions. Additionally, the 6 motion parameters estimated during the preprocessing, and 18 regressors accounting for the run effect (6 runs * 1 linear, 1 quadratic, 1 constant effect), were added as regressors of no-interest. The fixation baseline was modelled implicitly. In the present work, we focused on the 12 beta maps estimated for the first magnitude (Mag1) of both Number and Length. These are the conditions for which brain activation is most likely devoid of confounds due to response selection/execution, as during the time where the response is measured (lasting 5 to 8 seconds across trials) subjects were encoding the first stimulus and could not guess the response that they would have to produce in the final step of the trial.
Univariate Analyses
For the univariate analyses only, individual subjects’ contrast maps were further smoothed (Gaussian kernel of FWHM 6 mm), in order to better account for inter-subject anatomical variability. Then, in order to define regions commonly activated by the stimuli and independently from the dimension type (Number or Length) we performed two random-effects analyses. The first one, more stringent, consisted in exclusively masking the average effect of stimulus presentation (all Number and all Length trials vs. implicit baseline; hereafter: overall activity) with the main effect of dimension type (Number vs. Length; hereafter: activation difference between dimensions). Both conditions were thresholded at p<0.001 uncorrected, cluster extent threshold of 200 voxels. This analysis highlights the voxels in which positive activation is present for all magnitudes and does not significantly vary across dimensions (i.e., Number and Length). We then complemented this analysis with a second less strict definition of activation overlap that consisted in simply masking inclusively the main effect of Length (vs. its implicit baseline, thresholded at p<0.001 uncorrected, cluster extent threshold of 200 voxels) with the main effect of Number (vs. implicit baseline,
M
ANUS
CR
IP
T
AC
CE
PTE
D
thresholded at p<0.001 uncorrected, cluster extent threshold of 200 voxels). The inclusive masking of a given contrast A with another contrast B will keep all voxels reaching significance in A that also reach significance in B. Hence, this analysis does not impose constraints on the relative magnitude of the activation across dimensions. It should be noted that the order in which the contrasts are entered in the masking changes only the T/p values of the selected voxels, but it does not affect the spatial extent of the
ROI. All univariate analyses were implemented in SPM12
(http://www.fil.ion.ucl.ac.uk/spm/software/spm12).
Multivariate Analyses
We then performed MVPA in the clusters of voxels that were commonly activated for Number and Length, as emerged from the two activation overlap analyses described above. First, in order to test whether length is encoded fith a similar quantity code in the commonly activated regions, we explored the existence of a graded distance effect (i.e., the closer the magnitudes, the more similar the activation patterns) for Number and Length separately. Then, in order to test for the presence of a common, dimension invariant, neural representational metric, we tested whether a graded distance effect existed crucially across dimensions, asking whether the representational codes for close magnitudes of different types [small number/short line vs. large number/long line] are more similar to that of far magnitudes [small number/long line vs. large number/short line).
The representational similarity analysis consisted of three steps. First, we averaged the beta maps of all the trials in each dimension (Number and Length) and in each of the 3 magnitude levels (small/medium/large) and control types, thus obtaining 6 maps (2 dimensions x 3 magnitudes) per subject. Second, we calculated the Pearson correlation between these maps in order to construct a neural similarity matrix that describes the similarity of the distributed patterns of activation for the different magnitudes and dimensions. Third, both within and across dimensions, we Fisher r-to-z transformed the correlations’ scores and computed the distance effect as the difference between close (small vs. medium, and medium vs. large magnitude, which should result in high correlation) and far distances (small vs. large magnitude, which should result in low correlation), and tested it against zero with a one-tailed T-test
M
ANUS
CR
IP
T
AC
CE
PTE
D
11(given a strong prediction as for the direction of the distance effect: high similarity for close compared to far distances).
Finally, in order to make sure that we were not missing important cortical areas where multivariate analyses could highlight the presence of a dimension invariant magnitude code we followed the same steps described above, but using a searchlight approach. Because previous work on visual magnitude representations highlighted a key role of occipital and parietal areas, and in order to increase the statistical power of the analyses, we restricted our searchlight within the occipital and parietal lobes (defined using SPM Pick Atlas). Thus, a sphere of radius 5 mm was centered on every voxel within a subject-specific mask restricted to the bilateral occipital and parietal cortices. For each subject, we obtained 3 maps depicting, respectively: distance effect for Number, distance effect for Length, and distance effect across dimensions. These maps were smoothed (Gaussian kernel of FWHM 6 mm) and then entered into three separate group-level random effects models in SPM. Given the exploratory nature of this analysis, the results were explored thresholded at p<0.001 uncorrected, with a cluster extent threshold of 10 voxels.
All multivariate analyses were implemented with custom Python scripts relying on Nilearn (http://nilearn.github.io/), Numpy (http://www.numpy.org/), and Scipy (http://www.scipy.org/scipylib).
Results
Behavioral performance
Despite the fact that, in the scanner, the judgments on length were slightly faster compared to the judgments on number (RTs: Number: 781.4 ms vs. Length: 733.9 ms; t(16) = 3.95, p < .01), accuracy analyses confirmed that we had correctly chosen the stimuli magnitudes that were equally highly discriminable in the two tasks (accuracy: Number: 91.2% vs. Length: 92.3%; t(16) < 1, n.s.).
Univariate results
Processing both dimensions, Number and Length, activated a similar, bilateral network including regions in the occipital and parietal cortices (see Figure 2 and Table 1). Clusters in which activation was equally different from baseline in the two dimensions were found in the bilateral occipital cortex and in
M
ANUS
CR
IP
T
AC
CE
PTE
D
the right parietal cortex (two separate clusters, one more anterior and one more dorsal in the vicinity of the occipito-parietal sulcus). The occipital clusters emerging from this analysis were superimposed on 3 cytoarchitectonic probabilistic maps in the occipital lobe (as defined with SPM Anatomy toolbox) of BA17, 18, and 19, and appeared to equally overlap with all those three early visual regions. The second less stringent form of activation overlap analysis (where the two simple main effects of Number and Length were inclusively masked), revealed more lateral bilateral occipital, right parietal, as well as a cluster in the left parietal cortex (see Table 1).
Multivariate Analyses
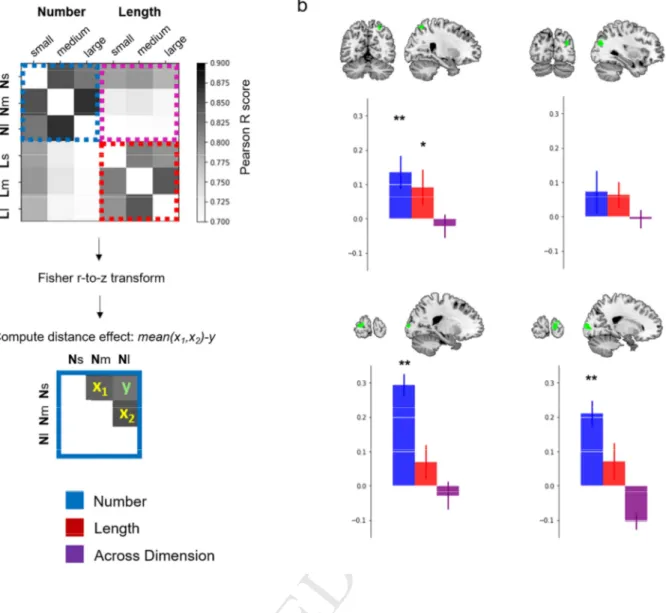
We then used the Representational Similarity Analysis method (RSA) to investigate whether the areas commonly activated for the Number and Length tasks encode the information of number and length in a way that reflects a similar code for magnitude (Figure 3a).
Our first main regions of interest were those detected by exclusively masking the overall activity by the activation difference between dimensions: left occipital lobe (average number of voxels: 321), right occipital lobe (average # voxels: 471), right superior parietal lobule (average # voxels: 430), and right dorsal posterior parietal lobe (average # voxels: 291) (Figure 3b).
The analyses revealed a significant distance effect for Number in bilateral occipital (left: t(15)=9.44, p<10-4, right: t(15)=5.47, p<10-4) and right superior parietal ROIs (t(15)=2.78, p=0.007), indicating significantly greater similarity between patterns of activation evoked by close numerosities (i.e., small vs. medium and medium vs. large) than between far ones (i.e., small vs. large). There was no significant distance effect for Number in the right dorsal posterior parietal ROI (t(15)=1.14, p=0.135).
A significant (although weak) distance effect for Length was also found but only in the right superior parietal ROI (right superior parietal t(15)=1.78, p=0.047; right dorsal posterior parietal: t(15)=1.65, p=0.06; left occipital: t(15)=1.36, p=0.096; right occipital: t(15)=1.29, p=0.107; ).
Crucially, no significant cross-dimensional distance effect was detected in any of the ROIs (left occipital: t(15)=-0.71, p=0.75; right occipital: t(15)=-4.16, p=0.99; right superior parietal: t(15)=-0.64, p=0.73; right dorsal posterior parietal: t(15)=-0.27, p=0.60).
M
ANUS
CR
IP
T
AC
CE
PTE
D
13Similar results were found in the 4 clusters defined by the less strict inclusive masking of the two main effects of Number and Length (vs. their implicit baseline): left occipital lobe (average number of voxels: 1491, Number t(15)=3.93, p<10-4; Length t(15)=1.39, p=0.092; Across dimensions t(15)=-1.43, p=0.91), right occipital lobe (average # voxels: 3636, Number t(15)=4.2, p<10-4; Length t(15)=1.33, p=0.102; Across dimensions t(15)=-3.68, p=0.99), left parietal lobe (average # voxels: 461, Number t(15)=2.00, p=0.032; Length t(15)=0.68, p=0.253; Across t(15)=1.30, p=0.106), and right parietal lobe (average # voxels: 645, Number t(15)=2.99, p=0.004; Length t(15)=-0.04, p=0.51; Across t(15)=-0.83, p=0.79).
With a searchlight approach, we also explored whether these within and across-dimensions distance effects could be detected in other regions within the occipital and parietal lobes. SPM random effect models revealed 2 clusters of significant distance effect for Number in occipital cortex bilaterally (left [18 -91 1] and right [-20 --91 7], overlapping with our occipital ROIs). No clusters survived for Length and no significant cross-dimensional distance effect was detected in any of those areas.
Discussion
Recent years have seen an accumulation of evidence from neuroimaging studies showing that the processing of number and spatial extent elicit activations in overlapping brain areas, in particular within the parietal lobe (e.g., Dormal & Pesenti, 2009; Harvey et al., 2015; Pinel et al., 2004). These results have been taken by some as evidence that different kinds of quantities are processed by a generalized magnitude system (e.g., Bueti & Walsh, 2009; Leibovich et al., 2016; Sokolowski et al., 2017). In the current study, we aimed at directly investigating this hypothesis capitalizing on multivariate analyses of high resolution fMRI data, which are the state-of-the-art tool for investigating neural representational spaces and the unique way to isolate segregated representations if they occur at the level of finer-scale activation patterns within regions.
Overlapping neuronal resources in the extraction of magnitude information
The first main finding of this study, in line with previous literature, is that the processing of number and size recruits a common set of areas in the bilateral parietal and occipital cortices. Contrary to most previous studies, we used a relatively slow and jittered sequential paradigm aiming at disentangling the
M
ANUS
CR
IP
T
AC
CE
PTE
D
stage of perceptual extraction of magnitude and its maintenance in short-term memory, from the stage involving task-related decision making and response execution. Indeed, while we asked participants to perform a comparison task in order to ensure full engagement with magnitude processing, we presented magnitudes in a slow temporal sequence and restricted our analyses to the activations elicited by the first presented stimulus (i.e. before the comparison rule or the second stimulus were shown), thus probing the existence of a commonly activated set of areas before an active comparison/response preparation takes place, thus likely reflecting quantity extraction of both Number and Length, and not a common comparison/decision making stage.
The fact that the processing of number and other non-numerical dimensions elicits activation in overlapping brain regions, especially in the parietal lobe, was also recently confirmed by a meta-analysis of fMRI data based on activation likelihood estimation (ALE) (Sokolowski et al., 2017). This meta-analysis pointed to the right parietal lobule as the localization of a “generalized magnitude processing system”, as tasks related to both numerical and non-numerical magnitudes commonly activate this area. However, due to the limited resolution of the fMRI technique, and our limited insights into the organization of the neural code underlying magnitude representations, the fact that the same macroscopic brain region is overall commonly activated during processing of different types of quantities does not guarantee that neurons in this region encode the magnitude aspect of the stimuli, nor that it does so in a way that is invariant from the quantitative dimension carried by different stimuli and attended to by the subject . Indeed, even if a region represented magnitude within one or more quantitative dimensions (e.g., Number and Length), it is still plausible that at a finer scale those dimensions might be encoded by intermingled, yet separate, neural populations. This question clearly calls for a deeper investigation.
Separate representational codes for number and length
We further qualified the regional activation overlap by means of RSA, searching for evidence of a common magnitude-dependent representational code across the two dimensions, Number and Length. We avoided circularity by performing our analysis either in regions of interest selected on the basis of overall activity (and not on the basis of parametric effects of magnitude, which would have been entirely circular), and by means of a searchlight approach.
M
ANUS
CR
IP
T
AC
CE
PTE
D
15Proceeding this way, we detected a significant distance effect for Number in three of the four regions conjointly activated in the two conditions: the right superior parietal and bilateral occipital areas. In these regions, the distributed activation pattern evoked by the numbers of elements was more similar between close numbers than between far numbers, indicating that number is represented according to a magnitude metric. For Length, a similar distance effect was also observed but only in the right superior parietal cluster. This indicates that, similarly to number, the right parietal cortex represents line length according to a magnitude metric. Crucially, however, we could not detect any hint of distance effect across the two quantitative dimensions, neither in the right parietal clusters nor in any other ROI. Taken together, these findings suggest that even if the dimensions of number and length are both encoded in overlapping areas in the right parietal cortex, and even if both are encoded with a similar magnitude-dependent metric, the relative magnitude codes are domain specific, and thus not shared across these two quantitative continua.
This result is in line with a recent study by Harvey and colleagues (2015), the only one to date who investigate fine grained cortical representations of both number and size, showing that the neural representations of both number and size are similarly organized in overlapping topographical maps in the right parietal cortex. In this study, such overlap appeared to be centered at mean (std) MNI x,y,z coordinates 23 (3), −60 (7), 59 (6), strikingly close to the superior parietal area (peak of ROI: 35, -54, 55) where we found a distance effect for both number and length. It should be noted that this study is the also only one showing similarity in magnitudes representations in the two dimensions (as opposed to simply reporting common parietal recruitment during a comparison tasks, e.g., Fias et al., 2003) and thus not confounded with response selection/task difficulty (e.g., Pinel et al., 2004). Crucially, Harvey’s study highlighted important differences in the tuning functions underlying number and size, with linear Gaussian functions explaining more response variance for the size dimension, while logarithmic Gaussian functions explained more variance for number. Thus, while replicating the previously described overlap in the brain responses elicited by both dimensions, these results also indicate that, although tightly co-localized, the dimensions of number and size elicit distinctive neural responses and therefore do not share a unique, common representational code.
The findings from the present study accord with this interpretation. On the one hand, through univariate analyses, we find a similar bilateral network in parietal and occipital lobes underlying processing
M
ANUS
CR
IP
T
AC
CE
PTE
D
of numerosities and spatial extents. On the other hand, the results of the multivariate analyses indicate distinct finer-scale activation patterns organized according to a similar quantity metric for each dimension. Critical was the addition of RSA, which allowed us to directly approach the question of the neural representational code through the analysis of the distance effect, a signature of quantitative processing. A significant distance effect was indeed found for both number and length in the right parietal cortex. However, neither in this region nor in other ROIs the distance effect generalized across dimensions. These results indicate that even if the right parietal cortex encodes number and line length according to a similar magnitude metric, such representations are dimension specific, and not invariant to the type of quantity presented. Evidence for dimension invariant magnitude metric was not found in any of our other ROIs even when using a searchlight approach within the occipital and temporal lobes.
The strongest and most significant neuronal distance effects in our study were observed in occipital cortex, but for number stimuli only. These effects may be related at least partially to other factors than numerosity per se. Indeed, the way our stimuli were generated was such that for half of the trials stimuli were controlled for dot size and for the other half for the total number of pixels across numerosities. While this strategy is commonly used in studies on numerosity perception, it does not control for differences in the total amount and distribution of contrast energy across numerosities, which is likely to affect early visual responses. This factor may indeed likely account for the early visual cortex activation results in this and other studies, also potentially suggested by a previous fMRI study on numerosity perception, which, after equating the contrast energy of the stimuli, could successfully decode numerosity in parietal but not early visual cortex (Castaldi et al., 2016).
Limitations and future directions
One potentially surprising effect in the current study was that of a stronger multivariate distance effect for Number than for Length. One potential speculative reason for this finding is that our stimuli varying in length also inevitably varied more strongly in terms of spatial position on the screen. Posterior parietal cortices are also implicated in eye and spatial attentional movements, thus it is possible that the size-related hemodynamic signal of our interest may be at least partially contaminated by other kinds of signals coming from the same (or largely overlapping) brain areas.
M
ANUS
CR
IP
T
AC
CE
PTE
D
17Finally, our exploration leaves open two critical aspects that should be the focus of forthcoming studies. First, it is possible that a common, dimension invariant magnitude code exists, but is recruited only during the stage where an active quantity comparison is performed. In this case, the hypothesized shared neural code could be appreciated by the detection of a distance effect across dimensions only once all information (the two magnitudes to be compared and the rule to be applied) is available in working memory. However, typically at this point in time during the trial, the motor response is planned and/or initiated, and representational similarity analyses are known to be particularly vulnerable to this kind of confounds (see for instance Todd et al., 2013). Thus, in order to test this hypothesis, future empirical efforts should be put into the development of paradigms allowing the application of RSA (and/or other multivariate techniques) during comparison, while concurrently accounting for motor planning/execution stages.
Second, it is possible that a common code is localized in other brain areas and/or at a spatial scale that could not be appreciated through the methods we adopted. In our main analyses, we focused on bilateral occipital and parietal cortices, in line with our own univariate results, both using ROI and a searchlight approach, and these did not yield positive results. Thus, we are quite confident that, given our methods, our negative finding (no evidence for a cross-dimension distance effect) is solid. As for the spatial scale at which we have operated in this study, it should be noted that contrary to most previous fMRI studies conducted at 3 Tesla, which typically use a resolution of 3 mm, here we have implemented a high-resolution multiband imaging sequence allowing us to use very small 1.5 mm isotropic voxels. It remains possible that the spatial scale at which number and length converge onto a common magnitude code is even smaller compared to the spatial scale used here, in which case more powerful imaging systems or direct neural recording should be used. However, even for the very precise spatial scale accessed by neurophysiological recordings in monkeys, it has been shown that while neurons tuned to numerosity and/or line length were found within the same subregions of parietal cortex, their relative preferences (for “small” vs “large” stimuli) were not aligned across dimensions (Tudusciuc & Nieder, 2007), speaking against a completely generalized magnitude code at that level of the brain, consistent with the findings reported here.
M
ANUS
CR
IP
T
AC
CE
PTE
D
ConclusionProcessing the number of elements in a set and the length of a segment recruits overlapping bilateral occipital and parietal regions. Among those commonly activated regions, we found evidence that only the right parietal cortex represents both number and length according to a magnitude code, whereby close numerosities, as well as close lengths, elicit patterns of activation that are more similar compared to magnitudes that are far apart, within the same dimension. However, despite number and length being encoded with a similar distance-dependent metric, we found no evidence of a cross-dimensional distance effect: small, medium and large numbers elicit patterns of activation that are uncorrelated with the ones elicited by short, medium and long lengths. These results suggest that the right parietal cortex contains separate, albeit similar in nature, representations of number and line length.
M
ANUS
CR
IP
T
AC
CE
PTE
D
19Figures Legend
Fig. 1 Examples of the stimuli and schematic representation of the fMRI task. a) Subjects performed a
comparison task on the numerosity of sets of non-overlapping lines (Number) or the length of single horizontal lines (Length). Each dimension had two different low-level visual controls (see text for details). b) The two magnitudes to be compared (Magnitude 1 and Magnitude 2) were presented three times in a row (300 ms each) with a fixation period of 500 ms in between. Rest periods were jittered by ±2 s.
M
ANUS
CR
IP
T
AC
CE
PTE
D
Fig. 2 Univariate Results. Whole brain results of the group level random effect analyses of the main effect
of dimension (Length and Number) and analyses of their overlap. a) Color coded clusters show significant activation during the presentation of Magnitude 1, separately for Number (blue), and Length (red) [thresholded at p<0.001 uncorrected, cluster extent threshold of 200 voxels]. b) Results of the overlap analyses illustrating common and equally strong activity for Number and Length in occipital and parietal cortices. Average effect of stimulus presentation (overall activity) masked by the average difference between types of dimensions (upper: green, thresholded at p<0.001 uncorrected, cluster extent threshold of 200 voxels) and inclusive masking the two main effects (lower: yellow, thresholded at p<0.001 uncorrected, cluster extent threshold of 200 voxels).
M
ANUS
CR
IP
T
AC
CE
PTE
D
21Fig. 3 Multivariate ROIs Analyses. a) Example of the similarity matrices computed in the commonly
activated ROIs – here shown: right parietal cluster. Correlation scores are then Fisher r-to-z transformed, and the average distance effect is computed both within and across dimensions. b) Results in our four main ROIs identified with the activation overlap analyses (i.e., overall activity masked by activation difference between dimensions) [**= p<10-4, * = p<0.05, error bars represent the standard error of the mean].
M
ANUS
CR
IP
T
AC
CE
PTE
D
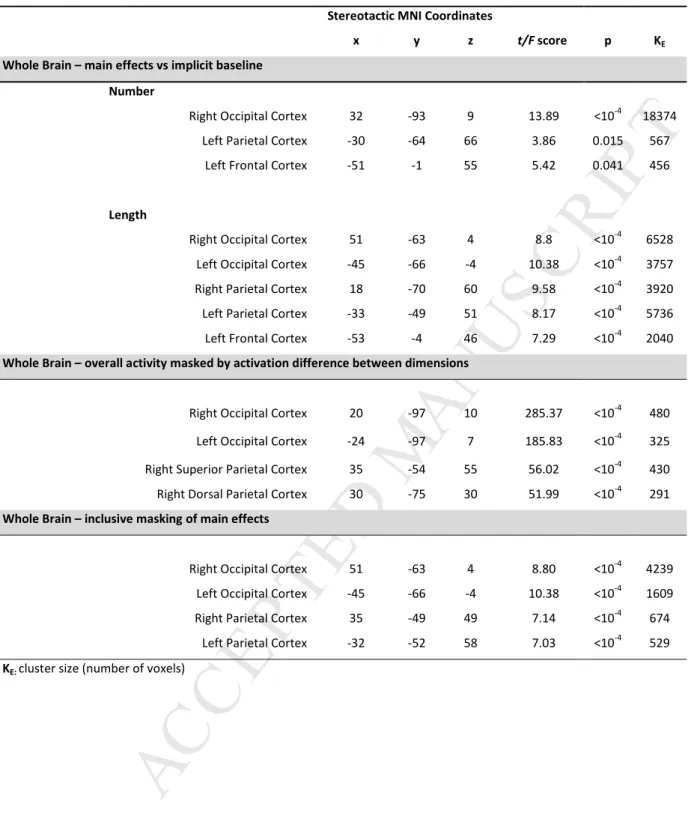
Table 1. Results of Univariate Random Effects Group AnalysisStereotactic MNI Coordinates
x y z t/F score p KE
Whole Brain – main effects vs implicit baseline Number
Right Occipital Cortex 32 -93 9 13.89 <10-4 18374
Left Parietal Cortex -30 -64 66 3.86 0.015 567
Left Frontal Cortex -51 -1 55 5.42 0.041 456
Length
Right Occipital Cortex 51 -63 4 8.8 <10-4 6528
Left Occipital Cortex -45 -66 -4 10.38 <10-4 3757
Right Parietal Cortex 18 -70 60 9.58 <10-4 3920
Left Parietal Cortex -33 -49 51 8.17 <10-4 5736
Left Frontal Cortex -53 -4 46 7.29 <10-4 2040
Whole Brain – overall activity masked by activation difference between dimensions
Right Occipital Cortex 20 -97 10 285.37 <10-4 480
Left Occipital Cortex -24 -97 7 185.83 <10-4 325
Right Superior Parietal Cortex 35 -54 55 56.02 <10-4 430
Right Dorsal Parietal Cortex 30 -75 30 51.99 <10-4 291
Whole Brain – inclusive masking of main effects
Right Occipital Cortex 51 -63 4 8.80 <10-4 4239
Left Occipital Cortex -45 -66 -4 10.38 <10-4 1609
Right Parietal Cortex 35 -49 49 7.14 <10-4 674
Left Parietal Cortex -32 -52 58 7.03 <10-4 529
M
ANUS
CR
IP
T
AC
CE
PTE
D
23References
Bonn, C. D., & Cantlon, J. F. (2012). The origins and structure of quantitative concepts. Cognitive neuropsychology, 29(1-2), 149-173.
Bueti, D., & Walsh, V. (2009). The parietal cortex and the representation of time, space, number and other magnitudes.
Philosophical Transactions of the Royal Society of London B: Biological Sciences, 364(1525), 1831-1840.
Castaldi, E., Aagten-Murphy, D., Tosetti, M., Burr, D., & Morrone, M. C. (2016). Effects of adaptation on numerosity decoding in the human brain. NeuroImage, 143, 364-377.
Cohen Kadosh, R. C., Henik, A., Rubinsten, O., Mohr, H., Dori, H., van de Ven, V., ... & Linden, D. E. (2005). Are numbers special?: the comparison systems of the human brain investigated by fMRI. Neuropsychologia, 43(9), 1238-1248.
de Hevia, M. D., Girelli, L., & Vallar, G. (2006). Numbers and space: a cognitive illusion?. Experimental Brain Research, 168(1-2), 254-264.
de Hevia, M. D., Izard, V., Coubart, A., Spelke, E. S., & Streri, A. (2014). Representations of space, time, and number in neonates.
Proceedings of the National Academy of Sciences of the United States of America, 111(13), 4809–13.
de Hevia, M. D., & Spelke, E. S. (2009). Spontaneous mapping of number and space in adults and young children. Cognition,
110(2), 198-207.
de Hevia, M. D., & Spelke, E. S. (2010). Number-space mapping in human infants. Psychological Science, 21(5), 653-660.
Dormal, V., Andres, M., & Pesenti, M. (2012). Contribution of the right intraparietal sulcus to numerosity and length processing: an fMRI-guided TMS study. Cortex, 48(5), 623-629.
Dormal, V., & Pesenti, M. (2007). Numerosity-length interference: A Stroop experiment. Experimental Psychology, 54(4), 289-297. Dormal, V., & Pesenti, M. (2009). Common and specific contributions of the intraparietal sulci to numerosity and length processing.
Human Brain Mapping, 30(8), 2466-2476.
Eger, E., Michel, V., Thirion, B., Amadon, A., Dehaene, S., & Kleinschmidt, A. (2009). Deciphering cortical number coding from human brain activity patterns. Current Biology, 19(19), 1608-1615.
Eger, E., Pinel, P., Dehaene, S., & Kleinschmidt, A. (2015). Spatially invariant coding of numerical information in functionally defined subregions of human parietal cortex. Cerebral Cortex, 25(5), 1319–1329.
Fias, W., Lammertyn, J., Reynvoet, B., Dupont, P., & Orban, G. A. (2003). Parietal representation of symbolic and nonsymbolic magnitude. Journal of cognitive neuroscience, 15(1), 47-56.
Fink, G. R., Marshall, J. C., Shah, N. J., Weiss, P. H., Halligan, P. W., Grosse-Ruyken, M., ... & Freund, H. J. (2000). Line bisection judgments implicate right parietal cortex and cerebellum as assessed by fMRI. Neurology, 54(6), 1324-1331. Gebuis, T., Kadosh, R. C., & Gevers, W. (2016). Sensory-integration system rather than approximate number system underlies
numerosity processing: A critical review. Acta psychologica, 171, 17-35.
Girelli, L., Lucangeli, D., & Butterworth, B. (2000). The development of automaticity in accessing number magnitude. Journal of
experimental child psychology, 76(2), 104-122.
Harvey, B. M., Fracasso, A., Petridou, N., & Dumoulin, S. O. (2015). Topographic representations of object size and relationships with numerosity reveal generalized quantity processing in human parietal cortex. Proceedings of the National Academy of
Sciences, 112(44), 13525-13530.
Harvey, B. M., Klein, B. P., Petridou, N., & Dumoulin, S. O. (2013). Topographic representation of numerosity in the human parietal cortex. Science, 341(6150), 1123-1126.
M
ANUS
CR
IP
T
AC
CE
PTE
D
Memory & cognition, 10(4), 389-395.
Holloway, I. D., & Ansari, D. (2010). Developmental specialization in the right intraparietal sulcus for the abstract representation of numerical magnitude. Journal of Cognitive Neuroscience, 22(11), 2627-2637.
Hubbard, E. M., Piazza, M., Pinel, P., & Dehaene, S. (2005). Interactions between number and space in parietal cortex. Nature
Reviews Neuroscience, 6(6), 435-448.
Hurewitz, F., Gelman, R., & Schnitzer, B. (2006). Sometimes area counts more than number. Proceedings of the National
Academy of Sciences, 103(51), 19599-19604.
Knops, A., Piazza, M., Sengupta, R., Eger, E., & Melcher, D. (2014). A shared, flexible neural map architecture reflects capacity limits in both visual short-term memory and enumeration. Journal of Neuroscience, 34(30), 9857-9866.
Kriegeskorte, N., Mur, M., & Bandettini, P. (2008). Representational similarity analysis–connecting the branches of systems neuroscience. Frontiers in systems neuroscience, 2.
Leibovich, T., Katzin, N., Harel, M., & Henik, A. (2017). From “sense of number” to “sense of magnitude”: The role of continuous magnitudes in numerical cognition. Behavioral and Brain Sciences, 40.
Lourenco, S. F., & Longo, M. R. (2010). General magnitude representation in human infants. Psychological Science, 21(6), 873-881.
Lourenco, S. F., & Longo, M. R. (2011). Origins and development of generalized magnitude representation. Space, time, and
number in the brain: Searching for the foundations of mathematical thought, 225-244.
Nys, J., & Content, A. (2012). Judgement of discrete and continuous quantity in adults: Number counts!. The Quarterly Journal of
Experimental Psychology, 65(4), 675-690.
Piaget, J., & Szeminska, A. (1941). La genèse du nombre chez l'enfant.
Piazza, M., Izard, V., Pinel, P., Le Bihan, D., & Dehaene, S. (2004). Tuning curves for approximate numerosity in the human intraparietal sulcus. Neuron, 44(3), 547-555.
Pinel, P., Piazza, M., Le Bihan, D., & Dehaene, S. (2004). Distributed and overlapping cerebral representations of number, size, and luminance during comparative judgments. Neuron, 41(6), 983–993.
Rousselle, L., & Noël, M. P. (2008). The development of automatic numerosity processing in preschoolers: evidence for numerosity-perceptual interference. Developmental Psychology, 44(2), 544.
Sokolowski, H. M., Fias, W., Ononye, C., & Ansari, D. (2017). Are numbers grounded in a general magnitude processing system? A functional neuroimaging meta-analysis. Neuropsychologia.
Sophian, C., & Chu, Y. (2008). How do people apprehend large numerosities?. Cognition, 107(2), 460-478.
Todd, M. T., Nystrom, L. E., & Cohen, J. D. (2013). Confounds in multivariate pattern analysis: theory and rule representation case study. Neuroimage, 77, 157-165.
Tudusciuc, O., & Nieder, A. (2007). Neuronal population coding of continuous and discrete quantity in the primate posterior parietal cortex. Proceedings of the National Academy of Sciences, 104(36), 14513-14518.
Walsh, V. (2003). A theory of magnitude: Common cortical metrics of time, space and quantity. Trends in Cognitive Sciences,