Behavioral/Cognitive
Distinct Oscillatory Frequencies Underlie Excitability of
Human Occipital and Parietal Cortex
X
Jason Samaha,
1Olivia Gosseries,
2,3and Bradley R. Postle
1,21Department of Psychology and2Department of Psychiatry, University of Wisconsin, Madison, Wisconsin 53704, and3Coma Science Group, GIGA consciousness research, University and University Hospital of Lie`ge, 4000 Lie`ge-Belgium
Transcranial magnetic stimulation (TMS) of human occipital and posterior parietal cortex can give rise to visual sensations called
phosphenes. We used near-threshold TMS with concurrent EEG recordings to measure how oscillatory brain dynamics covary, on single
trials, with the perception of phosphenes after occipital and parietal TMS. Prestimulus power and phase, predominantly in the alpha band
(8 –13 Hz), predicted occipital TMS phosphenes, whereas higher-frequency beta-band (13–20 Hz) power (but not phase) predicted
parietal TMS phosphenes. TMS-evoked responses related to phosphene perception were similar across stimulation sites and were
characterized by an early (200 ms) posterior negativity and a later (
⬎300 ms) parietal positivity in the time domain and an increase in
low-frequency (
⬃5–7 Hz) power followed by a broadband decrease in alpha/beta power in the time–frequency domain. These correlates
of phosphene perception closely resemble known electrophysiological correlates of conscious perception of near-threshold visual
stim-uli. The regionally differential pattern of prestimulus predictors of phosphene perception suggests that distinct frequencies may reflect
cortical excitability in occipital versus posterior parietal cortex, calling into question the broader assumption that the alpha rhythm may
serve as a general index of cortical excitability.
Key words: cortical excitability; occipital; oscillations; parietal; phosphenes; visual perception
Introduction
Transcranial magnetic stimulation (TMS) can elicit muscle
contractions when applied over motor cortex (
Merton et al.,
1982
) and can induce visual sensations (phosphenes) when
applied over regions of occipital cortex (
Kammer et al., 2005
).
These phenomena can be used to study variability in the state
of cortical excitability of the tissue undergoing stimulation by
measuring changes in the magnitude or likelihood of these
re-sponses as stimulation parameters are kept constant (
Pascual-Leone et al., 1998
). When TMS is combined with concurrent EEG
recordings, variability in cortical excitability can be linked to
vari-ability in ongoing neural activity. Using this approach, prior
work has found that the power of oscillatory neural activity in the
alpha band (8 –13 Hz) before the onset of TMS is negatively
cor-related with both phosphene perception (
Romei et al., 2008a
)
and the likelihood and magnitude of motor-evoked potentials
(
Zarkowski et al., 2006
;
Sauseng et al., 2009
). These findings are
taken as evidence that cortical excitability is regulated by
neuro-nal oscillations in the alpha range (
Jensen and Mazaheri, 2010
).
Recent studies have also found that the prestimulus alpha
phase is predictive of the perception of phosphenes (
Dugue´ et al.,
2011
) and visual stimuli (
Busch et al., 2009
;
Mathewson et al.,
2009
;
Samaha et al., 2015
), leading to the proposal that alpha
Received Nov. 3, 2016; revised Jan. 26, 2017; accepted Jan. 31, 2017.
Author contributions: J.S. and B.R.P. designed research; J.S. and O.G. performed research; J.S. analyzed data; J.S., O.G., and B.R.P. wrote the paper.
This work was supported by National Institutes of Health grant RO1MH095984 (to B.R.P.) and the Belgian National Fund for Scientific Research (FNRS) and Human Brain Project grant EU-H2020-FETFLAGSHIP-HBP-SGA1-GA720270 (to O.G.).
The authors declare no competing financial interests.
Correspondence should be addressed to Jason Samaha, Department of Psychology, University of Wisconsin, 1202 W. Johnson St., Madison, WI 53703. E-mail:[email protected].
DOI:10.1523/JNEUROSCI.3413-16.2017
Copyright © 2017 the authors 0270-6474/17/372824-10$15.00/0
Significance Statement
Alpha-band oscillations are thought to reflect cortical excitability and are therefore ascribed an important role in gating
informa-tion transmission across cortex. We probed cortical excitability directly in human occipital and parietal cortex and observed that,
whereas alpha-band dynamics indeed reflect excitability of occipital areas, beta-band activity was most predictive of parietal
cortex excitability. Differences in the state of cortical excitability predicted perceptual outcomes (phosphenes), which were
man-ifest in both early and late patterns of evoked activity, revealing the time course of phosphene perception. Our findings prompt
revision of the notion that alpha activity reflects excitability across all of cortex and suggest instead that excitability in different
regions is reflected in distinct frequency bands.
may impose inhibition in a phasic manner (
Mathewson et al.,
2011
).
Because this approach relies on stimulating brain areas that
give rise to observable or reportable responses, previous work has
been limited to investigating the excitability of visual and motor
cortices. Recently, however, several groups have reported that
TMS of posterior parietal cortex (PPC) can also give rise to
pho-sphenes (
Marzi et al., 2009
;
Mazzi et al., 2014
;
Tapia et al., 2014
;
Bagattini et al., 2015
). Although the phenomenology of PPC
pho-sphenes has been reported to be comparable to those elicited
from occipital stimulation (
Fried et al., 2011
), the physiological
correlates of the two have not been compared directly. We
there-fore undertook characterization of the cortical excitability of
PPC and compared it with occipital cortex by applying TMS at
phosphene-threshold levels to both areas while recording EEG. If
alpha-band dynamics reflect cortical excitability in PPC, then alpha
power and/or phase would also be predictive of parietal TMS
phos-phenes. Alternatively, oscillations in the lower beta-band (13–30 Hz)
may play this role for PPC because beta has been proposed as the
“natural frequency” of PPC on the basis of the observation that the
dominant EEG response to PPC TMS is
⬃20 Hz (
Rosanova et al.,
2009
;
Ferrarelli et al., 2012
). Furthermore, prestimulus dynamics of
⬃20 Hz predict the global mean field amplitude of the EEG response
to TMS of PPC (
Kundu et al., 2014
).
Our approach also allowed us to investigate the neural
corre-lates of TMS-evoked phosphene perception. Prior work using
visual stimuli has focused on two ERP components that vary
with awareness: an early posterior “visual-awareness negativity”
(VAN) and a late central-parietal positivity (LP) (for review, see
Koivisto and Revonsuo, 2010
;
Railo et al., 2011
). Our study
al-lowed us to investigate whether these components generalize to
the perception of phosphenes. Because spontaneous and
TMS-evoked brain activity fluctuates from trial-to-trial in a continuous
manner, we hypothesized that the perceptual states linked to
these fluctuations would also vary continuously. We tested this
hypothesis by measuring the strength of phosphene perception
on a continuous scale ranging from “clearly present” to “clearly
absent.” These reports served as responses for single-trial
regres-sion analyses relating phosphene perception to fluctuations in
EEG voltage, power, and phase. Our findings reveal the temporal
and oscillatory dynamics of neural activity related monotonically
to phosphene perception induced by occipital and parietal TMS
and suggest that, whereas alpha-band oscillations reflect cortical
excitability of occipital cortex, beta power reflects excitability of
parietal cortex.
Materials and Methods
Subjects. Seventeen subjects were recruited for the experiment for
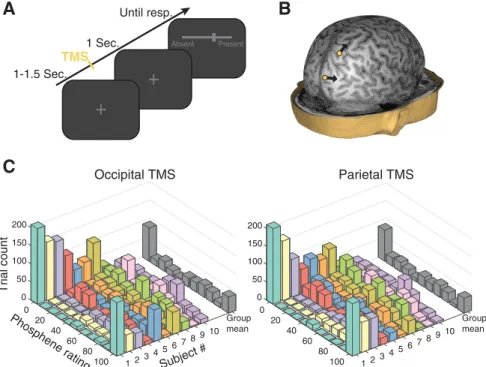
mon-etary compensation. After phosphene screening, which entailed single-pulse stimulation of right occipital and right parietal cortex at up to 90% of maximum stimulator output, 10 subjects (8 male; 24 –33 years old) who perceived phosphenes reliably at both stimulation sites were re-tained for EEG recording. This proportion is consistent with reports of 60 – 80% of subjects who perceive occipital TMS phosphenes without extensive training and resulted in a sample size comparable to previous TMS–EEG experiments examining phosphenes (Romei et al., 2008a;
Dugue´ et al., 2011;Bagattini et al., 2015). All subjects were recruited from the University of Wisconsin–Madison community. The University of Wisconsin–Madison Health Sciences Institutional Review Board ap-proved the study protocol. All subjects gave informed consent and were screened for the presence of neurological and psychiatric conditions and other risk factors related to the application of TMS.
Stimulation and phosphene thresholding. As described previously
(Marzi et al., 2009;Fried et al., 2011), stimulation of right occipital cortex
was delivered over electrode O2 and stimulation of right PPC was deliv-ered over electrode P4. The coil handle was oriented medial to lateral, away from the inion, during occipital stimulation and ventromedial to dorsolateral, pointing away from the inion for parietal stimulation (see arrows inFig. 1B). The final coordinates of stimulation were then
deter-mined functionally by slightly adjusting the coil until phosphenes were elicited reliably. Phosphene perception was considered reliable if partic-ipants reported them in the visual field contralateral to stimulation and if they ceased with decreased stimulation intensity. To ensure consistent stimulation throughout the experiment, the final stimulation coordi-nates were saved and visualized using a navigated brain stimulation (NBS) system (Nexstim) that uses infrared-based frameless stereotaxy to map the position of the coil and the subject’s head within the reference space of the individual’s high-resolution T1-weighted anatomical MRI (acquired with a GE MR750 3 T scanner for each subject before the experiment). During EEG recording, the coil was held in place by the experimenter, who monitored the NBS system to maintain consistent stimulation coordinates. Phosphene thresholds were defined for each subject and stimulation site before the experiment as the stimulator in-tensity that lead to a 50% rate of phosphene reports (yes/no verbal re-sponse) after 10 single-pulse stimulations. This was accomplished by increasing stimulator intensity until a phosphene was reported and then adjusting stimulator intensity in 1% steps until 5/10 phosphenes were reported. As noted in prior work (Fried et al., 2011;Tapia et al., 2014;
Bagattini et al., 2015), parietal TMS phosphene thresholds required higher stimulator intensities (M⫽ 83.2% of maximum stimulator out-put, SD⫽ 9.2) than occipital (M ⫽ 71.9%, SD ⫽ 8.1). A thin layer of foam was placed between the coil and the EEG cap to help minimize TMS artifacts and auditory artifacts due to bone conduction (Massimini et al., 2005). This resulted in a higher intensity stimulator output (compared with prior work), to achieve phosphene thresholds. TMS was delivered with a Magstim Super Rapid2magnetic stimulator fit with a focal
bi-pulse, figure of eight 70 mm stimulating coil.
Experimental session. Each subject completed eight blocks of 100 trials
each. Single-pulse TMS was delivered to occipital cortex on half of the blocks and to parietal cortex on the remaining half. Occipital and parietal stimulation blocks were interleaved and the order was counterbalanced across participants. The task is depicted inFigure 1A. Each trial began
with a random intertrial interval between 1000 and 1500 ms during which a dark gray fixation cross was presented atop a black background. After each pulse of TMS, subjects’ maintained central fixation for 1 s, at which point a dark grayscale appeared. The left and right end points of the semicontinuous scale were respectively labeled “clearly absent” and “clearly present.” (Although no digits appeared along the response dis-play, responses were recorded by the computer as an integer value rang-ing from “0” at the extreme left of the bar to “100” at the extreme right.) Subjects were instructed to rate the presence of phosphenes by sliding a computer mouse with their right hand to the appropriate position on the scale and clicking the mouse. A perpendicular bar marked the current scale position that was reset to the center of the scale on each trial, which subjects were informed corresponded to an “unsure” response. There-fore, this scale captured the subjective certainty or clarity of phosphenes in a monotonic fashion, with increasing values indicating greater subjec-tive certainty in the presence of phosphenes. As a check of basic task compliance, TMS was not delivered on 5% of all trials (randomly deter-mined), which, if subjects understood the scale, we expect would result in reports near zero.
EEG acquisition and preprocessing. EEG was recorded from 60 Ag/AgCl
electrodes connected to a TMS-compatible amplifier (Nexstim). This amplifier avoids saturation from the TMS pulse with a sample-and-hold circuit that holds amplifier output constant from 100s before to 2 ms after stimulus. Impedance at each electrode was kept at⬍5 k⍀. A single electrode placed on the forehead was used as the reference and eye move-ments were recorded with two additional electrodes placed below and on the outer side of the right eye. Data were acquired at a rate of 1450 Hz with 16-bit resolution. To reduce contamination of the EEG by auditory responses from TMS, masking white noise was played through inserted earplugs throughout the experimental session, as in previous experi-ments in our laboratory (Kundu et al., 2014). EEG was processed offline
with custom MATLAB scripts (version R2014b) and with the EEGLAB toolbox ver-sion 13.5 (Delorme and Makeig, 2004). Re-cordings were inspected visually and noisy channels (3.9 on average) were spherically in-terpolated. Data were downsampled to 500 Hz and re-referenced to the average of all elec-trodes. Because, for some subjects, residual high-amplitude artifacts persisted for 20 –30 ms after TMS, the data from⫺10 to 40 ms surrounding each TMS pulse was removed and interpolated via robust splines (Garcia, 2010). These artifacts resembled those caused by stim-ulation of cranial muscles and occurred in some subjects due to the choice of stimulation site being optimized for eliciting phosphenes, making the window from⫺10 to 40 ms diffi-cult to interpret. A one-pass zero-phase Ham-ming windowed-sinc FIR filter between 0.5 and 50 Hz was applied to the data (EEGLAB function “pop_eegfiltnew.m”) and epochs spanning⫺1500 to 1500 relative to TMS onset were extracted. A prestimulus baseline of⫺200 to⫺10 was then subtracted from each trial. Individual trials were then inspected visually and those containing muscle artifacts or ocular artifacts occurring contemporaneously with TMS onset were removed, resulting in an aver-age of 322 occipital stimulation and 323 pari-etal stimulation trials remaining per subject. Independent components analysis using the INFOMAX algorithm (EEGLAB function “binica.m”) was used to remove remaining oc-ular artifacts not coinciding with TMS, as well
as artifactual components clearly related to TMS. An average of 2.7 ocular artifacts and 6.8 TMS-related artifacts were removed per subject. Raw data and commented code used for all preprocessing and analysis are freely available for download through the Open Science Framework 共https://osf.io/6qu3b/兲.
Time– domain analysis. To relate continuously varying perceptual
rat-ings to continuously varying voltage across time, we performed nonpara-metric robust regression on single-trial data. For each time point, electrode, and subject, regression coefficients that describe the mono-tonic relationship between voltage and phosphene presence ratings were estimated according to the following linear model:
 ⫽ XTX⫺1XTD
where X is the design matrix containing one column for the intercept (all ones) and one column for perceptual ratings across trials; the super-scripts “T” and “⫺1” indicate the matrix transpose and inverse, respec-tively; and D is the vector of voltage data from all trials at a given time point. The resulting beta coefficient representing the slope of the voltage– phosphene relationship was then converted into a z-statistic relative to a subject-specific null hypothesis distribution obtained by repeatedly shuf-fling the mapping between ratings and voltage (see “Statistics” section). Before regression, the voltage data were smoothed with a 20 ms sliding average window and both phosphene ratings and voltage were rank scored to mitigate the influence of outlying data while testing for a mono-tonic relationship (this is equivalent to computing a Spearman’s corre-lation coefficient). These normalized beta coefficients were then averaged over a cluster of posterior electrodes (visualized inFig. 2B,
inset) to improve the signal-to-noise ratio. To validate this procedure against a more traditional time– domain analysis approach, trial-averaged ERPs were also computed by sorting trials into “phosphene present” and “phosphene absent” bins if they were greater than (less than) the 55th(45th) percentile of the scale (to exclude middle “unsure”
trials). As described previously (Pitts et al., 2014b;Railo et al., 2015;
Shafto and Pitts, 2015), the LP/P3 potential was examined at the central
parietal electrode Pz and the VAN was examined at occipital electrode Oz. Time windows for each component were determined from data or-thogonal to later statistical contrasts by inspecting the condition-averaged ERP. VAN was condition-averaged over a window that spanned 180 –220 ms and the LP over a window that spanned 300 – 800 ms.
Time–frequency analysis. The same single-trial regression approach
was used to relate time–frequency power to phosphene perception. Time–frequency decomposition was performed by convolving data from each trial with a family of complex Morlet wavelets spanning 2–50 Hz in 1.23 Hz steps, with wavelet cycles increasing linearly between 3 and 8 cycles as a function of frequency. Power was obtained by squaring the absolute value of the resulting complex time series and was converted to percentage signal change relative to a prestimulus baseline of⫺600 to ⫺100 ms to adjust for power law scaling. After regression, normalized beta coefficients were then averaged over the same cluster of posterior electrodes that was used in the time– domain regression analysis (see above). Due to the temporal smearing inherent in time–frequency de-composition, caution must be used when analyzing prestimulus effects, particularly with respect to phase (Zoefel and Heil, 2013), which can result from a confound due to contamination of prestimulus data by poststimulus differences. Therefore, we focused further on prestimulus power and phase by performing an FFT on data segments cut from ⫺1000 to ⫺50 ms before TMS onset. Before the FFT, these segments were linearly detrended, multiplied by a Hamming window, and zero padded (frequency resolution: 0.1 Hz). Power was extracted by squaring the absolute value of the Fourier coefficients and phase was obtained by taking the angle (MATLAB function “angle.m”). Single-trial prestimulus power was related to phosphene perception as before and was also binned into high and low ratings, again, to illustrate differences in a more tradi-tional manner. For this analysis, power was log10transformed and
aver-aged over the alpha band (8 –13 Hz) and low-beta band (13–20 Hz). Because phase is a circular variable, it cannot be related to a linear variable by means of ordinary linear regression. We therefore computed a recently introduced measure of circular-linear association called “weighted intertrial phase clustering” (wITPC) (Cohen and Cavanagh,
Absent Present
+
+
1-1.5 Sec. 1 Sec. Until resp. TMSB
A
C
0 50 0 100 Trial count 20 Group mean 150 200 40 10 Phosphene rating 9 8 Subject # 60 67 5 80 34 2 100 1 0 50 0 100 20 150 Group mean 200 40 910 8 60 67 5 80 34 2 100 1 S M T l a t e i r a P S M T l a t i p i c c OFigure 1. Task design, stimulation sites, and phosphene report distributions. A, After a variable intertrial interval of 1–1.5 s, a single pulse of TMS was delivered at individual phosphene thresholds. One second after TMS, subjects reported the presence of phosphenes by sliding a cursor across a one-dimensional scale between “clearly absent” and “clearly present.” B, Stimulation was applied to functionally determined targets within occipital and parietal cortex in counterbalanced blocks. The yellow dots indicate targets from a representative subject and the arrows indicate the orientation of the handle of the TMS coil. C, Distributions of phosphene reports for individual subjects and for the group level after occipital and parietal TMS.
2011;Cohen and Voytek, 2013;Cohen, 2014) to relate prestimulus phase to phospehene ratings. wITPC is computed as the resultant vector length, or intertrial phase clustering (also called the phase-locking factor or in-tertrial coherence), of phase angles across trials once the length of each vector has been weighted by the linear variable of interest (an example of this computation with data from one subject is shown inFig. 4B). wITPC
was computed for each subject, TMS condition, electrode, and frequency by multiplying the unit length complex-valued phase angle on each trial by the corresponding trial’s perceptual rating, averaging those complex numbers across trials, and taking the absolute value to ob-tain the resultant vector length. Because wITPC will be non-normally distributed and the magnitude will be strongly determined by the scale of the linear (weighting) variable, it is necessary to normalize this quantity with respect to a null distribution obtained by shuffling trial labels. Positive normalized wITPC values indicate that phase
modulates phosphene perception, or, in other words, that certain perceptual ratings are more likely than chance to occur at certain phase angles of the measured oscillation.
Statistics. Level one (subject-level) statistics were performed for all
time and time–frequency domain single-trial analysis described above by randomly permuting the mapping between phosphene ratings and neu-ral data 1000 times, each time recomputing the relevant statistic (beta coefficient or wITPC). The statistic associated with the true data map-ping was then converted to a z-statistic relative to the mean and SD of the permuted data. This resulted in a z-value for each analysis, subject, TMS condition, channel, time point, or time–frequency point. This approach incorporates knowledge about variability in the subject-level effects into the subsequent group-level analyses. Level two (group-level) statistics and significance values were also computed by means of nonparametric permutation tests in combination with threshold free cluster
enhance-Normalized beta coefficient (Z)
Occipital TMS
Parietal TMS
0 0 8 0 0 4 0 0 4 --4 4 0 -400 0 400 800 -4 4 ) s m ( t e s n o S M T m o r f e m i T ) s m ( t e s n o S M T m o r f e m i T - 175 ms 0 ms 200 ms 400 ms 600 ms - 175 ms 0 ms 200 ms 400 ms 600 ms Beta coeff. (Z) -1.8 1.8 T e 0 m T e 0 -2 2 -2 2 -400 0 400 800 -400 0 400 800 -2 2 -400 0 400 800 -2 2 -400 0 400 800 Amplitude (µV)Time from TMS onset (ms)
Amplitude (µV)
Time from TMS onset (ms) z P z P z O z O Late positive potential (LP) Visual awareness negativity (VAN) 300-800 ms 180-220 ms 300-800 ms 180-220 ms
S
M
T
l
a
t
e
i
r
a
P
S
M
T
l
a
t
i
p
i
c
c
O
0.9 -0.9 µV Phosphene present Phosphene absentA
B
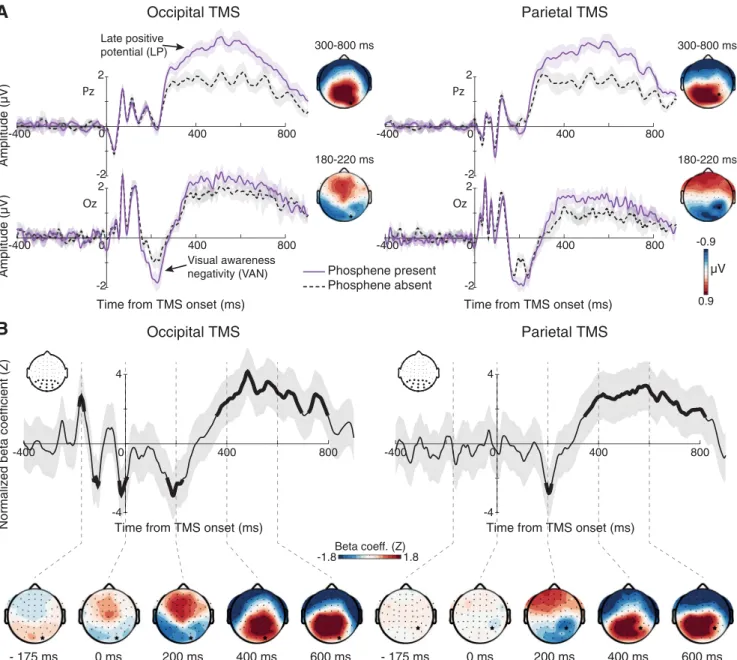
Figure 2. Voltage– domain correlates of phosphene perception time locked to TMS onset. A, ERPs contrasting phosphene present and phosphene absent trials for each stimulation condition revealed an early modulation of the VAN component (bottom; electrode Oz), followed by modulation of the late positive potential (top; electrode Pz). Scalp maps denote the difference topography of each component, revealing VAN modulation at lateral– occipital scalp sites after occipital TMS and at central occipital–parietal sites after parietal TMS. The LPP modulation was parietally maximal at both stimulation sites. Shaded bands denote⫾1 within-subject SEM. Black star indicates electrode nearest the stimulation site. B, Single-trial regression results also reveal a negative relation between voltage at 200 ms and phosphene perception for both stimulation sites and a positive relation after 300 ms. Note the similarity of the beta coefficient topographies to those obtained from the ERP analysis. Also of note is a strong prestimulus oscillation in beta coefficients before occipital TMS with a period of about 100 ms, which suggests an influence of prestimulus alpha-band phase on phosphene perception during occipital TMS. Thick line segments denote significant cluster-corrected regression coefficients and shaded bands represent 95% confidence intervals.
ment (TFCE) to address multiple comparisons across time and frequency points. To estimate group-level null hypothesis distributions, on each of 5000 permutations, z-scores from a random subset of subjects were multiplied by ⫺1 and a t test against zero was computed. This is equivalent to randomly swapping the order of the condition subtraction; for example, A-B versus B-A (Maris and Oostenveld, 2007). The
t-statistic resulting from the true data mapping
was then subject to TFCE as implemented in the LIMO EEG package (Pernet et al., 2011), which uses the algorithm developed bySmith and Nichols (2009). Each permutated t-statistic was also submitted to TFCE, forming a distribution of cluster extents expected under the null hypothesis. Only cluster extents in the real data exceeding an␣ rate of 0.05% were considered statistically significant. This proce-dure has been shown to control well the fami-lywise error rate across multiple comparisons while taking into account the autocorrelation of electrophysiological data (Pernet et al., 2015). All tests were two-tailed.
Results
Phosphene ratings
The average rating of phosphene presence
(
⫾SD) was 42.5 ⫾ 8.9 (of 100) after
oc-cipital stimulation and 41.8
⫾ 4.8 after
stimulation, confirming that our
thresh-olding procedure was effective. As shown
in
Figure 1
C, subjects made use of the full
range of the scale, although with varying
degrees of gradedness (i.e., some subjects
used the end point values more frequently
than others). When sorted into 11 bins (as
in
Fig. 1
C), the shape of the
group-averaged histogram had four local
max-ima that were the same for occipital and
parietal TMS. These peaks were at ratings
of 4.5, 22.7, 68.18, and 95.5, consistent
with previous work that identified 4 “categories” of perceptual
experience underlying the use of continuous perceptual scales
(
Ramsøy and Overgaard, 2004
;
Overgaard et al., 2006
). As
ex-pected, ratings on no-TMS trials were near zero (1.9
⫾ 3),
indi-cating basic task compliance and ensuring that subjects
understood the directionality of the scale. These results suggest
that additional information can be gained by allowing subjective
perceptual responses to take a nonbinary form.
Time– domain correlates of phosphene perception
ERP’s contrasting high and low perceptual ratings are presented
in
Figure 2
A. High phosphene presence trials were associated
with larger TMS-evoked VAN amplitudes after both occipital
(t
(1,9)⫽ ⫺4.39, p ⫽ 0.002) and parietal (t
(1,9)⫽ ⫺3.79, p ⫽
0.004) TMS. This effect was similar across stimulation
condi-tions, but had a more temporal– occipital scalp distribution in
the occipital TMS condition and more central
occipital–pari-etal distribution in the parioccipital–pari-etal TMS condition. High ratings
were also associated with an enhanced LP potential over
pos-terior electrodes for occipital (t
(1,9)⫽ 4.68, p ⫽ 0.001) and
parietal (t
(1,9)⫽ 5.49, p ⬍ 0.001) TMS. These results were also
borne out of the single-trial regression analysis (
Fig. 2
B). In addition
to significant negative correlations in the VAN time range (180 –
220 ms) and positive correlations in the LP time range (300 –
800), the single-trial analyses revealed a robust prestimulus
correlation during the occipital TMS condition. This prestimulus
correlation had a reversing polarity over time, with a period of
⬃100 ms, suggesting that the prestimulus alpha-band phase
in-fluenced phosphene perception. The scalp distributions of these
significant regression parameters highly resemble those attained
from the ERP analysis, with the early (200 ms) effect being
max-imal over occipital–temporal electrodes after occipital TMS and
maximal over central occipital–parietal electrodes after parietal
TMS and the late effect being parietal–maximal in both
stimula-tion condistimula-tions.
Time–frequency power correlates of phosphene perception
The relationship between single-trial phosphene perception and
oscillatory power across time and frequency space is shown in
Figure 3
. The analysis of occipital TMS data revealed a negative
relationship between prestimulus low-frequency power (
⬃5–13
Hz) and perception that had a posterior scalp distribution.
TMS-evoked low-frequency power (
⬃3–6 Hz) between ⬃140 and 400
ms over lateral occipital electrodes was positively correlated with
phosphene perception, whereas later (
⬃250–900 ms) posterior
alpha/beta power was robustly negatively correlated with
per-ceptual ratings. Regarding parietal TMS, no clear effect of
prestimulus low-frequency power was observed; rather,
pre-Figure 3. Time–frequency power correlates of phosphene perception. Maps show regression coefficients relating power at each time–frequency point to single-trial perceptual reports during occipital (top) and parietal (bottom) TMS. Contour lines encompass significant cluster-corrected effects and are color coded according to their corresponding topography, which is dis-played on the right side of the figure. Notably, poststimulus correlates of phosphene perception were highly similar across stim-ulation conditions, whereas prestimulus low-frequency power (3–13 Hz) predicted phosphenes after occipital TMS and prestimulus beta-band power (10 –22 Hz) predicted parietal TMS phosphenes. Note that the prestimulus scalp topographies (green outline) are displayed on a scale of⫾ 0.8. Star denotes stimulation site.
stimulus high-alpha/low-beta power (10 –24 Hz) was negatively
related to phosphene perception. The topography of this effect
was more widespread, with both a posterior and a central–frontal
distribution. The relationship between TMS-evoked power
and phosphene perception after parietal TMS closely
resem-bled that of occipital stimulation: early low-frequency power
was positively predictive of perceptual ratings, followed by a
broadband alpha/beta component that was negatively related
to phosphene perception.
Prestimulus oscillatory power predicts phosphene perception
Figure 4
A shows a complementary analysis of power focused just
on the prestimulus interval to avoid any contamination from
poststimulus, TMS-induced responses (
Zoefel and Heil, 2013
).
Power spectra of prestimulus data from trials with high and low
phosphene ratings show a clear alpha-band peak with a power
that was higher on low perceptual rating occipital TMS trials
(t
(1,9)⫽ ⫺3.82, p ⫽ 0.004). In contrast, during parietal TMS,
prestimulus beta power was significantly lower on trials with high
phosphene presence ratings (t
(1,9)⫽ ⫺2.92, p ⫽ 0.017). A
repeated-measures ANOVA predicting power from phosphene
ratings (low, high), TMS site (occipital, parietal), and frequency
(alpha, beta) revealed a significant 2-way interaction (F
(1,9)⫽
21.15, p
⫽ 0.001), indicating that the effect of power on
phos-phene perception depended on stimulation site and frequency.
The results of the single-trial regression analysis (
Fig. 4
B)
re-vealed a clear distinction between the prestimulus predictors of
phosphenes after occipital and parietal TMS, with broad-band
low-frequency power (3–13 Hz) negatively correlating with
oc-cipital TMS phosphene perception and higher-frequency
beta-band (12–22 Hz) power negatively correlating with parietal TMS
Figure 4. Relationship of prestimulus power and phase with phosphene perception. A, Prestimulus power spectra showing modulation of alpha-band power before occipital TMS and beta-band power before parietal TMS as a function of phosphene perception. Gray windows highlight frequency bands of interest for statistical analysis. Bands are⫾1within-subjectSEM.B,Thissamepattern was borne out of a single-trial regression analysis on prestimulus power, demonstrating negative correlations between low-frequency power and occpital TMS phosphene perception (green line) and between beta-band power and parietal TMS phosphene perception (gray line). The topographies of both effects are maximal over posterior and frontal sensors. C, Example computation of wITPC to relate single-trial phase to perception. Top left, Single-trial prestimulus phase vectors are shown as gray lines and are not clustered across trials due to the randomization of the intertrial interval, leading to a low resultant vector length (i.e., low ITPC). Bottom left, Length of each trial’s phase vector is then weighted by that trial’s phosphene rating (here normalized between 0 and 1) and a weighted ITPC is computed, reflecting the degree of phase–perception correlation. Right, This quantity gets normalized with respect to a null distribution attained by shuffling phosphene ratings across trials. D, Computing normalized wITPC across frequencies revealed that the prestimulus phase in the alpha band (⬃11.6Hz)waspredictiveofphospheneperceptionduringoccipitalTMS.No phase–perception relationship was found for parietal TMS. Shaded portions under each line denote significant cluster-corrected effects.
phosphene perception. The topographies
of the regression coefficients closely
re-sembled those obtained from the time–
frequency analysis described above, with
both having maximal effects over
poste-rior as well as frontal sensors. The
inter-action between stimulation site and
frequency band was assessed with a paired
t test on the double subtraction of
nor-malized beta coefficients during occipital
and parietal TMS between the alpha- and
beta-bands. Consistent with the 2-way
in-teraction reported above, this revealed
that the relationship between prestimulus
power and phosphene perception
de-pended on stimulation site and frequency
(t
(1,9)⫽ 4.74, p ⫽ 0.001).
Prestimulus alpha phase predicts
phosphenes after occipital TMS
Figure 4
C depicts an example of wITPC
computation (
Cohen, 2014
) using a single
subject’s prestimulus alpha phase during
occipital TMS to predict phosphene
per-ception (see “Time–frequency analysis” section for more details).
The results of this procedure applied across frequencies
re-vealed a significant phase–perception relationship in the alpha
band (peak at 11.6 Hz) during occipital TMS, which was
margin-ally larger than that observed during parietal TMS (t
(1,9)⫽ 2.24,
p
⫽ 0.052). This effect was maximal over both occipital and
fron-tal electrodes. No significant phase–perception effects survived
correction for multiple comparisons during parietal TMS. The
effect of prestimulus alpha phase on phosphene reports was
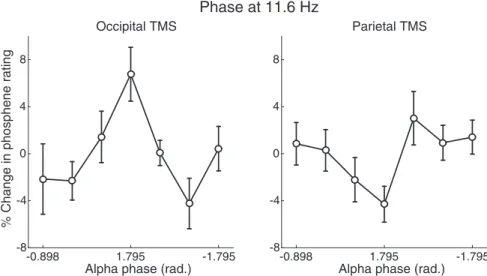
fur-ther demonstrated by binning trials into 7 bins according to
pre-stimulus phase at 11.6 Hz (normalized to percentage change
relative to the mean across all bins). As shown in
Figure 5
, this
revealed a clear modulation of perceptual rating according to
prestimulus phase during occipital TMS (F
(6,54)⫽ 3.23, p ⫽
0.008), but not parietal TMS (F
(6,54)⫽ 1.88, p ⫽ 0.102), as
deter-mined from a one-way ANOVA predicting phosphene reports
from phase bin. A further 2-by-7 ANOVA including an
interac-tion term between phase bin and TMS site revealed a significant
interaction (F
(6,54)⫽ 6.53, p ⬍ 0.001), indicating that the
pre-stimulus alpha phase effect depended on stimulation site.
Al-though this interaction could be driven either by a true lack of a
phase relationship during parietal TMS or by a comparable phase
relationship just centered on a different preferred phase, we think
the latter is unlikely given the lack of significant alpha phase
modulation during parietal TMS in addition to the results of the
between-site difference in the wITPCz analysis, which is
insensi-tive to preferred phase.
Discussion
We applied TMS to occipital and PPC at phosphene thresholds while
recording EEG. We replicated two previous findings demonstrating
a negative relationship between prestimulus alpha power and
phos-phene reports (
Romei et al., 2008a
) and a dependence of phosphene
perception on prestimulus alpha phase (
Dugue´ et al., 2011
).
Nota-bly, when phosphenes were induced through stimulation of PPC, we
found that prestimulus beta-band power (13–20 Hz) was negatively
correlated with phosphene perception and no phase dependence
was observed. TMS-evoked responses differentiated levels of
phos-phene perception⬃180 ms after TMS onset at both stimulation sites
and was associated with an early negativity and a later central parietal
positivity. Time–frequency responses indicated that phosphene
per-ception was associated with increased power in the theta range,
fol-lowed by a sustained decrease of power in the alpha/beta range for
both stimulation sites.
Rethinking alpha power as a general index of cortical excitability
Prevailing theory regards alpha-band oscillations as reflecting
mech-anisms of inhibition that can be routed across brain areas so as to
suppress activity in task-irrelevant neural populations (
Klimesch et
al., 2007
;
Romei et al., 2008b
;
Jensen and Mazaheri, 2010
;
Foxe and
Snyder, 2011
;
Haegens et al., 2011b
;
de Pesters et al., 2016
). Given the
link between alpha dynamics and excitability in occipital (
Romei et
al., 2008a
;
Dugue´ et al., 2011
) and motor cortex (
Zarkowski et al.,
2006
;
Sauseng et al., 2009
) and observations of attentional
modula-tion of alpha power in somatosensory (
Haegens et al., 2011a
),
audi-tory (
Banerjee et al., 2011
), and retinotopic regions (
Worden et al.,
2000
;
Sauseng et al., 2005
;
Samaha et al., 2016b
), it is thought that
alpha oscillations reflect a general mechanism of functional
inhibi-tion across cortex (
Payne and Sekuler, 2014
). Although we replicate
prior findings linking phosphene perception to prestimulus alpha
dynamics during occipital TMS, the finding that prestimulus beta
power was predictive of PPC TMS phosphenes is in direct contrast to
the notion that alpha reflects excitability across all of cortex.
Several lines of evidence also suggest that the idea of alpha as
reflecting inhibition across cortex is overly simplistic. For instance,
visual-evoked multiunit and gamma-band activity in macaque
in-ferotemporal cortex correlate positively with prestimulus alpha
power in the local field potential, which was also found to increase
when attention was paid to visual, as opposed to auditory, input (
Mo
et al., 2011
). Similarly, in humans, predictions about an upcoming
stimulus have been shown to increase alpha power yet result in larger
evoked responses, with the two processes being positively correlated
(
Mayer et al., 2016
;
Samaha et al., 2016a
). A possible explanation for
our finding that prestimulus beta power, rather than alpha,
pre-dicted PPC TMS phosphenes is suggested by recent work reporting
that the dominant frequency evoked by TMS to occipital cortex is
⬃10 Hz, whereas the dominant frequency of the PPC TMS-evoked
response is
⬃20 Hz (
Rosanova et al., 2009
;
Ferrarelli et al., 2012
).
Prestimulus beta dynamics have been shown recently to predict the
global mean field amplitude of the evoked response after parietal
Alpha phase (rad.)
-0.898 1.795 -1.795
% Change in phosphene rating
-8 -4 0 4 8 Occipital TMS
Alpha phase (rad.)
-0.898 1.795 -1.795 -8 -4 0 4 8 Parietal TMS
Phase at 11.6 Hz
Figure 5. Prestimulus alpha phase predicts perception of occipital, but not parietal, TMS phosphenes. To futher inspect the relationship between prestimulus alpha phase and phopshene perception, we sorted trials into 7 bins according to prestimulus phase at 11.6 Hz. This revealed a significant modulation of occipital TMS phosphene ratings of⬃11% (peak to trough), but no significant modulation of parietal TMS phosphene perception. Error bars indicate⫾1 SEM.
TMS (
Kundu et al., 2014
). Therefore, beta-band oscillations may
reflect the dominant frequency of PPC and alpha may reflect the
dominant frequency of occipital cortex. We extend this work by
showing that alpha and beta reflect directly the excitability of
occip-ital cortex and PPC, respectively.
Neural correlates of consciousness and phosphene perception
Phosphene perception for both stimulation sites was associated
with enhanced VAN and LP components in the time domain
(
Fig. 2
). These two components have been studied intensively
using visual stimuli (for reviews, see:
Koivisto and Revonsuo,
2010
;
Railo et al., 2011
;
Rutiku et al., 2016
), but disagreement
about which reflects the neural correlate of consciousness persists
(
Aru et al., 2012
;
Railo et al., 2015
). The LP potential (sometimes
called the P3) has been argued to reflect the neural correlate of
consciousness by proponents of the neuronal global workspace
theory (
Salti et al., 2015
). In this context, the LP is thought to
reflect widespread activation of a network of prefrontal and
pa-rietal regions that comprise the global workspace and underlie
consciousness (
Dehaene and Changeux, 2011
). In contrast, the
VAN is typically distributed over posterior sensors, though it may
have a frontal component as well (
Railo et al., 2015
), and is
ob-served earlier, typically between 180 and 260 ms (
Koivisto et al.,
2008
;
Railo et al., 2015
), although it is often delayed in response to
low-contrast stimuli (
Railo et al., 2011
;
Tagliabue et al., 2016
).
The VAN is sometimes interpreted as reflecting recurrent
pro-cesses in visual cortex hypothesized to underlie awareness
(
Fahrenfort et al., 2007
;
Koivisto et al., 2008
). Support for the
VAN as a correlate of consciousness has come from research
suggesting that attention and/or introspection may account for
the LP, but not VAN, modulation with awareness (
Pitts et al.,
2014b
,
2014a
;
Shafto and Pitts, 2015
) and from work
demonstrat-ing superior decodability of visibility from VAN versus LP time
windows (
Andersen et al., 2016
). Activity in the LP time window,
however, has been shown to contain stimulus specific
informa-tion that covaries with subjective awareness (
Salti et al., 2015
).
In the present study, both components were robustly
corre-lated with phosphene perception in both stimulation conditions.
Although we cannot unambiguously identify the
phosphene-related activity reported here as the VAN and LP components
that have been identified in studies using visual stimuli, we do see
marked similarities in timing, scalp topography, waveform
polar-ity, and the direction of perception-related effects. Because the
waveforms in our study reflect not only proximal (i.e., 40 –100
ms) brain activity induced solely by TMS (i.e., “TMS-evoked
potentials”; TEP), but also perceptual- and cognitive-related
ac-tivity underlying the perceptual experience of phosphenes and
the perceptual decision making processes involved in performing
the task, we would expect perception-related effects beyond the
initial TEP, which is consistent with the timing of visual
aware-ness (
Dehaene and Changeux, 2011
;
Railo et al., 2011
). Although
the timing of the effects that we observed is consistent with
pre-vious ERP correlates of phosphene perception (
Taylor et al.,
2010
;
Dugue´ et al., 2011
;
Bagattini et al., 2015
), we did not
repli-cate the earliest (⬃100 ms) effects observed by
Bagattini et al.
(2015)
.
Interestingly, the topography of LP modulation was maximal
over central–parietal sensors for both stimulation conditions,
whereas the VAN modulation was slightly more pronounced
over lateral temporal– occipital sensors after occipital TMS and
had a central occipital–parietal distribution after PPC TMS, a
pattern closely resembling that observed in a recent ERP
experi-ment with occipital and parietal TMS phosphenes (
Bagattini et
al., 2015
). This implies that the early activity associated with
pho-sphene perception may be generated in nearby but
distinguish-able cortical regions depending on the initial site of stimulation.
This is intriguing because it implies that there may be several,
rather than a single, neural correlates of phosphene perception. It
further suggests that the VAN “component” is not necessarily a
unitary phenomenon reflecting the activation of a single neural
region related to visual awareness. In fact, it has been
demon-strated recently that hemianopic patients with complete loss of
primary visual cortex in one hemisphere are still capable of
per-ceiving phosphenes in their blind field when ipsilesional PPC is
stimulated (
Mazzi et al., 2014
;
Bagattini et al., 2015
). This
strongly undermines the presumed visual– cortical origin of PPC
TMS phosphenes and supports the notion that the VAN
associ-ated with PPC TMS need not be visual– cortical in origin and
need not reflect recurrent processing involving visual cortex,
both of which are often assumed of the VAN component (
Railo et
al., 2011
,
2015
;
Andersen et al., 2016
).
We also found that phosphene perception in both stimulation
conditions was positively related to power in the theta range
be-ginning
⬃140 ms and negatively related to alpha/beta power
ex-tending from 250 ms until the response screen (
Fig. 3
). Whereas
this early positive theta correlation likely reflects the same
phase-locked activity underlying the VAN modulation, which occurs
during the same time frame, the later negative correlation with
alpha/beta power reflects dynamics that are not phase locked with
TMS onset and are thus not observed in the ERP, a signature of a
truly oscillatory neural process (
Cohen and Donner, 2013
).
Post-stimulus alpha/beta desynchronization has long been linked to
perceptual processing (
Pfurtscheller et al., 1994
;
Sewards and
Sewards, 1999
;
Babiloni et al., 2006
) and is thought to reflect
disinhibition of widespread cortical networks involved in
percep-tual inference and decision making (
Klimesch et al., 2007
;
Don-ner and Siegel, 2011
). Here, we show that this well known
signature of perceptual processing extends to phosphene
percep-tion and is strikingly similar regardless of the cortical origin of
stimulation.
References
Andersen LM, Pedersen MN, Sandberg K, Overgaard M (2016) Occipital MEG activity in the early time range (⬍300 ms) predicts graded changes in perceptual consciousness. Cereb Cortex 26:2677–2688. CrossRef Medline
Aru J, Bachmann T, Singer W, Melloni L (2012) Distilling the neural corre-lates of consciousness. Neurosci Biobehav Rev 36:737–746.CrossRef Medline
Babiloni C, Vecchio F, Bultrini A, Luca Romani G, Rossini PM (2006) Pre-and poststimulus alpha rhythms are related to conscious visual percep-tion: a high-resolution EEG study. Cereb Cortex 16:1690 –1700.Medline
Bagattini C, Mazzi C, Savazzi S (2015) Waves of awareness for occipital and parietal phosphenes perception. Neuropsychologia 70:114–125.CrossRef Medline
Banerjee S, Snyder AC, Molholm S, Foxe JJ (2011) Oscillatory alpha-band mechanisms and the deployment of spatial attention to anticipated audi-tory and visual target locations: supramodal or sensory-specific control mechanisms? J Neurosci 31:9923–9932.CrossRef Medline
Busch NA, Dubois J, VanRullen R (2009) The phase of ongoing EEG oscil-lations predicts visual perception. J Neurosci 29:7869 –7876.CrossRef Medline
Cohen MX (2014) Analyzing neural time series data: theory and practice. Cambridge, MA: MIT.
Cohen MX, Cavanagh JF (2011) Single-trial regression elucidates the role of prefrontal theta oscillations in response conflict. Front Psychol 2:30.
CrossRef Medline
Cohen MX, Donner TH (2013) Midfrontal conflict-related theta-band power reflects neural oscillations that predict behavior. J Neurophysiol 110:2752–2763.CrossRef Medline
single-trial human behavior. In: Multiscale analysis and nonlinear dynamics (Pesenson M, Meyer Z, ed), pp. 217–232. New York: Wiley.
Dehaene S, Changeux JP (2011) Experimental and theoretical approaches to conscious processing. Neuron 70:200 –227.CrossRef Medline
Delorme A, Makeig S (2004) EEGLAB: an open source toolbox for analysis of single-trial EEG dynamics including independent component analysis. J Neurosci Methods 134:9 –21.CrossRef Medline
de Pesters A, Coon WG, Brunner P, Gunduz A, Ritaccio AL, Brunet NM, de Weerd P, Roberts MJ, Oostenveld R, Fries P, Schalk G (2016) Alpha power indexes task-related networks on large and small scales: a multi-modal ECoG study in humans and a non-human primate. Neuroimage 134:122–131.CrossRef Medline
Donner TH, Siegel M (2011) A framework for local cortical oscillation pat-terns. Trends Cogn Sci 15:191–199.CrossRef Medline
Dugue´ L, Marque P, VanRullen R (2011) The phase of ongoing oscillations mediates the causal relation between brain excitation and visual percep-tion. J Neurosci 31:11889 –11893.CrossRef Medline
Fahrenfort JJ, Scholte HS, Lamme VA (2007) Masking disrupts reentrant processing in human visual cortex. J Cogn Neurosci 19:1488 –1497.
CrossRef Medline
Ferrarelli F, Sarasso S, Guller Y, Riedner BA, Peterson MJ, Bellesi M, Massi-mini M, Postle BR, Tononi G (2012) Reduced natural oscillatory fre-quency of frontal thalamo-cortical circuits in schizophrenia. Arch Gen Psychiatry 69:766 –774.Medline
Foxe JJ, Snyder AC (2011) The role of alpha-band brain oscillations as a sensory suppression mechanism during selective attention. Front Psychol 2:154.CrossRef Medline
Fried PJ, Elkin-Frankston S, Rushmore RJ, Hilgetag CC, Valero-Cabre A (2011) Characterization of visual percepts evoked by noninvasive stimulation of the human posterior parietal cortex. PLoS One 6:e27204.CrossRef Medline
Garcia D (2010) Robust smoothing of gridded data in one and higher di-mensions with missing values. Comput Stat Data Anal 54:1167–1178.
CrossRef Medline
Haegens S, Ha¨ndel BF, Jensen O (2011a) Top-down controlled alpha band activity in somatosensory areas determines behavioral performance in a discrimination task. J Neurosci 31:5197–5204.CrossRef Medline
Haegens S, Na´cher V, Luna R, Romo R, Jensen O (2011b) ␣-Oscillations in the monkey sensorimotor network influence discrimination performance by rhythmical inhibition of neuronal spiking. Proc Natl Acad Sci U S A 108:19377–19382.CrossRef Medline
Jensen O, Mazaheri A (2010) Shaping functional architecture by oscillatory alpha activity: gating by inhibition. Front Hum Neurosci 4:186.CrossRef Medline
Kammer T, Puls K, Erb M, Grodd W (2005) Transcranial magnetic stimu-lation in the visual system. II. Characterization of induced phosphenes and scotomas. Exp Brain Res 160:129 –140.CrossRef Medline
Klimesch W, Sauseng P, Hanslmayr S (2007) EEG alpha oscillations: the inhibition-timing hypothesis. Brain Res Rev 53:63– 88.CrossRef Medline
Koivisto M, Revonsuo A (2010) Event-related brain potential correlates of visual awareness. Neurosci Biobehav Rev 34:922–934.CrossRef Medline
Koivisto M, La¨hteenma¨ki M, Sørensen TA, Vangkilde S, Overgaard M, Revonsuo A (2008) The earliest electrophysiological correlate of visual awareness? Brain Cogn 66:91–103.CrossRef Medline
Kundu B, Johnson JS, Postle BR (2014) Prestimulation phase predicts the TMS-evoked response. J Neurophysiol 112:1885–1893.CrossRef Medline
Maris E, Oostenveld R (2007) Nonparametric statistical testing of EEG- and MEG-data. J Neurosci Methods 164:177–190.CrossRef Medline
Marzi CA, Mancini F, Savazzi S (2009) Interhemispheric transfer of phos-phenes generated by occipital versus parietal transcranial magnetic stim-ulation. Exp Brain Res 192:431– 441.CrossRef Medline
Massimini M, Ferrarelli F, Huber R, Esser SK, Singh H, Tononi G (2005) Breakdown of cortical effective connectivity during sleep. Science 309: 2228 –2232.CrossRef Medline
Mathewson KE, Gratton G, Fabiani M, Beck DM, Ro T (2009) To see or not to see: pre-stimulus alpha phase predicts visual awareness. J Neurosci 29:2725–2732.CrossRef Medline
Mathewson KE, Lleras A, Beck DM, Fabiani M, Ro T, Gratton G (2011) Pulsed out of awareness: EEG alpha oscillations represent a pulsed-inhibition of ongoing cortical processing. Front Psychol 2:99.CrossRef Medline
Mayer A, Schwiedrzik CM, Wibral M, Singer W, Melloni L (2016) Expect-ing to see a letter: alpha oscillations as carriers of top-down sensory pre-dictions. Cereb Cortex 26:3146 –3160.CrossRef Medline
Mazzi C, Mancini F, Savazzi S (2014) Can IPS reach visual awareness with-out V1? Evidence from TMS in healthy subjects and hemianopic patients. Neuropsychologia 64:134 –144.CrossRef Medline
Merton PA, Hill DK, Morton HB, Marsden CD (1982) Scope of a technique for electrical stimulation of human brain, spinal cord, and muscle. Lancet 2:597– 600.Medline
Mo J, Schroeder CE, Ding M (2011) Attentional modulation of alpha oscil-lations in macaque inferotemporal cortex. J Neurosci 31:878 – 882.
CrossRef Medline
Overgaard M, Rote J, Mouridsen K, Ramsøy TZ (2006) Is conscious percep-tion gradual or dichotomous? A comparison of report methodologies during a visual task. Conscious Cogn 15:700 –708.CrossRef Medline
Pascual-Leone A, Tormos JM, Keenan J, Tarazona F, Can˜ete C, Catala´ MD (1998) Study and modulation of human cortical excitability with trans-cranial magnetic stimulation. J Clin Neurophysiol 15:333–343.CrossRef Medline
Payne L, Sekuler R (2014) The importance of ignoring alpha oscillations protect selectivity. Curr Dir Psychol Sci 23:171–177.CrossRef Medline
Pernet CR, Chauveau N, Gaspar C, Rousselet GA (2011) LIMO EEG: a tool-box for hierarchical linear modeling of electroencephalographic data. Comput Intell Neurosci 2011:831409.CrossRef Medline
Pernet CR, Latinus M, Nichols TE, Rousselet GA (2015) Cluster-based computational methods for mass univariate analyses of event-related brain potentials/fields: a simulation study. J Neurosci Methods 250:85– 93.CrossRef Medline
Pfurtscheller G, Neuper C, Mohl W (1994) Event-related desynchroniza-tion (ERD) during visual processing. Int J Psychophysiol 16:147–153.
CrossRef Medline
Pitts MA, Metzler S, Hillyard SA (2014a) Isolating neural correlates of con-scious perception from neural correlates of reporting one’s perception. Front Psychol 5:1078.CrossRef Medline
Pitts MA, Padwal J, Fennelly D, Martínez A, Hillyard SA (2014b) Gamma band activity and the P3 reflect post-perceptual processes, not visual awareness. Neuroimage 101:337–350.CrossRef Medline
Railo H, Koivisto M, Revonsuo A (2011) Tracking the processes behind conscious perception: a review of event-related potential correlates of visual consciousness. Conscious Cogn 20:972–983.CrossRef Medline
Railo H, Revonsuo A, Koivisto M (2015) Behavioral and electrophysiological evi-dence for fast emergence of visual consciousness. Neurosci Conscious Available from: https://www.researchgate.net/publication/280572811_Behavioral_and_ electrophysiological_evidence_for_fast_emergence_of_visual_consciousness.
Accessed August 19, 2015.
Ramsøy TZ, Overgaard M (2004) Introspection and subliminal perception. Phenomenol Cogn Sci 3:1–23.CrossRef
Romei V, Brodbeck V, Michel C, Amedi A, Pascual-Leone A, Thut G (2008a) Spontaneous fluctuations in posterior␣-band EEG activity reflect vari-ability in excitvari-ability of human visual areas. Cereb Cortex 18:2010 –2018.
CrossRef Medline
Romei V, Rihs T, Brodbeck V, Thut G (2008b) Resting electroencephalo-gram alpha-power over posterior sites indexes baseline visual cortex ex-citability. Neuroreport 19:203–208.CrossRef Medline
Rosanova M, Casali A, Bellina V, Resta F, Mariotti M, Massimini M (2009) Natural frequencies of human corticothalamic circuits. J Neurosci 29: 7679 –7685.CrossRef Medline
Rutiku R, Aru J, Bachmann T (2016) General markers of conscious visual per-ception and their timing. Front Hum Neurosci 10:23.CrossRef Medline
Salti M, Monto S, Charles L, King J-R, Parkkonen L, Dehaene S (2015) Dis-tinct cortical codes and temporal dynamics for conscious and uncon-scious percepts. eLife 4.CrossRef Medline
Samaha J, Bauer P, Cimaroli S, Postle BR (2015) Top-down control of the phase of alpha-band oscillations as a mechanism for temporal prediction. Proc Natl Acad Sci U S A 112:8439 – 8444.CrossRef Medline
Samaha J, Boutonnet B, Lupyan G (2016a) How prior knowledge prepares perception: prestimulus oscillations carry perceptual expec-tations and influence early visual responses. Available from:http:// biorxiv.org/content/biorxiv/early/2016/09/21/076687.full.pdf. Acce-ssed October 17, 2016.
focus of spatial attention from the topography of alpha-band oscillations. J Cogn Neurosci 28:1090 –1097.CrossRef Medline
Sauseng P, Klimesch W, Stadler W, Schabus M, Doppelmayr M, Hanslmayr S, Gruber WR, Birbaumer N (2005) A shift of visual spatial attention is selectively associated with human EEG alpha activity. Eur J Neurosci 22:2917–2926.CrossRef Medline
Sauseng P, Klimesch W, Gerloff C, Hummel FC (2009) Spontaneous locally restricted EEG alpha activity determines cortical excitability in the motor cortex. Neuropsychologia 47:284 –288.CrossRef Medline
Sewards TV, Sewards MA (1999) Alpha-band oscillations in visual cortex: part of the neural correlate of visual awareness? Int J Psychophysiol 32: 35– 45.CrossRef Medline
Shafto JP, Pitts MA (2015) Neural signatures of conscious face perception in an inattentionalblindnessparadigm.JNeurosci35:10940–10948.CrossRefMedline
Smith SM, Nichols TE (2009) Threshold-free cluster enhancement: ad-dressing problems of smoothing, threshold dependence and localisation in cluster inference. Neuroimage 44:83–98.CrossRef Medline
Tagliabue CF, Mazzi C, Bagattini C, Savazzi S (2016) Early local activity in
temporal areas reflects graded content of visual perception. Front Psychol 7:572.CrossRef Medline
Tapia E, Mazzi C, Savazzi S, Beck DM (2014) Phosphene-guided trans-cranial magnetic stimulation of occipital but not parietal cortex sup-presses stimulus visibility. Exp Brain Res 232:1989 –1997.CrossRef Medline
Taylor PC, Walsh V, Eimer M (2010) The neural signature of phosphene perception. Hum Brain Mapp 31:1408 –1417.CrossRef Medline
Worden MS, Foxe JJ, Wang N, Simpson GV (2000) Anticipatory biasing of visuospatial attention indexed by retinotopically specific␣-band electroen-cephalography increases over occipital cortex. J Neurosci 20:RC63–RC63.
Medline
Zarkowski P, Shin CJ, Dang T, Russo J, Avery D (2006) EEG and the vari-ance of motor evoked potential amplitude. Clin EEG Neurosci 37:247– 251.CrossRef Medline
Zoefel B, Heil P (2013) Detection of near-threshold sounds is independent of EEG phase in common frequency bands. Front Psychol 4:262.CrossRef Medline