MASTERS DEGREE IN MARINE SCIENCES - MARINE RECOURSES SPECIALIZATION IN AQUACULTURE AND FISHERIES
Phosphorus in fish farms – Quantification in
marine, freshwater and fish feed
Benbernou Fatima zohra batoul
M
Benbernou Fatima zohra batoul
Quantification of Phosphorus species, total phosphorus and
phosphates in marine and freshwater samples and in fish feed
from fish farms using spectrophotometry.
Application to Masters Degree in Marine Sciences - Marine Resources, Specialization in Aquaculture and Fisheries, Submitted to the Institute of Biomedical Sciences Abel Salazar of Porto University.
Supervisor - Maria Antonia Salgado Category - Professor
Affiliation - Institute of Biomedical Sciences Abel Salazar, Porto University; Interdisciplinary Centre of Marine and Environmental Investigation.
i Index
I. Introduction ... 1
1. Aim of the study ... 3
2 Thesis organization ... 3
3. Phosphorus ... 4
3.1 Phosphate production and world resources ... 5
3.2 Forms of phosphorus ... 8
3.3 Forms of phosphorus ... 9
3.4 Sources of Phosphorus ... 10
3.5 Phosphorus cycle ... 11
3.6 Phosphorus solubility ... 13
3.7 Why is phosphorus in water important? ... 14
3.8 Phosphates in living organisms ... 15
3.9 Importance of phosphorus and water pollution ... 16
3.10 Eutrophication ... 16
3.11 Phosphorus in aquaculture fish farms ... 20
3.12 Phosphorus Remediation actions ... 22
II. Analytical Methodology ... 24
1. Theory of spectrophotometric method ... 24
1.1 Reagents used in this method: ... 25
2. Forms of P: particulate P and dissolved P ... 25
2.1 Dissolved inorganic & organic P : ... 26
2.2 Particulate inorganic & organic P ... 26
3 Techniques of analysis of phosphorus ... 26
4. Determination of phosphorus ... 27 5 Digestion ... 27 6 Analytical method ... 27 6.1 Water sampling ... 27 6.2 Materials ... 27 6.3 Glassware ... 28
6.4 Reagents and solvents ... 28
ii
7.1 Fresh and Marine water: ... 29
7.2 Analysis of PO43-: ... 32
7.3 Analysis of fish feed ……….. 33
7.4 Testing the concentration working range for the quantification of PO43- ... 34
8. Determination of LOD and LOQ and legal limits ... 35
9. control charts ... 36
III. Results and discussion ... 37
Analysis of total phosphorus and PO43- in fresh and marine water and fish feed by colorimetric technique... 37
1. Calibration curve for total phosphorus and PO43- analysis ... 37
2.Test the recovery of the limit of detection and two control standards... 40
3. Analysis of Total phosphorus and PO4-3 in fresh and marine waters ... 44
3.1 Freshwater: ... 45
3.2 Marine water ... 50
3.3 Difference between fresh and marine water concentration ... 52
4.Analysis of Total phosphorus and PO4-3 in fish‘s feed suspension water ... 53
4.1 P total analysis: ... 53
4.2 PO43-analysis: ... 55
IV. Conclusions ... 57
iii
List of figures
Figure 1: Phosphorus in the periodic table ... 4
Figure 2: Geographic map of the Phosphate production and world resources ... 8
Figure 3: Forms of P in water(Hao et al. 2008). ... 10
Figure 4: Phosphorus cycle in the environment (from Chambers et al. 2001) ... 11
Figure 5: Phosphate species distribution in water of varying pH (from Gibbons 2009) ... 13
Figure 6: Lake Eutrophication ... 17
Figure 7: Eutrophication process ... 18
Figure 8: Cultural eutrophication ... 18
Figure 9: Standard Curve for total phosphorus analysis ... 39
Figure 10: Standard Curve for PO43- analysis ... 39
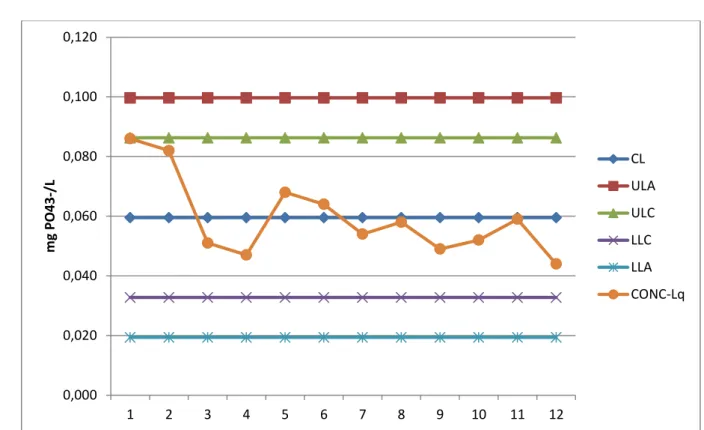
Figure 11: control chart method for the quantification limit concentration of PO4-3 for 12 determinations ... 44
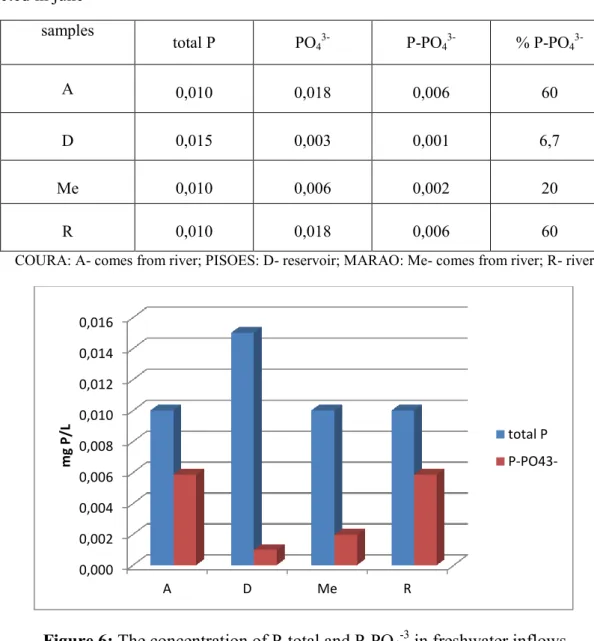
Figure 12: The concentration of P-total and P-PO4-3 in freshwater inflows ... 46
Figure 13: Percentage of P in PO43- in the total P of the different freshwater samples ... 47
Figure 14 : The concentration of P-total and P- PO4-3 in outflows ... 48
Figure 15: Percentage of P from PO43- in total P outflow fresh water samples ... 48
Figure 16: The concentration of P-total and P- PO4-3 in marine water samples ... 50
Figure 17: Percentage of P in PO43- and total P in the 3 types of marine water ... 51
Figure 18: The concentration of P-total and P- PO4-3 in fresh and marine water samples ... 52
Figure 19: Percentage of P in PO43- in fresh and marine water samples ... 53
Figure 20: Comparing between the concentration of P total and dissolved P in different size 54 Figure 21: Concentration of the particulate P in different size ... 55
iv
List of tables
Table 1: Classes of phosphorus containing compounds of importance in aquatic
systems(From Snoeyink and Jenkins 1980) ... 5
Table 2: World Mine Production and Reserves (Kimball& Jewell, 2016) ... 7
Table 3: Typical nutrient levels in aqueous systems (adapted from Corbridge 2000) ... 12
Table 4 -preparation of 6 standards, in 100mL + blank (0) ……… 29
Table 5: percentage of phosphorus in grain size ... 33
Table 6: Calibration data for total phosphorus analysis by spectrophotometry ... 37
Table 7: Calibration data for PO43- analysis by spectrophotometry ... 38
Table 8: Testing the recoveries of 3 control standards ... 41
Table 9: Worksheet showing the data necessary to produce a control chart for the Lq ... 42
Table 10: woksheet showing the calculations to produce a control chart for the Lq ... 43
Table 11: Analytical Total Phosphorus Concentration of freshwater samples (mg P/L) ... 44
Table 12: Analytical PO43- Concentration of freshwater samples (mg P/L) ... 45
Table 13: Analytical Total Phosphate Concentration of marine water samples (mg P/L) ... 45
Table 14: Analytical PO43- concentration of marine water samples (mg PO43-/L) ... 45
Table 15: Concentration of total P, PO43- (mg/L) and the equivalent concentration of P derived from PO43-, (mg P- PO43-/L) and percentage of P- PO43- in total P in freshwater samples collected in june ... 46
Table 16: Concentration of P-total, PO43-/L and the equivalent concentration expressed as P derived from PO43-, (mg P- PO43-/L) in the outflow samples ... 47
Table 17: Concentration of P-total, PO43-/L and the equivalent concentration expressed as P derived from PO43-, (mg P- PO43-/L) and percentage of P- PO43- in total P ... 50
Table 18: Concentrations of P forms and percentages of P- PO43- in total P for all water samples ... 52
Table 19: concentration of P total and dissolved P in fish feed pellets of different size ... 53
Table 20: percentage of particulate P in different sizes ... 54
v
List of abbreviations
((NH4)6Mo7O2 )4•∙4H2O) :Ammoniummolybdate
(K(SbO)C4H4O6•∙½H2O): Antimony potassium tartrate
ADP: Adenosinediphosphate Al: Aluminum amu: Atomicmassunite ATP: Adenosinetriphosphate C10H14N5PO7 :Adenilicacid C6H8O6: Ascorbic acid Ca: Calcium
DIP: Dissolved inorganic P DNA: Deoxyribonucleic acid DOP: Dissolved organic P
DRP: Dissolved reactive phosphorus, Fe :Iron
H2PO4- : Dihydrogen phosphate
H2SO4: Sulfuric acid
H3PO4: Phosphoric acid
HPO42- : Hydrogen phosphate
K2S2O8: Potassium persulfate
KH2PO4: Monopotassium phosphate
LOD: Limit of detection LOQ: Limit of quantification Mg: Magnesium
MM: Molecular mass
N/P: Nitrogen/phosphorus ratio N: Nitrogen
vi P: Phosphorus
P2O5: Phosphorus pentoxide
PD: Digestion standard Pi: Inorganic phosphorus Po: Organic phosphorus
PO43-: Phosphate
PP: Particulate P
Rc: Recovery of standard TDP: Total dissolved P
TN: TP: Total nitrogen / total phosphorus TP: Total phosphorus
vii
Acknowlegments
Above all, I first address my sincere thanks to God; our creator (GOD) has always guided us. First of all I want to express my deep appreciation to my supervisor, Mrs. MARIA ANTONIA SALGADO, Professor at the University of Porto, for her time, advice, availability and for her help in writing this thesis.
I extend my warm thanks to Mr. EDUARDO ROCHA, Professor at Porto University, for hosting me in the Master Science, Marine Sciences - Marine Resources at ICBAS and join the course during the year.
I specially want to thank Mr. LUIS VIEIRA, Professor at Porto University for agreeing to be examiner of my work.
I also thank all members of the Chemistry Laboratory including the head of the department and all those who contributed to the progress of this thesis.
My special thanks go to my mother my father, my brothers, my friends, for their support and all they have done for me. They sacrificed a lot to give me all the necessary conditions so that I can become what I am.
viii
Abstract
Phosphorus (P) is very important for plant growth and is a key element in animal‘s many physiological and biochemical processes. However, the excess of phosphorus in waters causes eutrophication which in turn causes the death of aquatic life due to the decrease of dissolved oxygen levels. To control eutrophication, total phosphorus is recommended to be no more than 0.05 mg/L in streams that enter lakes and 0.1 mg/L in flowing waters.
This work aims to determine total phosphorus and PO4-3 in marine water, freshwater from fish
farms and fish feed using the ascorbic acid method followed by spectrophotometric
quantification. The calibration curves of both total P and PO4-3 were performed and the R2
values were 0.999 for both. The analysis of water from different fish farms was carried out.
The results show that the marine waters have a higher concentration of P and PO4-3 than
freshwaters. The total P and PO4-3 in the fish farm‘s outflow water is higher compared to the
inflow water specially in the case of marine water. However, all the concentrations found were below the Portuguese legal limits for the kind of water analyzed. On the other hand, the analysis of the fish feed water suspension simulating feed waste, showed that dissolution of
both P and PO4-3 increased with time and the contribution of particulate P was high.
Finally, the results of this work show the high efficiency of ascorbic acid method to quantify
the total P and PO4-3 in water samples. This method could be used to control the P content as
well as the eutrophication of waters.
Keywords: Phosphorus, Eutrophication; Inflow; Outflow;Ascorbic acid method;
1 I. Introduction
Phosphorus (P) is a naturally occurring element that can be found in the earth‘s crust, water, and all living organisms. Phosphorus (P) is one of 16 elements that are essential for plant growth and a key element in animal‘s many physiological and biochemical processes (Lin, Litaker, and Sunda 2016). In order to allow all living organisms to grow and reproduce in healthy conditions, the phosphorus must be present in their feed supply (Hernandez & Munne-Bosch, 2015; Visanuvimol & Bertram, 2011).
In the plant, phosphorus is essential for a number of physiological functions that are involved with energy transformations. Phosphorus is a component of many cell constituents and plays a major role in several key processes, including photosynthesis, respiration, and energy storage and transfer, cell division, and cell enlargement. Adequate supply of phosphorus is needed for the promotion of early root formation and growth, seed formation and crop quality improvement.
Animals also require phosphorus as their bones and teeth component and it is necessary for proper growth. Animals derive their phosphorus needs from plant products and feed supplements.
Phosphorus does not usually exist isolated in nature; it is always combined with other elements to form inorganic phosphates or organic compounds of phosphorus such as phospholipids or DNA. Phosphorus can form very complex compounds and more than one form of phosphate can be found in soils, waters, plants, animals and human beings (Sigua et
al,. 2010).
The sources of phosphorus compounds in waters and wastewaters are several, including agricultural fertilizers, domestic wastewater, detergents, industrial process wastes, geological formations and fish farming. Fish farming has gained increased importance as an efficient method of producing animal protein, as compared to beef production and in relieving the heavily exploited natural fish communities (Beveridge et al., 1994; Naylor et al., 2000;1998;). However, fish farming can also contribute to the release of phosphorus through the effluents into the immediate surroundings.
2 There are three basic forms of phosphorus that can be found in wastewaters, the Orthophosphates, Polyphosphates, and Organic phosphates. If an excess of phosphorus compounds enter the waters, algae, and aquatic plants will grow wildly, choke up the waterway and use up large amounts of oxygen. This condition is known as eutrophication or over-fertilization of receiving waters. This rapid growth of aquatic vegetationproduce algal blooms, that eventually die and as theydecay theyuse up oxygen.
This process in turn causes the death of aquatic life due to the decrease of dissolved oxygen levels (Beveridge et al., 1994; Naylor et al., 2000; 1998). Eutrophication is a natural aging process of a body of water such as a bay or lake. This process results from the increase of nutrients within the body of water which, in turn, create plant growth (figure 8).The plants die more quickly than they can be decomposed. This dead plant matter builds up and together with sediment entering the water, they fill- in the bed of the bay or lake making it shallower. Public awareness of eutrophication and the need for solutions has dramatically increased when people exposed to a highly toxic volatile chemical produced by a dinoflagellate, after an algal bloom episode, suffered neurological damage.
Eutrophication was recognized as a water-pollution concern in the world. To control eutrophication, the United States Environmental Protection Agency (USEPA) has recommended a limit of 0.05 mg/L for phosphates in streams that enter lakes and 0.1 mg/L for total phosphorus in flowing waters (Litke, 1999).
Phosphorus should be removed from wastewater because it provides a nutrient food source for algae to grow giving rise to taste and odor problems in drinking water supplies and to fast eutrophication of the aquatic environment. The three methods of P removal are: chemical precipitation (Takacs et al., 2006), adsorption of phosphorus (Ying Wang et al., 2016) and biological removal (Xiongliu Zheng, et al. 2004)
3 1. Aim of the study
The main objectives of this work are,
To measure the concentration of two phosphorus species: total phosphorus and inorganic dissolved orthophosphates in different types of water, marine and freshwater and in the inflow and outflow water from fish farms. To investigate the relative contribution of each form of phosphorus in each type of water and in fish feed wasted.
To use the spectrophotometric technique to quantify phosphorus as well as using quality control of results
2 Thesis organization
This dissertation is organized in four chapters,
The first chapter is dedicated to a review of the knowledge on the importance of
phosphorus for living organisms and in the environment. The different species of phosphorus are described, their role and sources and the environmental effects that may occur when there is an excess of phosphorus in water bodies.
The second chapter describes the methodology employed for the analysis of
phosphorus and phosphates in fresh and marine water, in the inflow and outflow water from fish farms and in fish feed wasted.
The third chapter of the thesis presents the results obtained including their quality
control and discussion.
4 3. Phosphorus
Phosphorus (P) is a non-metallic element which has the atomic number 15 and atomic weight 30.974 amu. It is a ubiquitous element within living cells and the surrounding environment. Phosphorus is highly reactive, especially under oxidizing conditions, and is never found in the
free form in nature but almost always in its fully oxidized state as phosphate(PO4
3-).(Corbridge 2000).
Figure 1: Phosphorus in the periodic table
A significant source of P in the environment is from phosphate rock which contains the impure tri-calcium phosphate mineral, apatite (Environment Canada 2004).
Due to the reactivity of phosphate it bonds with many cations of iron (Fe), aluminum (Al), and calcium (Ca) which form relatively insoluble compounds. The most common P compounds are oxydized phosphorus, compounds that contain phosphorus - oxygen chemical bonds (Corbridge 2000). Oxydized phosphorus compounds include orthophosphates, condensed phosphates, and organic phosphate esters (phosphorus - oxygen - carbon bonds). Common classes of phosphorus-containing compounds in aquatic systems are shown in Table1
5
Table 1: Classes of phosphorus-containing compounds of importance in aquatic systems
(From Snoeyink & Jenkins 1980)
group Species of Importance
Orthophosphate H3PO4, H2PO4-, HPO42-, PO43-, HPO42-complexes Polyphosphates Pyrophosphate Tripolyphosphate H4P2O7, H3P2O7-, H2P2O72-, HP2O73-, P2O74-, HP2O73- complexes H3P3O102-, H2P3O103-, HP3O104-, P3O105-, HP3O104- complexes Metaphosphates HP3O92-, P3O9
3-3.1Phosphate production and world resources
World phosphate production from rocks is expected to increase from 223 million tons in 2015
to 255 million tons in 2019 (Kimball & Jewell, 2016). World consumption of P2O5 contained
in fertilizers and industrial uses is projected to increase gradually from 43.7 million tons in 2015 to 48.2 million tons in 2019. Africa and the Middle East are the leading areas of growth production. In Morocco and Saudi Arabia, new mining and phosphate-processing complexes are underway to be built to further expand this production. Other countries wishing to exploit this resource, Algeria, Australia, Brazil, China, Egypt, Jordan, Kazakhstan, Peru, Russia, and Tunisia, including Namibia with offshore mining projects, have to wait for approval until the potential effects of this activity, on fishing industry and on the environment, are studied.
6 World resources of phosphate rock are more than 300 billion tons.Some world reserves were reported only in terms of ore and grade but phosphate rock resources occur principally as sedimentary marine phosphorites and the continental shelves and the seamounts in the Atlantic Ocean and the Pacific Ocean have large resources. The largest sedimentary deposits are found in northern Africa, China, the Middle East, and the United States. Significant igneous occurrences are found in Brazil, Canada, Finland, Russia, and South Africa.
7
Table 2: World Mine Production and Reserves (Kimball & Jewell, 2016)
Mine production Reserves
2014 2015 United states Algeria Australia Brazil China5 Egypt India Iraq Israel Jordan Kazakhstan Mexico
Morocco and Westem Sahara Peru Russia Saudi Arabia Senegal South Africa Syria Togo Tunisia Vietnam Other countries 25,300 1,500 2,600 6,040 100,000 5,500 1,110 200 3,360 7,140 1,600 1,700 30,000 3,800 11,000 3,000 900 2,160 1,230 1,200 3,780 2,700 2,370 27,600 1,200 2,600 6,700 100,000 5,500 1,100 200 3,300 7,500 1,600 1,700 30,000 4,000 12,500 3,300 1,000 2,200 750 1,000 4,000 2,700 2,600 1,100,000 2,200,000 1,000,000 320,000 3,700,000 1,200,000 65,000 430,000 130,000 1,300,000 260,000 30,000 50,000,000 820,000 1,300,000 960,000 50,000 1,500,000 1,800,000 30,000 100,000 30,000 380,000 World total (rounded) 218,000 223,000 69,000,000
8
Figure 2: Geographic map of the Phosphate production and world resources
3.2Species of phosphorus correct in the index
Orthophosphate (H3PO4, H2PO4-, HPO42-, PO43-)
Forms of P can be dissolved or particulate, available as organic or inorganic forms and interact dynamically in biological or chemical mediated processes in solution and in the sediment (Sondergaard et al., 2001).
The dissolved forms of P are commonly inorganic orthophosphate (PO43-) and organic P
bound in organisms, while the particulate P can be bound in different metals (such as Fe, Al and Ca), or directly adsorbed to clay minerals (Sondergaard et al., 2001). The most bioavailable P i.e. readily assimilated forms are the dissolved phosphates, which anions vary
with pH (H2PO4-, HPO42-, PO43- (Reddy & DeLaune, 2008)), while the particulate forms are
less accessible and need physical, biological or chemical alterations before they are available to non-filter feeders organisms (Ryding, 1985).
Phosphorus may occur in water in two phases: a particulate phase and a dissolved phase. Particulate phase includes living and dead plankton, precipitates of phosphorus, phosphorus adsorbed to particulates, and amorphous phosphorus. The dissolved phase includes inorganic
9 phosphorus, organic phosphorus excreted by organisms, and macromolecular colloidal phosphorus.
The first form of phosphate—orthophosphate—is produced by natural processes such as decay and biological metabolism and is found in sewage. This very useful form of phosphorus is the one used by plants and animals for growth. The second form of phosphate— polyphosphate—is used for treating boiler waters and are found in many household detergents and soaps. In water, they change into the ortho form. Organic phosphates are important in nature. Their occurrence may result from the breakdown of organic pesticides which contain phosphates. They may exist in solution, as particles, loose fragments or in the bodies of aquatic organisms. (Kotoski, 1997).
3.3 Forms of phosphorus
3.3.1 Forms in soil:
There are several forms of P in soils that can be categorized into two groups, organic P (Po) and inorganic P (Pi).
Organic P can account for 5-95% of the TP in the soil. Soil Po is derived mainly
from manures, plant material, and products of microbial decomposition.
The Pi fraction of TP originates from the addition of inorganic fertilizers, manures and
weathering of primary minerals such as apatite and secondary minerals such as Ca and/or Mg phosphates and Fe and Al phosphates (Sylvia et al. 2005; Morgan 1997).
3.3.2 Forms in Water:
Total P, total dissolved P (TDP), dissolved reactive phosphorus DRP, and particulate P (PP) (figure 4) are typically measured when researchers are investigating P transport from soil into water and thesubsequent water pollution. Each of these forms differs in the degree to whichtheir measurement can infer potential and actual consequences in waterways.Most farmers do agronomic soil test to determine the state of their soil nutrientlevels. Sometimes these soil tests are used for environmental interpretationspotentially leading to faulty conclusions. Agronomic test do not consider the Poin the soil which can be as damaging as Pi once in a surface water system.
Total P is a measurement of all the P within a water sample including thesoluble inorganic and organic forms and the particulate forms (Hao et al. 2008).
10
Figure 1: Forms of P in water. (from Hao et al. 2008).
3.4 Sources of Phosphorus
The non-point sources of phosphorusinclude: natural decomposition of rocks and minerals, storm water runoff, agricultural runoff, erosion and sedimentation, atmospheric deposition, and direct input by animals/wildlife; whereas the point sources may include: wastewater treatment plants and permitted industrial discharges. Under normal water flows, roughly 65% of the total phosphorus load to lakes and rivers comes from non-point sources such as runoff from pasture and croplands. Plants may not be able to utilize all of the phosphate fertilizer applied; as a consequence, much of it is lost from the land through erosion, since phosphate has a stronger affinity to binding with the soil compared to nitrogen.
The phosphate enters the ecosystem and becomes tied up in the biogeochemical system where it is recycled. (Kotoski, 1997) (Figure 5)
11 3.5Phosphorus cycle
In aquatic systems P occurs in three forms: dissolved inorganic P, dissolved (soluble) organic
P and particulate organic P. Aquatic plants require inorganic P, typically as PO43-, for
nutrition. As much as 95% of P in freshwater occurs as organic phosphates, components of cells within organisms, and within or adsorbed to inorganic and dead particulate organic material (Environment Canada 2004). Phosphorus enters freshwater from atmospheric precipitation, point sources such as wastewater treatment plants, and non-point sources such as storm water and agricultural runoff. The phosphorus cycle is shown in Figure 5.
Figure 2: Phosphorus cycle in the environment(from Chambers et al. 2001)
The two largest contributors to excess nutrients in aquatic systems are agricultural runoff and domestic wastewater (Corbridge 2000). High P concentrations in agricultural runoff typically arise from increased fertilizer use while human excrement and increased detergent use contribute to high P concentrations in domestic wastewater. Typical phosphorus levels in aqueous systems are shown in Table 3. Since domestic wastewater is a point source of pollution opposed to agricultural runoff being a non-point source, it is typically where P reduction efforts are imposed since point sources are easier to control (Corbridge 2000).
12
Table 3: Typical nutrient levels in aqueous systems (adapted from Corbridge 2000)
Water Source P (mg/L)
Agricultural drainage water 1
Domesticwastewater 10
Treatedsewage effluent 5
Rain water 0.001
Lake water (with nutrient input)
0.03
River water 1
The levels and forms of phosphorus present in the environment are non-toxic to aquatic life but can cause eutrophication. The effects of phosphorus are not purely negative therefore aquatic systems adapt to different conditions. The management goals and objectives as well as the water quality and desired uses of the water system are important factors when determining an acceptable phosphorus content level. It is therefore difficult, and not reasonable, to have a single guideline value for phosphorus in freshwater systems. The Portuguese legislation sets the limit of 10 mg P/L in wastewaster; 3 mg P/L in water that feed lagoons and reservoirs and 0.5 mg P/L in lagoons and reservoirs (Decreto Lei nº 236/98).
Overall, there are four steps in the phosphorus cycle as follows:
1-Weathering and erosion move phosphates from rocks into soil, lakes, and rivers. 2-Leaching and runoff carry dissolved phosphates to the ocean
3-Phosphorus precipitates and settles as deposits along continental margins
4-Slow movements of Earth‘s crust uplift deposits onto land, where weathering releases phosphates from rocks.
13 Regarding the phosphorus runoff, fertilizers are one of the causes of water quality decrease when they runoff into rivers or percolate into groundwater. In fact, agriculture (including livestock agriculture) is the largest source of nonpoint water pollution. The runoff of phosphate (and nitrate) into lakes and streams fertilizes them, and causes accelerated eutrophication or enrichment of the waters. Urban and industrial runoff and sewage discharges also contribute to eutrophication. These are largely point sources though, and have been easier to control than nonpoint, diffuse sources such as agricultural runoff. (Shaw et al.,2003).
3.6Phosphorus solubility
The solubility of phosphorus is greatest between pH 4.5 and 7, and the dominant species are
then H2PO4- (Figure 5). When the pH is outside the range of greatest solubility, phosphorus
will form insoluble precipitates with available iron/aluminium and calcium/fluoride respectively (vanLoon & Duffy, 2011). At low pH aluminium and iron become soluble, and the concentration of these cations in soil solution increase.
The dominant form of orthophosphate present in water is controlled by the pH of the solution (Stumm & Morgan, 1995) as shown in Figure 5
14 Phosphorus is often limiting to both aquatic and terrestrial plants because of its low solubility in water and its low mobility in the soil.
Phosphorus solubility is restricted by reactions with aluminium (Al) and iron (Fe) oxides/hydroxides and calcium (Ca) and magnesium (Mg) compounds at low and high pH, respectively. (Tinker & Nye, 2000).
P concentrations in soil solution can range from 0.001mg P L-1 in very infertile soils to 1 mg
P L-1 in very fertile soils, but are 0.05 mg P L-1 on average (Paul & Clark, 1996).
3.7 Why is phosphorus in water important?
Phosphorus is one of the key elements necessary for the growth of plants and animals, it is the
backbone of oxidative phosphorylationand DNA and in lake ecosystems it tends to be the
growth-limiting nutrient.
The presence of phosphorus is often scarce in the well-oxygenated waters and its low level limits the production of freshwater systems (Ellison & Brett 2006). Unlike nitrogen, phosphate is retained in the soil by a complex system of biological uptake, absorption, and mineralization. Phosphates are not toxic to humans or animals unless they are present in very high levels (Davis, et al., 2015).
The soluble or bioavailable phosphate is then used by plants and animals. Therefore, the availability of phosphorus is a key factor controlling photosynthesis (Hernandez & Munne-Bosch, 2015).
The importance of phosphates, make them an essential nutrient. Animals easily meet their phosphate needs by eating other living things. Plants, on the other hand, must absorb phosphate from the ground and often have difficulty getting enough. To make up this deficiency, most fertilizers, whether for house plants or commercial crops, include phosphate. Although phosphorus at concentrations found in natural waters is not toxic to humans or other animals, it may still have a significant impact on the living organisms in a lake or stream. This is because phosphorus is often the nutrient that limits how much plant growth occurs in a water body. Therefore, even a small amount of additional phosphorus, especially in its inorganic dissolved form, may lead to excess plant growth. Too many aquatic plants in a stream or lake can cause various problems:
15
When aquatic plants die, the natural decaying process consumes oxygen that is
dissolved in the water. An overabundance of dead plants may use up oxygen faster than it can be replenished (for example, in a frozen lake with no contact to the atmosphere). When this occurs, oxygen concentrations may drop to dangerous levels for fish and other aquatic animals. As a result, fish kills are common in waters that are over-enriched with phosphorus and other nutrients.
Large attached plants in shallow areas of lakes can entangle boats and swimmers. In
addition, huge mats of decaying plants create odor and aesthetic problems.
Blooms of microscopic algae can make the water cloudy and unsightly.
Certain types of microscopic algae can be toxic if they reach high concentrations.
Animals, such as dogs or livestock, that drink from these toxic water bodies can become sick or even die. (Mesner & Geiger,2010).
3.8 Phosphates in living organisms
All living organisms require phosphate to make two of the most important organic macro-molecules: deoxyribonucleic acid (DNA) and adenosine triphosphate (ATP). As already mentioned in the living cell phosphorus plays a decisive role in three different essential structures:
- In the cell membrane, phospholipids
- In the storage and retrieval system for genetic information, DNA and RNA - In the energy system, ATP
The cell membrane consists of chains of fatty acids, the molecules of which contain 16 to 20 carbon atoms and a phosphate group at the end: the so-called phospholipids. The direct function of the phosphate group is to provide the essential orientation of the phospholipids, which in turn gives the cell membrane its fundamental characteristics (Butusov & Jernelöv, 2013).
The role of phosphate in DNA and RNA is to form, together with a pentose sugar and a nitrogen base, the ―backbone‖ of the molecule. It links the nucleotides together to form DNA (Butusov & Jernelöv, 2013).
ATP is a coenzyme that carries out most of the intracellular energy transport. Energy is stored in cells in carbohydrates such as glycogen and in fat. When energy is needed, these
16 compounds are oxidized and energy is moved from the storage molecules to adenosine phosphate. In the most common reaction, this energy capture occurs when adenosine diphosphate (ADP) adds another phosphate group to form ATP (Butusov & Jernelöv, 2013). Phosphorus in vertebrate animals is an important component in cartilage, bone, and teeth enamel and an adequate supply must be obtained from their food and feeding stuffs. Phosphorus deficiency affects many of the essential processes on which the life of an animal depends, weak bones and impaired fertility are some of the problems deriving from P deficiency.
3.9 Importance of phosphorus and water pollution
Although significantly present in soils, the proportion of phosphorus available varies, but usually remains low, which explains the use of mineral fertilizers to enrich the soil solution for plant growth. (Deronzier & Choubert, 2004). The assimilation by plants is the first and the main door of phosphorus input, by natural means, into the food chain. (Jongbloed, 2000).
The average phosphorus concentration in wastewater is 10 to 20 mg.L-1 where 60 to 85% is in
dissolved form (Deronzier & Choubert, 2004)
In Europe, 50-75% of the phosphorus in surface waters derives from point sources, mainly discharges from treatment plants of urban or industrial water; 20 to 50% comes from diffuse sources including agriculture and 5 to 15% of transfers of natural soils to water (European Environment Agency, 1999).
3.10Eutrophication
Eutrophication is a natural process that typically occurs as lakes age. However, human-caused, accelerated eutrophication (called "cultural eutrophication") occurs more rapidly, and causes problems in the affected water bodies.
17
Figure 6: Lake Eutrophication(http://www.appropedia.org/Eutrophication).
Orthophosphate is the only form of P that autotrophs can assimilate. Extracellular enzymes hydrolyze organic forms of P to phosphate. Eutrophication is the over-enrichment of receiving waters with mineral nutrients (Burkholder & Glibert, 2001). The results are excessive production of autotrophs, especially algae and cyanobacteria. This high productivity leads to high bacterial populations and high respiration rates, leading to hypoxia or anoxia in poorly mixed bottom waters and at night in surface waters during calm, warm conditions. Low dissolved oxygen causes the loss of aquatic animals and release of many materials normally bound to bottom sediments including various forms of P (Correll 1998).
This release of P reinforces the eutrophication. Excessive concentrations of P are the most common cause of eutrophication in freshwater lakes, reservoirs, streams, and headwaters of estuarine systems. In the ocean, N becomes the key mineral nutrient controlling primary production. Estuaries and continental shelf waters are a transition zone, where excessive P and N create problems. It is best to measure and regulate total P inputs to whole aquatic ecosystems, but for an easy assay it is best to measure total P concentrations, including particulate P, in surface waters or N/P atomic ratios in phytoplankton (Correll 1998; Ulrich et
18
Figure 7: Eutrophication process (http://sachinkbiology11.weebly.com/).
3.10.1 Asphyxiation of the aquatic environment
Step 1: excessive input of nutrients Step 2: growth and proliferation of algae
19 Step 3: degradation of these algae by aerobic bacteria
Step 4: asphyxiation of the aquatic environment
Step 5: decrease in biodiversity and water quality as a resource
3.10.2 Main factors favoring eutrophication
The major factors favoring water eutrophication include nutrient enrichment, hydrodynamics, environmental factors such as temperature, salinity, carbon dioxide, element balance, etc., and microbial biodiversity. The occurrence of water eutrophication is actually a complex function of many factors not fully understood. Algal bloom occurs in some seasons or some years, when the environmental conditions are favorable. The algal bloom caused by phosphorus inputs also modifies several abiotic factors of the water body. These factors directly govern the growth, diversity and density of the biotic components (Yang et al., 2008). The main four factors favoring eutrophication could be summarized as follows:
- First, the enrichment of water by nutrients (phosphate and nitrate primarily) enables the phytoplankton, algae and aquatic plants to grow. However, certain physical conditions must be present in the aquatic environment to enable intensive development of vegetation;
- A water temperature between 15 and 25 °C;
- Light intensity and an important day length (optimum spring) that provides the energy required for plant photosynthesis;
- A decrease of the water current in streams or lakes.
3.10.3 Origins of eutrophication in freshwater
In freshwater, deforestation of the banks allows algae and aquatic plants to be removed easily and cause an increase in water temperature. By indirect effect, the production of plants in rivers increases.
In freshwater environments, anthropogenic inputs of nutrients (cultural eutrophication) have been demonstrated to be a major contributing factor to eutrophication and consequent algal blooms occurrence (Shaw et al., 2003). In general, the growing season average biomass of algae in lakes is strongly dependent upon the concentration of total phosphorus (TP, µg/L) in the water. However, the relative availabilities of nitrogen and phosphorus change consistently
20 with cultural eutrophication, and the growth of algae biomass is strongly modified by the total nitrogen to total phosphorus (TN: TP) ratio (Smith, 2003).
The nutrient enrichment of streams and rivers is also of great concern (Smith, 2003). Although flowing waters are believed to be nutrient-saturated and not susceptible to light-limitation and short hydraulic residence times that may prevent nutrient enrichment, this concept is being questioned by the evidences of significant eutrophication in several major rivers in Germany and in France (Smith, 2003).
3.10.4 Origins of eutrophication in coastal waters
A very large fraction of the nutrients exported from the land surface to streams and rivers ultimately makes its way to the sea, and as a result, estuaries receive more nutrient inputs per unit surface area than any other type of ecosystem. More than half of the world‘s human population resides within 60 kilometers of the coast, and more than 90% of the world‘s fisheries depend in one way or another on estuarine and near-shore habitats.(Smith, 2003). In marine and estuarine systems, cultural eutrophication tends to enhance the input of nitrogen and phosphorus but not silica. This results in dominance by cyanobacteria and dinoflagellates rather than diatoms or chrysophytes (Shaw et al., 2003).
In coastal environments, the phenomenon is complex, due to the phytoplankton succession of species during the season. In spring, it is phosphorus which is often regarded as the limiting factor. Then, during summer, nitrogen and silica appear as limiting. Many experts consider that nitrogen; phosphorus and silicon are rare and may be co-limiting in summer. For the development of green algae, Ulva, it is recognized that nitrogen is always the controlling factor of its growth due to the high availability of phosphorus in coastal waters.
3.11 Phosphorus in aquaculture fish farms:
Throughout the centuries fish has been an important component of the population‘s diet in many parts of the world. Fish catches increased rapidly over the past hundred years due to improved technology, which provided more powerful engines and sonar equipment. This led to over fishing and caused a worldwide decrease in wild stocks. As a result, the growth in fish catches stopped some 20 years ago. The need to increase fish production by farming became therefore an urgent matter.
21 Aquaculture: historical overview
As defined by the United Nations Food and Agriculture Organization (FAO), aquaculture is the ―farming of aquatic organisms including fish, mollusks, crustaceans and aquatic plants. Farming implies some sort of intervention in the rearing process to enhance production, such as regular stocking, feeding, protection from predators, etc.
Aquaculture dates back millennia; it most likely grew out of necessity to provide a stable source of food to local communities. The development of aquaculture has been progressed more slowly than terrestrial farming because of the unfamiliar nature of the ocean terrain and characteristics of aquatic organisms (Beveridge et al., 2002).
1898–First rainbow trout aquaculture facility
End of the19th century–Tejo oyster production major increase
1930‘s–The Portuguese oyster exports reach 13000 Ton/year
1968–Aquaculture is organized as a commercial activity
1970‘s–Rainbow trout reaches a regular production
1980s–Aquaculture is based on bivalve and trout production
1986–Portugal enters the EEC/EU
1990-2008: Freshwater production decreases; New seawater species through
technological development: Seabream, Seabass, Turbot. (António de Vilhena Sykes, 2010)
Today, aquaculture is responsible for an ever-increasing share of global aquatic food production, which has increased from 3.9 percent in 1970 to 31.9 percent in 2003 (FAO, 2007).
It is the fastest growing sector of the world food economy, increasing by more than 10% per year and currently accounts for more than 30% of all fish consumed. Such a growing industry requires an also rapidly growing fish feed production to sustain its needs. Fish feeding became an easy task to accomplish and automation tend to control the amount of feed distributed to the fish in order to prevent excess of food to be wasted. However, waste of food can‘t be eliminated and phosphorus released into the water from a feed sample was estimated in this work.
22
3.11.1 Types of aquaculture
Marine aquaculture can take place in the ocean (that is, in cages, on the seafloor, or suspended in the water column) or on-land, manmade systems such as ponds or tanks receiving marine water. Recirculating aquaculture systems that reduce, reuse, and recycle water and waste can support some marine species.
Freshwater aquaculture produces species that are native to rivers, lakes, and streams. Freshwater aquaculture takes place primarily in ponds and on-land, manmade systems such as recirculating aquaculture systems.
3.11.2 Aquaculture production systems
Fish farming may range from ‗backyard‘ subsistence ponds to large-scale industrial enterprises.
In extensive fish farming, economic and labor inputs are usually low. Natural food production plays a very important role, and the system‘s productivity is relatively low. Fertilizer may be used to increase fertility and thus fish production.
Semi-intensive fish farming requires a moderate level of inputs and fish production is increased by the use of fertilizer and/or supplementary feeding. This means higher labor and feed costs, but higher fish yields usually turns the system profitable.
Intensive fish farming involves a high level of inputs and stocking the ponds with as many fish as possible. The fish are fed supplementary feed, while natural food production plays a minor role. In this system, difficult management problems can arise caused by high fish stocking densities (increased susceptibility to diseases and dissolved oxygen shortage). The high production costs results in a high market price in order to make the fish farm economically feasible.
3.12 Phosphorus remediation actions
In general, comparative studies of freshwater eutrophication strongly suggest that efforts to control external nutrient loading too many lakes will tend to achieve similar reductions in their average algal biomass, regardless of geographical location (Smith, 2003). The first of the remedies to minimize this pollution is to limit the discharge of nutrients into the aquatic
23 environment. For this, it is necessary to limit the use of fertilizers in agriculture and to remove phosphates from our everyday products (as in dishwasher products where they are not prohibited). The creation of buffer zones (grass and tree strips) between fields and rivers also limit this pollution.
Finally, a more efficient removal of phosphorus in wastewater treatment plants is desirable. Remediation technology using bacteria (bioremediation) and plants (phytoremediation) are two promising areas of research on this issue.
24 II. Analytical Methodology
Since 1905, the Standard Methods for the Examination of Water and Wastewater (Eaton et al.; 2005) has been the standard text for water and wastewater analysis.
It contains hundreds of the best available, generally accepted procedures for analyzing water, wastewater and related materials and for the analysis of phosphorus it describes three colorimetric methods:
TheVanadomolybdophosphoric Acid method, the Stannous Chloride method and the Ascorbic Acid Method.
The ascorbic acid method is the most commonly used technique, which can determine concentrations of orthophosphate in most waters and wastewater in the range of 2-200 µg/L.
The principle of this method is that Ammonium molybdate(NH4)6Mo7O24•∙4H2O) and
antimony potassium tartrate (K(SbO)C4H4O6•∙½H2O) react in an acid medium with dilute
solutions of orthophosphate-phosphorus to form an intensely colored antimony-phospho-molybdate complex. This complex is reduced by ascorbic acid to molybdenum blue, an intensely colored complex (Murphy & Riley, 1977), and the absorbance of the complex is measured spectrophotometrically at 880 nm.
1. Theory of spectrophotometric method
There is often a direct relationship between the intensity of the color of a solution and the concentration of the colored component (the analyze species) which it contains. This direct relationship forms the basis of the colorimetric technique. One might readily determine the concentration of an analyze in a sample based on its color intensity, simply by comparing its color with those of a series of solutions of known concentration (standard solutions) of the analyze species. In some cases the color of the solution may be due to an inherent property of
the analyze it self, for example, a KMnO4 solution has a natural purple color, the intensity of
which can be readily measured. In many other cases, however, the solution color is developed by the addition of a suitable reagent which interacts with the analyze species thereby forming a colored complex.
The amount of electromagnetic radiation in the visible region of the wavelength absorbed by a colored solution is often directly proportional to the concentration of the colored species as
25 defined by the Beer-Lambert Law, A = εcl.
Intensity of colored solutions is normally measured with a spectrophotometer. A beam of light of intensity Io is focused on a sample, and a portion, I, is absorbed by the analyze species. The amount of light absorbed may be mathematically expressed as:
A = log (Io/I) (1)
The absorbance, A, is related to concentration by the Beer-Lambert law: A = εcl (2)
Which states that the absorbance of a solution is directly proportional to its concentration, c, as long as the solution path length, l, and the wavelength of the measurement are constant Once the Beer-Lambert law is obeyed, a plot of absorbance against concentration will give a straight line, the slope of which is the molar absorptivity, εtimes path length.
The laboratory Working Range is 0.05 to 2 mg P / L
1.1 Reagents used in this method:
1. Sulfuric acid solution 5 N
2. Potassium antimonyl tartrate solution 8.2 mM 3. Ammonium molybdate Solution 32.4 mM 4. Ascorbic acid solution 0.1 M
5. Color reagent prepared by mixing the above solutions in the following proportions for 100 mL: Sulfuric acid: Antimony potassium tartrate: Ammonium molybdate: Ascorbic acid (50:5:15:30)
All reagents were allowed to attain room temperature before mixing. 2.Forms of P: particulate P and dissolved P
Phosphorus can be present in surface waters as organic phosphorus, orthophosphate (an
inorganic form of PO43-), or as condensed (solid) phosphates. The phosphorus may be in
solution or as a component of suspended particulates. The wet chemical colorimetric analysis of phosphorus only works for orthophosphates and thus other forms of phosphorus must be converted to this form if they are to be analyzed. Organic phosphorus can be severe and effectively oxidized (digested) using perchloric acid, nitric acid-sulfuric
26 acid mineralization, or persulfate with the persulfate technique being the safest, milder and least time consuming.
2.1Dissolved inorganic & organic P
Dissolved inorganic P (DIP), in the form of orthophosphate, is easily utilized by primary producers and is therefore the major bioavailable form of P, but some dissolved organic P (DOP) species can also be present (utilized).
The fractionation and speciation of phosphorus are therefore important factors when considering the impact of the element on water quality.
In natural waters phosphorus can be found in various ―dissolved‖ forms (operationally defined as the fraction that passes through a 0.2 or 0.45 mm filter ), mostly as inorganic orthophosphates and condensed or polyphosphates, but also as organic phosphates (e.g. nucleic acids, proteins, phospholipids, phosphoamides, sugar phosphates, inositol phosphates, aminophosphonates and organic phosphorus pesticides).
2.2 Particulate inorganic & organic P
―Particulate‖ P (defined as the fraction retained on a 0.2 or 0.45 mm filter) can include clay and silt-associated organic and inorganic P, precipitates of biological matter containing P Colloidal phosphorus is commonly referred to as the P fraction in the 1 nm -1 mm size range and hence both the operationally defined dissolved and particulate fractions can contain colloidal P.
This fraction includes both organic and inorganic species of biological and/or mineral origin. 3 Techniques of analysis of phosphorus
Quantification of the organic phosphorus species requires the conversion of the phosphorus to dissolved orthophosphate followed by colorimetric determination of dissolved orthophosphate. The analysis of different phosphorus forms (e.g. particulate or organic-P) is obtained by various pretreatment steps. Filtration to remove suspended matter or various digestion techniques designed to oxidize organic-P to orthophosphates.
27 4. Determination of phosphorus
In this work, the persulfate oxidation was employed to convert the various forms of phosphate-phosphorus to the orthophosphate form whenever a total P measurement was required followed by the ascorbic acid method to determine the concentration of dissolved phosphorus in water samples and fish feed.
5 Digestion
Digestion methods: Since phosphorus exists in several distinct forms in wastewater samples and the approved test method measures only the orthophosphate form, a milder oxidation using persulfate pretreatment was employed to convert the various forms of phosphate-phosphorus to the orthophosphate form.
If the only determination to be made is Total Phosphate-Phosphorus, the sample is digested to convert both the polyphosphate and the organic phosphate to the ortho form at the same time. The final determination of orthophosphate in any digested or undigested sample was performed by the ascorbic acid method and read spectrophotometrically at 880 nm.
6 Analytical method 6.1 Water sampling:
Water samples were taken or brought into the laboratory from different fish farms:
Marão (M) Me and Ms; Paredes de Coura A and B; Pisões C and D ; and Torreira (N1, N2, N3). Except for Torreira which samples were marine water, all the others were freshwaters. For each fish farm at least two samples were analyzed: the inflow water (in), ―A,D and Me‖ and the outflow (out), ―B,C and Ms‖. For Torreira there was one inflow (N1) and two outflows (N2 and N3)
6.2 Materials Apparatus:
1) Shimadzu Spectrophotometer, for use at 880 nm, providing a light path of 1 cm to read sample absorbance.
2) Merck Thermoreactor: used to digest the samples for the determination of total phosphate-phosphorus
28 3) Vortex: to homogenize the samples
4) Balance: to weight the solid reagents 5) Pestle and mortar to mash fish feed
6) Filtration manifold to filter the samples whenever dissolved fraction of phosphorus was to be analyzed
6.3 Glassware
Tubes; erlenmeyer‘s of 100 mL; volumetric flasks (1L, 250 mL, 100mL, 50mL, 10mL), graduated pipettes of several capacities, automatic pipettes of variable volumes (1- 5000 microliters), weighing vessels.
6.4 Reagents and solvents
Deionized water, KH2PO4, C10H14N5PO7, K2S2O8,
Sulfuric acid, Antimony potassium tartrate, Ammonium molybdate and Ascorbic acid CALIBRATION CURVE
Since the phosphate concentration is measured as a function of absorbance, a standard curve of absorbance versus known phosphate concentrations must be prepared. Six standard phosphorus concentrations and deionized water blank were treated with the same digestion procedure as the samples. The absorbances of these 6 standard solutions were used to plot absorbance versus phosphate concentration and obtain a straight line passing very close to the
origin. The calibration line is given by the general equation Abs 880 = slope x P or PO4
29 7. Analytical Protocol
7.1 Fresh and Marine water:
Method: ISO 6878:2004 and SM 4500-P-E 1- Analysis of P total: A - Stock solution: KH2PO4, 50mg P/L, MM KH2PO4 = 136.09 g K= 39.09 H= 1*2 = 2 136.09 g P= 31 O= 16*4=64 MM P= 30.97 g MM PO43- = 95.0 g
Calculation of the concentration of the stock solution:
Weight of KH2PO4 × MM(P) / MM(KH2PO4) × 1000
0.2197 × 31 / 136.09 × 1000 = 50 mgP/L
B - Intermediate solution: dilute 5 times the stock solution = 10 mg P/L 5× (20 mL in 100 mL)
Calculation of the concentration of the intermediate solution: Concentration of the stock solution / 5
50 mgP/L / 5 = 10mgP/L
Table 4 -preparation of 6 standards, in 100mL + blank (0) Volumes (mL) taken from B 0 0.5 1 2 4 6 8 Concentration (mg P/L) 0 0.05 0.1 0.2 0.4 0.6 0.8
C- Digestion standard (PD): this solution is included to check if the digestion is efficient and the percentage of P recovered from this organic compound containing P should be between 80-120% (recovery)
1- C10H14N5PO7, 8.23 mg P / L, Calculation of the concentration of PD:
30
Weight of C10H14N5O7P × 0.97 × MM(P) / MM(C10H14N5O7P) / 0.25 × 1000
0.025 × 0.97 × 31 / 365 / 0.25 × 1000 = 8.24 mg/L
2-Prepare two dilutions; (PD1) and (PD2) from the digestion solution (PD) in 250mL flasks. Complete with deionized water.
PD1: dilute 20 × (5mL in 100mL) 0.41mg P/L
PD2: dilute 10 × (10mL in 100mL) 0.82mgP/L
Calculation of the concentration of PD1: Concentration of PD × 5 mL / 100 mL
8.24 mg/L × 5 / 100 = 0.41 mg/L
D-Preparation of the quantification limit control (Lq): to check the recovery of the standard of lowest concentration
1-Lq: 0.25 mL from intermediate solution in 50mL flask 0.05mg P/L Calculation of the concentration Lq:
0.25 mL × concentration of intermediate solution / 50 mL 0.25 × 10 mgP/L / 50 = 0.05mg P/L
E- Recovery in the spiked sample: to check if the nature of the sample interferes with the quantification. A known amount of standard stock solution (A) is spiked into the sample itself. The concentration obtained subtracted from the sample alone should give the amount of standard spiked in the range 80-120%
1-spike concentration in samples 0.5 mg P/L.
2- Take 0.25 mL from stock solution and dilute in 25mL flask with water samples. Calculation of the concentration of Rc:
0.25 × concentration of stock solution / 25 0.25 × 50 mg P/L / 25 = 0.5mg/L
F-preparation of the samples
1-The marine samples and freshwater samples known to have high levels of suspended solids or organic matter must be diluted before the digestion step.
31 All the water samples and the Lq control are measured in duplicates. The other standard solutions do not require duplicates
G- Digestion step in thermoreactor:
1- 5ml of sample or standard and a blank were transfered to vials. The oxidant reagent (0,5
mL K2S2O8) was added to each vial and placed in the thermoreactor for 30 minutes at
120°C
2- The samples should be allowed to cool down to room temperature before the addition of the color reagent
H- Preparation of the color reagent:
1-solutions used for the combined reagent
Sulfuric acid solution 2.5 mol/L (5N): Dilute 35 mL of sulfuric acid―H2SO4‖ to 250 mL
of deionized water.
MM (H2SO4 95-97 %) = 98.08 g = 1,84 Kg/L
2,5 x 98,08=245,2 8 /0,95 = 258,1 g /1,84 =140,3 mL x 0,25 = 35,07 mL.
Antimony potassium tartrate solution 8.2 mM: Dissolve 0.6857 g of antimony
potassium tartrate in 200 mL deionized water in a 250-mL volumetric flask, or 0.2738 g / 100ml. and store at 40 °C. (Keep in a glass bottle).
MM (K (SBO) C4H4O6 .1 / 2 H 2 O) = 333.93 g
Ammonium molybdate solution 32.4 mM: Dissolve 10 g of ammonium molybdate in
200 mL deionized water. (Keep in a glass bottle).
MM ((NH4) 6MO7O24. 4 H2O) = 1,235.86 g
Ascorbic acid, 0.1 M: Dissolve 0.176 g of ascorbic acid C6H8O6in 10 mL of deionized
water. (Keep in glass container); (Stable for one week in the fridge at 4 ° C)
MM (C6H8O6) = 176.12 g.
32
17 ml of H2SO4 2.5 M + 1.7 ml of the antimony and potassium tartrate solution + 5 ml
of ammonium molybdate solution + 10 ml of ascorbic acid solution. Stir. (Stable for 4 hours)
I- orthophosphate quantification
1-Add 0.8 mL of color reagent (see above combined reagent) to each vial after cooling down. Homogenize. Wait 20 minutes for the color development but not more than 30 minutes because the color is not stable.
J- Spectrophotometer readings: 1-Set the wavelength to 880 nm
2-Acquire a baseline signal between 800-900 nm 3-Set auto zero absorbance with deionized water
4-Start reading the standard solutions and then the samples and controls
7.2 Analysis of PO43-:
For the determination of dissolved orthophosphate the samples were previously filtered and the color reagent added without any other treatment such as oxidation (digestion step).
The calibration curve may use the same standard solutions as for total P, calculating the
equivalent concentrations in PO43-/L, or different concentrations as in the example below.
A- Preparation of standard solutions:
Volumes mL 0 0,05 0.25 0.5 1 1.5 2
Concentration
(mg PO43-/L)
0 0.061 0.306 0.612 1.224 1.836 2.448
B-Colorimetric reaction
1-To 25 mL of sample or standard solution add 4 mL of color reagent, wait 20 minutes and read in the spectrophotometer
33 7.3 Analysis of fish feed
Method: ISO 6878:2004 and SM 4500-P-E
Samples: fish feed of coarse (4.5 mm) and fine grain (2.3 mm).
Table 5: percentage of phosphorus in grain size
Grain size (mm) Phosphorus %
2.3 1 – 1.2
3 0.9 – 1
4.5 0.8 – 1
6 0.8 – 1
1g from each feed was mashed in pestle and mortar and 100 mL of deionized water was added. The feed was left in water to simulate the dissolution of P in feed waste (not eaten by the fish)
After 1 h a sample from each feed was taken to measure total P, dissolved P and phosphate. The dissolved and phosphate determinations needed filtration and for total P determination persulfate oxidation was required. After 7 days the sampling was repeated to investigate the rate of phosphorus release from the feed.
The P in the filtered sample subtracted from the non-filtered sample gives the particulate P,
and P-PO43- subtracted from total P (the non-filtered and digested sample) will give the
organic fraction of P.
1- Analysis of fish feed: For the determination of P concentration in fish feed, filtered and non-filtered samples were analyzed.
2- The calibration curve may use the same standard solutions as for total P in water, A- Total P determination from fish feed
1- Weight 1 g of each grain of feed
2- Mashed and dissolved in 100 mL beaker of deionized water. 3- Leave it for 1h, and 7days to dissolve.
4- Filter the samples half the samples
5- Prepare from each time 2 samples (filtered and non-filtered) in duplicate.
6- 1H: Dilute 20 ×, I have to take from each sample 2.5 mL and dilute in 50 mL flask. (2.5 mL in 50 mL)
34 7- 7 days: Dilute 50 ×, I have to take from each sample 1 mL and dilute in 50 mL flask.
(1 mL in 50 mL)
8- Pipette 5 mL of each sample into tubes
9- Add 0.5mL of K2S2O8 in each tube, agitate
10- Place the tubes in the thermoreactor for 30 min and 120°C
11- Add 0.8 mL of color reagent for orthophosphate quantification (see above section H) after cooling and homogenize.
12- Wait 20 minutes for color development but not more than 30 minutes because the color is not stable.
13- Read in the spectrophotometer as in section J
B- Analysisof PO43- from fish feed.
The samples must be filtered and the protocol is the same as in 2-Analysis of PO43-,
above.
7.4 Testing the concentration working range for the quantification of PO4
3-In order to check the range of working concentrations, 3 concentrations of PO43- were chosen
and 5 replicates of each concentration were analysed : low range: (0.05 mg PO43-/L),
intermediate range (0.8 mg PO43-/L) and higher range (2 mg PO43-/L) dd
Stock solution:
Weight 0.1430g of KH2PO4 ,dissolve in 1L 100 mg PO43-/L
Samples:
Prepare 5 replicates of each of the 03 concentrations within the working range;
1- High concentration: 2 mg PO43-/L
Pipette 5 mL from the intermediate solution and dilute into 250 mL flask. Ci= 100 mg/L, Vi =?;Cf = 2 mg/ L ; Vf = 250mL
35
2- Intermediate concentration: 0.8 mg PO43-/L.
From the 2 mg PO43-/L solution pipette 80 mL and dilute in 200 mL flask.
Ci= 2 mg/L, Vi =?; Cf = 0.8mg/ L ; Vf = 200mL
2 × Vi = 0.8 × 200 = 80 mL.(80 mL in 200mL) 0.8 mg/L
3- Low concentration: 0.05 mg PO43-/L.
Ci= 2 mg/L, Vi =?; Cf = 0.05 mg/ L ; Vf = 200mL
2 × Vi = 0.05 × 200 = 5 mL.(5 mL in 200mL) 0.05mg/L
Pipette 5 mL from the 2 mg PO43-/L solution 5 mL and dilute in 200mL.
5mL 5mL
Stock solution intermediate solution solution low conc (100mg/L) (2mg/L) (0.05mg/L) Pipette 5 x 25 mL of each standard solution and one blank into an Erlenmeyer and add 4 mL of the combined reagent. Agitate and read after 20 min
Read in the spectrophotometer.
8.Determination of LOD and LOQ and legal limits
The quality of an analytical method developed is always appraised in terms of suitability for its intended purpose, recovery, requirement for standardization, sensitivity, analyze stability, ease of analysis, skill subset required, time and cost in that order. It is highly imperative to establish through a systematic process that the analytical method under question is acceptable for its intended purpose.
Limit of detection (LOD) and limit of quantification (LOQ) are two important performance characteristics in method validation. (LOD) and (LOQ) are terms used to describe the smallest concentration of an analyze that can be reliably measured by an analytical procedure.
You calculate the (LoD): 3 x standard error of the calibration line/slope of the calibration line
1000 mL 250 mL
36 You calculate the (LoQ): 10 x standard error of the calibration line/slope of the calibration line
9. control charts
A control chart is a statistical tool used to distinguish between variation in a process resulting from common causes and variation resulting from special causes. It presents a graphic display of process stability or instability over time (Viewg raph 1). Every measurement has variation. Some variation may be the result of causes which are not normally present in the process. This could be special cause variation. Some variation is simply the result of numerous, ever-present differences in the process. This is common cause variation. Control Charts differentiate between these two types of variation.
Why Use Control Charts? • Monitor process variation over time
• Differentiate between special cause and common cause variation • Assess effectiveness of changes
37 III. Results and discussion
Analysis of total phosphorus and PO43- in fresh and marine water and fish feed by
colorimetric technique.
1. Calibration curve for total phosphorus and PO43-analysis
Using the methods previously described in chapter 2, for the measurement of total phosphorus
and PO43- species, a record of measured absorbance for each of the several standard solutions
and deionized water is shown in Table 6 and Table 7 for total and phosphorus and PO43-
respectively. It is important to note that the wavelength at which maximum absorbance for
both total phosphorus and PO43- is 880 nm, therefore, all the measurements of absorbance of
calibration standards and water samples were carried out at this wavelength.
Table 6: Calibration data for total phosphorus analysis by spectrophotometry
Sample Number Concentration of Standard
solution (mg P/L) Measured Absorbance
Deionized water 0 0.001 1 0.050 0.029 2 0.100 0.058 3 0.200 0.116 4 0.399 0.229 5 0.599 0.351 6 0.799 0.463
38
Table 7: Calibration data for PO43- analysis by spectrophotometry
Sample Number Concentration of Standard
solution (mg PO43-/L) Measured Absorbance
Deionized water 0.000 0.000 1 0.077 0.014 2 0.153 0.03 3 0.307 0.062 4 0.613 0.125 5 1.227 0.251 6 1.840 0.387 8 2.454 0.509
Using the absorbance values for the working standards, listed in Table 5 and Table 6, the
standard curves for total phosphorus and PO43- were calculated and are shown in Figure 9 and
Figure 10, respectively.
These curves simply plot the measured absorption of a monochromatic light passing through a standard solution or a water sample in the spectrophotometer relative to the known total
phosphorus and PO43- concentrations. The straight lines were fitted to all data points using
linear regression. As shown in the figures, the equations of the best line fit are described as: For total phosphorus: Y = 0.580 X + 0.0001 (3)
For PO43- : Y = 0.208X – 0.001 (4)
Where Y is absorbance read at 880 nm
39
Figure 9: Standard Curve for total phosphorus analysis
Figure 4: Standard Curve for PO43- analysis y = 0,5807x + 0,0001 R² = 0,9999 0,000 0,050 0,100 0,150 0,200 0,250 0,300 0,350 0,400 0,450 0,500 0 0,2 0,4 0,6 0,8 1 A bs 8 8 0 nm mg/L P P-Total y = 0,2088x - 0,0019 R² = 0,9998 -0,100 0,000 0,100 0,200 0,300 0,400 0,500 0,600 0,000 0,500 1,000 1,500 2,000 2,500 3,000 A bs 8 8 0 nm mg/L PO43-