HAL Id: hal-01455432
https://hal.archives-ouvertes.fr/hal-01455432
Submitted on 3 Feb 2017
HAL is a multi-disciplinary open access
archive for the deposit and dissemination of
sci-entific research documents, whether they are
pub-lished or not. The documents may come from
teaching and research institutions in France or
abroad, or from public or private research centers.
L’archive ouverte pluridisciplinaire HAL, est
destinée au dépôt et à la diffusion de documents
scientifiques de niveau recherche, publiés ou non,
émanant des établissements d’enseignement et de
recherche français ou étrangers, des laboratoires
publics ou privés.
Advanced discriminating criteria for natural organic
substances of Cultural Heritage interest: Spectral
decomposition and multivariate analyses of FT-Raman
and FT-IR signatures
Céline Daher, Ludovic Bellot-Gurlet, Anne-Solenn Le Hô, Céline Paris,
Martine Regert
To cite this version:
Céline Daher, Ludovic Bellot-Gurlet, Anne-Solenn Le Hô, Céline Paris, Martine Regert. Advanced
discriminating criteria for natural organic substances of Cultural Heritage interest: Spectral
decom-position and multivariate analyses of FT-Raman and FT-IR signatures. Talanta, Elsevier, 2013, 115,
pp.540 - 547. �10.1016/j.talanta.2013.06.014�. �hal-01455432�
Advanced discriminating criteria for natural organic substances
of Cultural Heritage interest: Spectral decomposition and multivariate
analyses of FT-Raman and FT-IR signatures
Céline Daher
a, Ludovic Bellot-Gurlet
a,n, Anne-Solenn Le Hô
b, Céline Paris
a,
Martine Regert
ca
Laboratoire de Dynamique, Interactions et Réactivité (LADIR), UMR 7075 CNRS– UPMC (Université Pierre et Marie Curie Paris 6), 4 place Jussieu 75252 Paris Cedex 05, France
b
Centre de Recherche et de Restauration des Musées de France (C2RMF), Ministère de la Culture et de la Communication, Palais du Louvre-Porte des Lions, 14 quai François Mitterrand, 75001 Paris, France
c
Cultures et Environnements. Préhistoire, Antiquité, Moyen-Âge (CEPAM), UMR 7264 CNRS– Université de Nice-Sophia Antipolis, Campus St-Jean-d'Angély 3, 24 avenue des Diables Bleus, 06 357 Nice Cedex 4, France
a r t i c l e i n f o
Article history:
Received 14 December 2012 Received in revised form 5 June 2013
Accepted 11 June 2013 Available online 15 June 2013 Keywords:
Natural organic substances Plant resins
Cultural heritage artifacts Infrared spectroscopy FT-Raman spectroscopy Principal component analysis
a b s t r a c t
Natural organic substances are involved in many aspects of the cultural heritagefield. Their presence in different forms (raw, heated, mixed), with various conservation states, constitutes a real challenge regarding their recognition and discrimination. Their characterization usually involves the use of separative techniques which imply destructive sampling and specific analytical preparations. Here we propose a non destructive approach using FT-Raman and infrared spectroscopies for the identification and differentiation of natural organic substances. Because of their related functional groups, they usually present similar vibrational signatures. Nevertheless the use of appropriate signal treatment and statistical analysis was successfully carried out to overcome this limitation, then proposing new objective discriminating methodology to identify these substances. Spectral decomposition calculations were performed on the CH stretching region of a large set of reference materials such as resins, oils, animal glues, and gums. Multivariate analyses (Principal Component Analyses) were then performed on the fitting parameters, and new discriminating criteria were established. A set of previously characterized archeological resins, with different surface aspects or alteration states, was analyzed using the same methodology. These testing samples validate the efficiency of our discriminating criteria established on the reference corpus. Moreover, we proved that some alteration or ageing of organic materials is not an issue to their recognition.
& 2013 Elsevier B.V. All rights reserved.
1. Introduction
The chemical characterization of natural organic substances is a challenging and significant task in the cultural heritage field. Indeed, these substances are involved in many aspects of ancient societies, including diet, medicine, funerary rituals, artistic works, economic and technical activities.
Studying the chemistry of these materials is the only way to get information about their exact nature and their origin, but also to identify their degradation mechanisms in order to preserve them, or to get information about their original state.
The diversity of their biological origins, the complexity of their composition, their poor conservation state (for the oldest),
consequently offer many analytical challenges. The usually devel-oped approaches are based on separative methods (liquid or gas chromatography) often coupled to mass spectrometry (MS)[1–3]. Nevertheless, these methods imply a destructive sampling and a wise and reasoned choice of analytical and/or pre-treatment conditions which depend on the analyte (sample extraction and derivatisation, column, injector, step of pyrolysis, etc.)[4,5].
In order to preserve the objects and samples, alternative non destructive methods can be considered such as Raman and infrared spectroscopies. They are complementary methods as they both provide the vibrational signatures of the analyzed material and thus may discriminate the organic natural media[6–10]. They are particularly suited for the structural characterization of the polymer network structures, and have the advantage of being rapid and often without specific sample preparation. Moreover, they are pertinent techniques that enable the simultaneous investigation of the organic and mineral parts in a same sample Contents lists available atSciVerse ScienceDirect
journal homepage:www.elsevier.com/locate/talanta
Talanta
0039-9140/$ - see front matter& 2013 Elsevier B.V. All rights reserved. http://dx.doi.org/10.1016/j.talanta.2013.06.014
nCorresponding author. Tel.:+33 1 44 27 36 18; fax: +33 1 44 27 30 21.
(for example pigments added in furniture or music instruments varnishes) and that provide spatially resolved information and an access to imaging in the micrometer range [10–12]. Current improvements in Raman and infrared instrumentation supply high sensitivity devices, accessories dedicated to various types of sample, accomplished micro-analysis, and portable instruments which allow on-site analysis directly on the artefacts[13–15].
Some of the existing studies present rather broad library of Raman or infrared spectra of natural organic substances such as binders or varnish materials[6,7], or fresh plant substances[16], or even biological and pharmaceutical compounds[17–19]. Other studies present particular tools to distinguish between some organic compounds using simple criteria, such as bands presence and absence, or band shifts[20–22]. However, these approaches are limited by the similarity between all these natural substances' spectra, or by the spectra evolution due to the alteration processes of such materials. But nearly all other published works are specific case studies of one or two substances that were found on a piece of art or archeological artifacts, and do not present an important amount of media, or any specific methodological development for indentifying them[23–30]. Moreover, these studies deal with only one of the two presented vibrational spectroscopies.
In this study, a specific methodology for data processing was developed, which makes the combination of vibrational spectrosco-pies an easy and accurate technique for the objective recognition and the differentiation of a large amount of natural organic substances. These substances are, in their raw form, hardly identified and differentiated, and even harder if they are processed or in a mixture. Our corpus of reference samples is defined by four different chemical families with various origins: some exude from trees like resins (terpenoids) and gums (polysaccharides) or are extracted from plants such as oils (triglycerides); others have animal origins such as shellacs (terpenoids) or glues (proteins). Among these various kinds of materials, we mainly focused on resins, widely used by ancient societies, because they exude from multiple tree species of different geographical provenances, leading to different chemical compositions. Identifying them– and therefore their provenance – may be a way to retrace the ancient commercial routes or to collect information for history of art and techniques. Undertaking this kind of study requires extensive collection of reference samples.
Our methodology is based on the CH vibration region on which a set of spectral treatments was applied, from baseline subtraction to spectral decomposition. Multivariate analyses were then done on the treated data to differentiate into clusters the organic natural materials. Studies involving Principal Component Analysis (PCA) on diverse spectroscopic data were already done on different types of samples and with different aims: material recognition[8,13,31,32] or identification of a compound in a mixture[33]. We here focused on the ability of these analyses to cluster samples with similar vibrational characteristics. Since these spectroscopic features refer to particular vibrations in specific molecular environments, new discriminating criteria for material recognition were established.
In order to validate this methodology and the established criteria, a set of archeological artefacts already identified as copal by IR and separative methods [34] was analyzed. Besides, natural organic substances may undergo many natural modifications, as for the studied archeological copals which surfaces present different aspects or alteration states. These transformations may then hamper their identification. In order to determine if ageing or alteration is really an obstacle to the discrimination of materials, the external parts of the archeological samples were analyzed using the same procedures.
Finally, using PCA, these alteration degrees were quantified by determining specific degradation criteria.
We thus propose in this paper a new non destructive metho-dology based on an advanced multivariate analysis focused on CH vibration region of the spectra. It allows a simple, rapid and robust
persuasive identification of natural organic substances, sometimes at the scale of the tree species. Furthermore, this method has been shown to be efficient for archeological samples and thus in case of aged and altered resinous materials.
2. Experimental 2.1. Analyzed materials 2.1.1. Reference samples
A selection of 37 reference samples representative of four different chemical families: terpenoids, proteins, polysaccharides, and triglycerides such as respectively resins, glues, gums and oils have been studied (supplementaryTable 1s). We mainly focused on the terpenoid resins (26 of the 37 references), and among our corpus, three subfamilies can be sorted: diterpenic resins (copal, sandarac, kauri, colophony, Venice turpentine); triterpenic ones (dammar, elemi, mastic, frankincense) and shellacs made of sesquiterpenoids, fatty acid derivatives and anthraquinone dyes[35]. It is important to note that the di- or triterpenoid proportion is generally a minor part of the resins, the major one being the polymerized fraction[36].
Among this corpus, the colors are quite various: from a light yellow (as arabic gum) to a dark red (as shellac cherry). These substances were also analyzed in different forms (supplementary
Table 1s). For example, the oils were analyzed in their raw liquid form and applied as varnishes (dryfilms) as well. These films are considered as transformed samples since they are exposed to oxidation and polymerization[37].
2.1.2. Archeological samples
Ten samples of archeological copal from the medieval site Sharma (Yemen) [38,39] have also been analyzed. They have already been identified by separative techniques as eastern African and/or Mada-gascar copals[34]. These raw fragments of copal have a same hard and transparent bulk but different surface states and colors: from yellow fragments with a thin dry surface, to orange fragments with a flaked-off surface and finally red fragments with a thick and very friable surface. This difference in the aspect might be related to different surface conservation states. Adding this set of already studied copals is a way to evaluate the representativity of the reference materials and to assess the developed methodology on ancient samples. Moreover, the different surface alteration states of these archeological fragments should provide information about the impact of the materials degra-dation on their recognition and discrimination. For these archeological copals, a specific sampling procedure was applied: the internal and external parts of each fragment were separately analyzed to take into account their heterogeneity.
2.2. Instrumentation 2.2.1. Raman spectroscopy
FT-Raman analyses were performed using a near infrared excitation at 1064 nm provided by an Nd-YAG laser diode coupled to a Bruker RFS 100/S spectrometer based on a Michelson-type interferometer, and equipped with a liquid nitrogen-cooled Ge detector. The reference materials were recorded using a macroscopic interface equipped with a 901 collecting mirror allowing the objects to be placed on a horizontal surface. The laser nominal power was of 500 mW (400 mW at the sample) and the spot size about 100mm. For the archeological samples, a microscope interface was used with a 40x objective, allowing a spot size of 30mm approximately, and a power at the sample of 250 mW (maximum nominal power of 500 mW).
For the two interfaces, reference fragments and archeological samples were analyzed in their raw form without any contact and C. Daher et al. / Talanta 115 (2013) 540–547 541
no damage or heating of the materials was observed. Reference materials and archeological samples were placed on a gold mirror to improve the collected Raman signal intensity. Spectra were recorded between 3500 and 50 cm−1with a 4 cm−1resolution and 1500 scans to optimize the analysis time and the signal-to-noise ratio.
2.2.2. Infrared spectroscopy
Micro-infrared spectroscopy analyses were performed in an Attenuated Total Reflectance (mono-ATR) mode using a Bruker Equinox 55 spectrometer coupled to an IRscope II microscope equipped with a liquid nitrogen-cooled MCT detector. A 20x ATR objective was used. It is equipped with a Germanium crystal (mono reflection) working whether in a visual mode for choosing the area to analyze, or in an IR mode for the measurement. This crystal needs a contact with the analyzed object, and depending on the material hardness, it can lead to some damage. 200 scans were accumulated between 4000 and 600 cm−1with a 4 cm−1resolution.
2.3. Data processing
In order to establish new discriminating criteria for the studied substances, a specific methodology based on the bands morphology and profile, and involving multivariate analyses was set up. It can be described as follows. Thefirst step consisted in choosing the most appropriate spectral region to process. Although the most specific bands are located in thefingerprint region (200–1800 cm−1) of the
spectra, they are weak especially for Raman and therefore most likely to disappear or be modified in case of a bad signal-to-noise ratio; with also further complication to study band profiles (Fig. 1). How-ever, the CH stretching vibration band in the 2900 cm−1area is the most intense region on the Raman spectra, and always intense on the IR ones. Moreover, a detailed comparison of the materials spectra (Fig. 2) shows some differences between the CH bands shapes.
This spectral region was thus chosen for data processing. This operation consists in a set of spectral treatments. First, the CH region was extracted (Raman spectra were cut between 2730 and 3185 cm−1 and IR spectra between 2730 and 3135 cm−1), and a linear baseline was subtracted. The second important step was the spectra normal-ization. Indeed, all the analyzed materials were not of the same size or thickness and in order to get rid of this analytical parameter, the cut spectra were all scaled to the same intensity. Then, a more thorough step consisting in a spectral decomposition of the CH stretching region using home-made software was established. The decomposition procedure was first defined according to several parameters: the number of bands and their position (P), the area (A), the full width at half maximum (W) and the profile (K) of each decomposition band (Gaussian/Lorentzian). The number and initial positions of the bands were determined by calculating the second derivative of the massif for each spectrum (Fig. 3). Each minimum indicates the position of a band (Fig. 3a, b). The positions are manually read at the minimum of each band. It can be noticed that for the archeological copal, the internal and external sampling CH stretching regions present the same number and band positions. The different parameters are introduced to the ASREL software: the bands positions P are entered according to the second derivative minima's values; W has an arbitrary initial value of 10 cm−1(viable value for a molecular vibrator) and is constrained to positive values, K has an initial value of 0.5 and is confined between 0 (Gaussian profile) and 1 (Lorentzian profile), and finally A is just limited to positive values. Concerning thefitting procedure, it is based on a least squares method which adjusts the band parameters tofit the experimental spectrum.
Finally, multivariate analyses were performed using PCA calculation (Statistica software, StatSoft). These calculations were performed at two different stages of the methodology after standardizing the variables. As afirst approach, and as nowadays commonly proposed
in many spectroscopic softwares, we considered the treated spectra (before decomposition) as variables in Principal Component Analyses (PCA). As a second approach, thefitting parameters (band positions P, full width at half maximum W, area A, and profile K) were considered as variables in PCA. All the PCA score plots are presented on the twofirst principal components (PC); the following PCs do not show a more significant separation between the different items. More detailed explanations are presented within the results part (3.2 and 3.3 paragraphs).
Since Raman spectroscopy can be implemented as fully non destructive, we chose to mainly comment the Raman treatment procedure and results (figures describing the IR results can be found as Supplementary information).
3. Results and discussion 3.1. General remarks
Representative Raman spectra of the four chemical families of the corpus are presented onFig. 1. All these organic compounds present comparable functional groups, leading to similarities in their vibrational signatures. Specific features can however help distinguishing among them[10,22,40]. OnFig. 1, a broad Raman band at 3250–3270 cm−1 assigned to the stretching vibration of
the OH groups[6]is present for glues and gums (Fig. 1a and b), but absent from oils and resins (Fig. 1c–f). Then, a weak band at Fig. 1. FT-Raman normalized spectra of the different chemical families studied: (a) arabic gum (polysaccharides), (b) rabbit skin glue (proteins), (c) linseed oil (triglycerides), (d) shellac (sesquiterpenoids, fatty acid derivatives), (e) elemi (triterpenoids), (f) copal, internal sampling of an archeological sample (diterpe-noids) and (g) copal, external sampling of an archeological sample (diterpe(diterpe-noids). Spectrum (g) shows some spectral modifications regarding spectrum (f). It reflects the ageing or degradation of copal between its internal“fresh” sample and its surface sample. The symbol * refers to the bands which are discussed in the text.
1742 cm−1attributed to the CQO stretching is present on the oils IR spectra as well as on the resins IR spectra but shifted to 1710– 1720 cm−1 [7,16]. Finally, concerning the resins, a band at 3060 cm−1assigned to the stretching vibration of the aromatic or olefinic CH groups[6]is present on the shellacs spectra (Fig. 1d). This characteristic band appears also on the diterpenoid resins spectra (Fig. 1f) at 3080 cm−1, but is absent from the triterpenoid resins ones (Fig. 1e). This weak feature is thus a useful criterion to distinguish between the di-, triterpenic resins and shellacs groups. However, one major problem is that all these specific features may decrease, be shifted or broadened with ageing or degradation
[41,42] or if these media are part of a mixture[32]. OnFig. 1the spectrum in (g) is a surface sampling of the archeological copal in (f). For example, in (g), the band around 1650 cm−1is broader and decreases, and the CH stretching region (around 2900 cm−1) is less structured than in (f). Using simple spectral features to differenti-ate between the media could be therefore compromised when some alteration is involved. This underlines the necessity of a more detailed spectra exploitation.
The methodology described in paragraph 2.3 was applied to all the reference materials and to the archeological copals, whether internal or external samples. Concerning the Raman results, the decomposition step ended up with altogether 10 Raman bands, which were present or absent depending on the material.Table 1is a summary of the 10 Raman bands, and indicates the materials for which they are present/absent. The 10 groups of bands were defined with an arbitrary step of 20 cm−1. Each group is constituted
by the major vibrational contributions of CH bond in different functional groups, and/or different structural environments. Bands 1, 4, and 5 are mainly related to CH2groups; bands 2, 6, and 7 to
CH3groups and bands 3 and 8 to CH groups in respectively aliphatic
and cyclic groups. Finally, bands 9 and 10 are related to CH or CH2in
aromatic or vinyl groups. The presence or absence of band sum-marized in Table 1 is thus already a discriminating criterion between materials, since it reflects the CH region morphology.
Concerning the archeological samples, the spectra adjustments are different between the internal part and the altered surface part. In a general way, for the external samples, the bands get broader (W is higher for the surface samples), their profile tends towards a Gaussian one; and some bands' intensity decreases significantly. Band number 10 almost disappears for some arche-ological copals (the red ones). It is related to CH bonds in vinyl groups which may be transformed (oxidized) during alteration processes[41].
3.2. Raw spectra and multivariate analyses
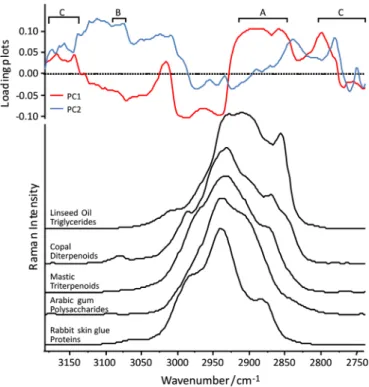
In order to determine new discriminating criteria for the organic substances, multivariate analyses were carried out on the reference materials as described in paragraph 2.3. The results of PCA calculation using the CH spectral region data points as variables with a 2 cm−1step are presentedFig. 4. It illustrates the distribution of the 37 reference materials on the PC1 and PC2 score plot. The glues can form a cluster thanks to the PC1 (negative contribution); the oils are all on one side of the PC1 (between 10 and 20). However, the resins are much dispersed and seem to be hardly separated with PC1 but quite sorted with PC2. Most of the triterpenic resins have a negative contribution on PC2 and the diterpenic are from 0 to 15 on PC2. However, this is insufficient to consider that the different materials are well sorted or clustered. Indeed, some samples are quite dispersed: for example pine resins (colophony and Venice turpentine) and others are clustered but among other materials; for instance frankincense samples are “mixed” with the diterpenic resins. Moreover some of the refer-ence samples are processed: for example, two samples of coloph-ony are in a raw form and one is a colophcoloph-ony varnish, same for the Fig. 2. Upper part: loading plots of the principal components PC1 and PC2 which
account for 33.4% and 17.1% respectively, of the total variance in the FT-Raman spectra of the 37 reference materials studied. The letters A, B and C refer to three spectral regions described in the text. Lower part: CH spectral region of 5 different chemical families: proteins, triterpenoid resins, diterpenoid resins, triglycerides and polysaccharides. Thisfigure indicates which spectral features of the Raman CH region have an important contribution to PC1 and PC2.
Fig. 3. Upper part: second derivative calculation (dotted line) of the Raman CH region (solid line). The band positions are indicated with a star under the second derivative. (a) Mastic; (b) archeological copal (black line: internal sampling, gray line: surface sampling). Lower part: fitting results of the Raman CH massif. Experimental spectrum: black dotted line, calculated spectrum: solid red line, decomposition bands: solid gray line. (c) Mastic; (d) archeological copal (internal sampling). It turns out that the decomposition bands are precisely at the positions that were given by the second derivative. (For interpretation of the references to color in thisfigure legend, the reader is referred to the web version of this article.)
oils, which explain the oils dispersion. Material transformation or alteration is consequently an obstacle to a good clustering when the variables for PCA are spectra data points.
In this PCA calculation, the loading plots are directly related to the wavenumbers. They indicate the spectral features that have an important contribution to the principal components, in other words, the ones which influence the score plots.Fig. 2shows the loading plots of PC1 and PC2 and the Raman CH stretching region offive samples representative of the different chemical families. A high contribution of the 2845–2910 cm−1region (A onFig. 2) to
PC1 underlines its important role in the exploited variance. This might be related to the high intensity of the oils spectra in this region (high PC1 contribution on the score plot onFig. 4) and the weak intensity of the glues spectra (very low PC1 contribution on the score plot on Fig. 4) for instance. Around 3080 cm−1 (B on
Fig. 2), one feature specific to the diterpenic resins spectra has a positive important contribution to PC2 and a low and negative contribution to PC1. This can explain the distribution of the diterpenic resins on the score plot. Another point that can be highlighted is the important contribution to both PC1 and PC2 of the 2740–2800 cm−1region and the 3100–3184 cm−1region (C on
Fig. 2), where no band appears. This is due to the spectral noise which introduces high variance in a non-specific spectral region, and can explain the globally weak clustering of the samples on the PCA score plot.
3.3. Decomposition parameters and multivariate analyses
Thus, we chose to undertake PCA treatments using other vari-ables: the 4fitting parameters (band positions P, full width at half maximum W, area A, and profile k) of the 10 bands as 40 variables. The reference materials can be easily clustered into groups (Fig. 5): oils are found in the upper right quadrant of the score plot, glues with a PC1 around zero and with a negative (−4) PC2. The resins have however a particular behavior: diterpenic resins can be separated into 3 groups: Manila copal, sandarac and Kauri resin in one group (bottom left quadrant of the score plot), colophony and Venice turpentine in a second group in the upper left quadrant of the score plot andfinally, in the same area but clustered as well, the African and/or Madagascar copals. Triterpenic resins are quite dispersed and are almost sorted: elemi is on the top right quadrant of the score plot; mastic is in the bottom right quadrant of the score plot but mixed with the shellacs. Dammar and frankincense are with a PC1 around zero and a negative (−3) PC2. Resins seem to be grouped according to the tree species from which they exude. Indeed, colophony and Venice turpentine derive both from Pinaceae family with major components abietic acid and its degradation products and isopimaric acid[43]. Sandarac comes from Cupressaceae trees and Manila copal and Kauri from Araucariaceae species[44]. Despite this difference, they have same important components in common, such as communic acid and sandaracopimaric acid [36]. Finally, African copals are from the Leguminosae or Fabaceae family with large amounts of copalic acid and ozic acid[35].
In order to determine which variables are the most involved in the clustering of the samples on the score plot, we can represent the variables projection (Fig. 5) on the PC1 and PC2 space. A variable is considered as influent if its norm projection on the PC axis is high. For example, thefitting parameters of bands 8 and 10 have an important negative contribution to PC1, and thefitting parameters of band 7 have an important positive contribution to PC1. This can explain for example the distance between the oils and the gums on one side and the African copals and pine resins on the other side. Indeed, bands 8 and 10 are absent from oils and gums spectra and band 7 is present (Table 1), whereas it is the opposite for pine resins and African copals. A deeper look at this Table 1
Positions of the 10 Raman decomposition bands. For each group, the major vibrational contributions expected are indicated. The 10 groups were defined with an arbitrary step of 20 cm−1. X: presence of the band for each material.
Raman bands Band 1 Band 2 Band 3 Band 4 Band 5 Band 6 Band 7 Band 8 Band 9 Band 10
Position (cm−1) 2830– 2860 2860– 2880 2880– 2900 2900– 2920 2920– 2940 2940– 2960 2960– 2980 2980–3000 3000– 3020 3060– 3090 Proposed assignments CH2(s) CH3(s) CH CH2(as) CH3(as) CH in
cyclo-alkanes CH in aromatic molecules or vinyl groups Oils X X X X X X X Glues X X X X X X Gums X X X X X Mastic X X X X X Elemi X X X X X X X X Dammar X X X X X X Frankincense X X X X X X X Shellacs X X X X X X X Colophony/Venice turpentine X X X X X X X X Madagascar/African copals X X X X X X X Sandarac/Kauri/Manila copals X X X X X X X
Archeological Copals (internal and external)
X X X X X X X
Fig. 4. Score plot of PC1 and PC2. Variables: FT-Raman CH band data points (step¼2 cm−1), items: 37 reference samples. Some samples are clustered
(ex: glues), some are dispersed (ex: pine resins) and some are grouped but among another kind of material (ex: frankincenses within the diterpenic resins).
figure shows that the fitting parameters of each band are globally grouped altogether. The most important parameter is therefore more the presence of a decomposition band than its profile. It is thus necessary to add a spectral decomposition step, which goes deeper in the morphological analysis of the CH stretching region, in order to obtain a good clustering depending on the chemical families and/or geographical origin of the tree species. Working on the morphology of the CH spectral region can be sufficiently informative if the treatment procedure is well defined. Indeed, choosing the correct number and position of bands for the spectral decomposition is a critical point to get a relevant description of the spectra morphology.
Concerning the IR analyses, the spectra decomposition also led to 10 bands. The PCA results on the reference corpus are presented on supplementaryFigs.s 1s and 2s. The different chemical families are separated but with less accuracy than for Raman. However, the IR results can be considered as complementary or validating data, as they can ensure the classification proposed by the Raman results or be the key issue in the discrimination of some families. Indeed, some materials are quite close on the Raman score plots but well separated on the IR ones, as for example the glues and frankincenses, or the mastics and shellacs (supplementaryFig. 2s). Discriminative criteria have been well established on a refer-ence set of materials, but still need to be validated with a well-known corpus of cultural heritage artefacts. For this purpose, the archeological copals were added to the PCA calculation. As seen before, it is more accurate to proceed with thefitting parameters as variables for PCA. The archeological copals were treated as supplementary items, in other words, they did not take part in the calculation, and were just projected on the score plot according to their variables values.Fig. 6shows the score plot of the 57 items: all 37 reference materials and 20 archeological copals: 10 internal samples and 10 surface samples. The archeological copals are all grouped with the African/Madagascar copals on the top left quadrant of the score plot. This result validates, on one side, the hypothesis of a previous study [34] saying that the copals, although found in Yemen, are from Africa eastern coast and/or Madagascar; and also validates the efficiency of our discriminating criteria.
3.4. Material alteration
Another challenge was to determine if the materiel alteration has any impact on its recognition. The archeological copals are, in
this case also, good testing samples since their surface presents more or less alteration. On the PCA score plot (Fig. 6) we can notice that the surface samples are in the same cluster than the internal samples, as for the IR results (supplementaryFig. 3s). Moreover, other transformed materials, for example linseed and poppyseed oilfilms, are as well in the oils cluster with a PC1 of 6 and a PC2 around 2 (Fig. 6). Ageing or alteration does not seem, to a certain extent, hinder the material identification.
Multivariate analysis can though be applied for other purposes than just clustering items. It is possible to evaluate the material conservation state using PCA. Indeed, the Raman spectra fitting parameters of the external parts of the archeological copals were considered to PCA (Fig. 7), The variables behavior was then studied, and specific criteria that sort the samples depending on their surface degradation state could be extracted. OnFig. 7we can observe that the samples are well sorted thanks to PC1. Indeed, on the negative side of PC1 we have all the red copal samples whereas on the positive side we have the yellow copal samples. Thus, PC1 contains a sufficient part of the exploited variance to separate the two groups of copals. Fig. 7 also describes the projection of the variables obtained after the PCA calculation. The full width at half maximum of bands 5 and 10 (W5 and W10) are correlated variables which have an important contribution to PC1, and which are significant in terms of structural interpretation. As seen before, band 10 is assigned to the vibration of CH vinyl groups and decreases with alteration. So if we plot the items on the base of these two variables, we obtain a chart that sorts the samples according to an axis, represented by an arrow onFig. 8.
If we add an internal part of an archeological copal to this graph, it gets placed in the very beginning of the arrow. This axis can thus be considered as an alteration index to qualify the degradation state of each sample, with the internal sample as a reference (unaltered) point. Indeed, all the yellow copals are in thefirst half on the axis and the red ones on its second part. The first assumption that the samples color is related to the alteration degree is here satisfied. More generally, screening a larger corpus of samples, whether naturally altered or artificially aged, can lead to a more complete calibration tool which can be useful for the diagnostic of the conservation state of a wide range of natural organic substances. Moreover, the difference in the copals surface aspect can inform about the transformations they might have Fig. 5. Score plot and projection of variables on PC1 and PC2. Variables: 40fitting
parameters of the Raman CH bands. Items: 37 reference materials. The materials are much more clustered than inFig. 4. The projection of variables indicates which variables have a important contribution to each PC.
Fig. 6. Score plot of PC1 and PC2. Variables: 40fitting parameters of the Raman CH bands, items: 37 reference samples+20 archeological copals (10 internal and 10 surface sampling). The archeological copals are grouped with the African copals. Moreover, the internal (IS) and external samplings (SS) are in a same group demonstrating that ageing is not, to a certain extent, an obstacle to the material recognition.
undergone, or the archeological environments they were exposed to, or even the geological sources they come from (fossil resins for example).
4. Conclusion
The aim of this study was to develop a methodology that can distinguish between natural organic compounds using their Raman and infrared spectra and that goes beyond a simple logic of “presence or absence of bands”. These two spectroscopies should be used jointly because they are complementary in terms of vibrational responses and molecular interpretations but also in their implementation.
The morphology of the CH stretching region appears to be very informative, but its description requires a multivariate approach. The more relevant parameters are the ones that are related to the molecular structures, hence, the ones extracted from the spectral decomposition. Multivariate analyses were performed on these para-meters and new criteria independent of the material conservation state were obtained, that can discriminate between different chemical families, but also between different geographical provenances of terpenoid resins allowing the reconstruction of ancient commercial routes, or providing information for history of art and techniques. In
order to apply the proposed methodology, a representative spectral database of natural organic substances is needed. As shown for the archeological testing samples, the multivariate analyses should be performed considering the unknown sample as a supplementary item, and its identification would be deduced from its position on the score plot.
All the presented results demonstrate the high potential of this newly developed methodology more especially as it involves non destructive or non invasive analytical techniques. It could find applications in various contexts (archeology, museum context, conservation purpose) and for a wide range of organic materials as varnishes, binders or adhesives.
Acknowledgments
The authors would like to thank the colleagues who provided some of the samples analyzed in this work: Jean-Philippe Échard (Labor-atoire de Recherche et de Restauration, Muséee de la Musique, Citée de la musique) for accessing their collection, and Axelle Rougeulle (UMR8167 Orient et Méditerranée, Textes– Archéologie – Histoire) for allowing the sampling of some archeological artefacts. This work was partly supported by the ANR project EXSUDARCH “EXSUDats et goudrons végétaux en ARCHéologie, chimie, fabrication et utilisations”.
Appendix A. Supporting information
Supplementary data associated with this article can be found in the online version athttp://dx.doi.org/10.1016/j.talanta.2013.06.014.
References
[1]R.P. Evershed, Archaeometry 50 (2008) 895–924.
[2] M.P. Colombini, F. Modugno, (Eds) Organic mass spectrometry in Art and Archaeology, Wiley-Blackwell, Chichester, 2009
[3]M. Regert, J. Sep. Sci. 27 (2004) 244–254.
[4]A. Lluveras, I. Bonaduce, A. Andreotti, M.P. Colombini, Anal. Chem. 82 (2010) 376–386.
[5]M.T. Doménech Carbó, Anal. Chim. Acta 621 (2008) 109–139.
[6]H.G.M. Edwards, D.W. Farwell, D.L., Spectrochim. Acta Part A: Mol. Biomol. Spectrosc. 52 (1996) 1639–1648.
[7]P. Vandenabeele, B. Wehling, L. Moens, H. Edwards, M. De Reu, G. Van Hooydonk, Anal. Chim. Acta 407 (2001) 261–274.
[8]A. Nevin, I. Osticioli, D. Anglos, A. Burnstock, S. Cather, E. Castellucci, Anal. Chem. 79 (2007) 6143–6151.
[9]D. Lau, M. Livett, S. Prawer, J. Raman Spectrosc. 39 (2008) 545–552. [10]C. Daher, C. Paris, A.-S. Le Hô, L. Bellot-Gurlet, J.-P. Echard, J. Raman Spectrosc.
41 (2010) 1204–1209.
[11]A. Rizzo, Anal. Bioanal. Chem. 392 (2008) 47–55.
[12]J.-P. Echard, L. Bertrand, A. von Bohlen, A.-S. Le Hô, C. Paris, L. Bellot-Gurlet, B. Soulier, A. Lattuati-Derieux, S. Thao, L. Robinet, B. Lavédrine, S. Vaiedelich, Angew Chem Int Edit 49 (2010) 197–201.
[13]F. Rosi, A. Daveri, C. Miliani, G. Verri, P. Benedetti, F. Pique, B.G. Brunetti, A. Sgamellotti, Anal. Bioanal. Chem. 395 (2009) 2097–2106.
[14]M. Vagnini, C. Miliani, L. Cartechini, P. Rocchi, B.G. Brunetti, A. Sgamellotti, Anal. Bioanal. Chem. 395 (2009) 2107–2118.
[15]W. Vetter, M. Schreiner, e-Preserv. Sci. (2011) 10–22. [16]H. Schulz, M. Baranska, Vib. Spectrosc. 43 (2007) 13–25.
[17]J. De Gelder, K. De Gussem, P. Vandenabeele, L. Moens, J. Raman Spectrosc. 38 (2007) 1133–1147.
[18]B. Schrader, H. Schulz, G.N. Andreev, H.H. Klump, J. Sawatzki, Talanta 53 (2000) 35–45.
[19]M. de Veij, P. Vandenabeele, T. De Beer, J.-P. Remon, L. Moens, J. Raman Spectrosc. 40 (2009) 297–307.
[20]H.G.M. Edwards, M.J. Falk, M.G. Sibley, J. Alvarez-Benedi, F. Rull, Spectrochim. Acta Part A: Mol. and Biomol. Spectrosc. 54 (1998) 903–920.
[21]R.H. Brody, H.G.M. Edwards, A.M. Pollard, Spectrochim. Acta Part A: Mol. Biomol. Spectrosc. 57 (2001) 1325–1338.
[22]M. Derrick, J. Am. Inst. Conserv. (JAIC) 28 (1989) 43–56.
[23]H.G.M. Edwards, S.E.J. Villar, A.R. David, D.L.A. de Faria, Anal. Chim. Acta 503 (2004) 223–233.
[24]H.G.M. Edwards, D.W. Farwell, S.E.J. Villar, Spectrochim. Acta Part A: Mol. Biomol. Spectrosc. 68 (2007) 1089–1095.
[25]H.G.M. Edwards, Anal. Bioanal. Chem. 397 (2010) 2677–2683. Fig. 7. Score plot and projection of the variables on PC1 and PC2. Variables: 21
fitting parameters of the Raman CH band. Items: 10 archeological copals, surface sampling. The samples are separated in 2 groups among the PC1: the altered and red copals on one side, the dry and yellow copals and the other side. The variables projection shows what parameters have an important contribution to this separa-tion (ex: W10, W5, K5…).
Fig. 8. Plot of 2 correlated variables W10 and W5. The axis represented by the arrow can be considered as an alteration index qualifying the degradation state of each sample.
[26]P. Vandenabeele, D.M. Grimaldi, H.G.M. Edwards, L. Moens, Spectrochim. Acta Part A: Mol. Biomol. Spectrosc. 59 (2003) 2221–2229.
[27]P. Vandenabeele, M. Ortega-Aviles, D.T. Castilleros, L. Moens, Spectrochim. Acta Part A: Mol. Biomol. Spectrosc. 68 (2007) 1085–1088.
[28] Guiliano M., Mille G., Onoratini G., Simon P., C.R. Palevol, Comptes Rendus Palevol, usually abbreviated as CR Palevol. 5 (2006) 851–858.
[29]M. Guiliano, L. Asia, G. Onoratini, G. Mille, Spectrochim. Acta Part A: Mol. Biomol. Spectrosc. 67 (2007) 1407–1411.
[30]L.M. Shillito, M.J. Almond, K. Wicks, L.J.R. Marshall, W. Matthews, Spectrochim. Acta Part A: Mol. Biomol. Spectrosc. 72 (2009) 120–125.
[31]N. Navas, J. Romero-Pastor, E. Manzano, C. Cardell, Anal. Chim. Acta 630 (2008) 141–149.
[32]A. Nevin, D. Comelli, I. Osticioli, L. Toniolo, G. Valentini, R. Cubeddu, Anal. Bioanal. Chem. 395 (2009) 2139–2149.
[33]N. Navas, J. Romero-Pastor, E. Manzano, C. Cardell, J. Raman Spectrosc. 41 (2010) 1486–1493.
[34]M. Regert, T. Devièse, A.-S. Le Hô, A. Rougeulle, Archaeometry 50 (2008) 668–695.
[35] J.S. Mills, R. White, The Organic Chemistry of Museum Objects, 2nd ed., Heinemann, Butterworth, 1994.
[36] D. Scalarone, M. Lazzari, O. Chiantore, J. Anal. Appl. Pyrolysis 68–69 (2003) 115–136.
[37]J. Mallégol, J.L. Gardette, J. Lemaire, J. Am. Oil Chem. Soc. 77 (2000) 257–263. [38] A. Rougeulle, Ann. Islamologiques 38 (2004) 201–253.
[39] Rougeulle A., in: Proceedings of the Seminar for Arabian Studies, 2007, pp. 239–252.
[40] R.H. Brody, H.G.M. Edwards, A.M. Pollard, Biopolymers 67 (2002) 129–141. [41]W. Winkler, E. Kirchner, Ch., A. Asenbaum, M. Musso, J. Raman Spectrosc. 32
(2001) 59–63.
[42] A. Schonemann, H.G.M. Edwards, Anal. Bioanal. Chem. 400 (2011) 1173–1180. [43] J. Romero-Noguera, F.C. Bolivar-Galiano, J.M. Ramos-Lopez, M.A.
Fernandez-Vivas, I. Martin-Sanchez, Int. Biodeterior. Biodegrad. 62 (2008) 427–433. [44]J.H. Langenheim, Plant Resins: Chemistry, Evolution, Ecology, and
Ethnobo-tany, Timber Press, Portland, 2003.