HAL Id: hal-01768821
https://hal.archives-ouvertes.fr/hal-01768821
Submitted on 17 Apr 2018HAL is a multi-disciplinary open access archive for the deposit and dissemination of sci-entific research documents, whether they are pub-lished or not. The documents may come from teaching and research institutions in France or abroad, or from public or private research centers.
L’archive ouverte pluridisciplinaire HAL, est destinée au dépôt et à la diffusion de documents scientifiques de niveau recherche, publiés ou non, émanant des établissements d’enseignement et de recherche français ou étrangers, des laboratoires publics ou privés.
Glyphosate and AMPA passive sampling in freshwater
using a microporous polyethylene diffusion sampler
Vincent Fauvelle, Natalia Montero, Jochen Mueller, Andrew Banks, Nicolas
Mazzella, Sarit Kaserzon
To cite this version:
Vincent Fauvelle, Natalia Montero, Jochen Mueller, Andrew Banks, Nicolas Mazzella, et al.. Glyphosate and AMPA passive sampling in freshwater using a microporous polyethylene diffusion sampler. Chemosphere, Elsevier, 2017, 188, pp.241-248. �10.1016/j.chemosphere.2017.08.013�. �hal-01768821�
1
Glyphosate and AMPA passive sampling in
1freshwater using a microporous polyethylene
2diffusion sampler
3Vincent Fauvelle,a,b,* Natalia Montero,a,c Jochen F. Mueller,a Andrew Banks, a Nicolas Mazzella,d
4
Sarit L. Kaserzona
5
a. The Queensland Alliance for Environmental Health Sciences (QAEHS), The University of 6
Queensland, 39 Kessels Road, Coopers Plains, QLD 4108, Australia
7
b. Aix-Marseille University, Mediterranean Institute of Oceanology, 163 avenue de Luminy,
8
13288 Marseille, France
9
c. Ikerbasque, Basque Foundation for Science, María Díaz Haroko Kalea, 3, 48013 Bilbao, Spain
10
d. Irstea, UR EABX, 50 avenue de Verdun, 33612 Cestas, France
11 12
DOI : 10.1016/j.chemosphere.2017.08.013
13 14
* Corresponding authors: [email protected]; [email protected]
15 16
2
ABSTRACT
17
Glyphosate (PMG) is one of the most widely used herbicides with a reported 8.6 million tons
18
applied globally in 2016. Due to widespread use and limited understanding of long-term
19
environmental impacts, it is expected that future monitoring requirements for PMG and its
20
primary metabolite aminomethyl phosphonic acid (AMPA) in aquatic environments will increase,
21
along with the need for low cost monitoring and risk assessment strategies. The aim of this study
22
was to investigate a microporous polyethylene tube (MPT; 2-mm thickness, 17.6 cm2 surface
23
area, 35 % porosity, 2.5 μm pore size) as a diffusive layer for the passive sampling of PMG and
24
AMPA. Levels of PMG and AMPA sorbed to MPT were low (Kmw close to 1 mL g-1), validating
25
MPT as a diffusive layer. Uptake experiments were conducted first under controlled laboratory
26
conditions (pH = 6.8, 6 days) followed by an in situ freshwater lake system deployment (pH =
27
7.3, 11 days). PMG and AMPA accumulated linearly (slope relative standard deviation < 6 %)
28
under laboratory conditions with sampling rates (Rs) of 18 and 25 mL d-1, respectively. PMG in
29
situ Rs was 28 mL d-1, and was not different from the one found in laboratory. AMPA was below
30
the limit of quantification (LOQ, 1 ng mL-1) in grab water samples, but was detected (> LOQ) in
31
all passive samplers. Results illustrate the gain in sensitivity provided by the passive sampling
32
technique, and the applicability of the device developed for the passive sampling of PMG and
33
AMPA.
3
1. INTRODUCTION
35
Glyphosate (N-phosphonomethyl glycine, i.e. PMG) is the active substance of more than 750
36
commercial formulation (i.e., glyphosate-based herbicides, GBHs) and the most widly used
37
herbicide for agricultural and non-crop uses, both in Australia (15,000 tons y-1) and worldwide
38
(826,000 tons y-1) (Benbrook, 2016). The primary breakdown pathway of this polar (log K ow =
-39
4.59 to -1.70) and ionic (zwitterion at all pH) organic compound is through microbial
40
degradation, resulting in the production of aminomethyl phosphonic acid, i.e. AMPA (Annett et
41
al., 2014). After spraying onto land of GBHs, the leaching of PMG and AMPA and consequent
42
transport into waterways will depend on application rates, soil properties and rainfall (Borggaard
43
and Gimsing, 2008). Another crucial parameter affecting PMG transport, degradation and
44
availability is the formation of complexes with natural occurring metal cations (Magbanua et al.,
45
2013; Shushkova et al., 2010; Zhou et al., 2013). However, due to the high solubility of PMG
46
(10.1-15.7 g L−1 at 25°C) and AMPA (5.8 g L−1 at 25°C) in water, they are typically mobile and are
47
usually found together in most water bodies (Annett et al., 2014; Aparicio et al., 2013; Battaglin
48
et al., 2014; Comoretto et al., 2007; Coupe et al., 2012; Mercurio et al., 2014; Stewart et al.,
49
2014).
50
PMG and AMPA present complex chemical properties (i.e., high water solubility, poor solubility
51
in organic solvents, high complexation capacity) which complicate their extraction and analysis
52
in water at environmental trace levels. Accordingly, a derivatization step is needed to increase the
53
selectivity and sensitivity of the analysis (Arkan and Molnár-Perl, 2015; Dong et al., 2015). Thus,
54
PMG and AMPA are often not included in routine monitoring programs, as they require
55
specialized analysis which increases the costs of monitoring programs, although PMG and
56
AMPA are prioritized by the European network Norman (www.normandata.eu). Otherwise, these
4
substances were recently the subject of a considerable debate concerning their carcinogenic effect
58
on human health (Portier et al., 2016). Due to limited knowledge of the effects of chronic
59
exposure to low levels of PMG and AMPA (i.e., low ng L-1 range in aquatic systems), it is
60
expected that future monitoring requirements for these compounds in aquatic environments will
61
increase, along with the need for reliable, highly-sensitive and low-cost monitoring techniques.
62
Passive sampling may address these three fundamental requirements.
63
Since their development in the early 2000’s (Alvarez et al., 2004; Kingston et al., 2000), passive
64
sampling techniques of polar compounds (i.e., the Polar Organic Chemical Integrative Sampler
65
(POCIS) and Chemcatchers) have been successfully used for the measurement of a wide range of
66
organic compounds in aquatic systems. Subsequently, passive sampling methods were adapted
67
for the monitoring of ionizable organic compounds in water systems (Fauvelle et al., 2014, 2012,
68
Kaserzon et al., 2014, 2012; Li et al., 2011). Aiming to target PMG and AMPA, a previous study
69
adapted the Diffusive Gradient in Thin-film (DGT) passive sampling technique with a TiO2
70
receiving phase (Fauvelle et al., 2015), while another adapted the POCIS design using
71
molecularly imprinted polymer (MIP) as a receiving phase (Berho et al., 2017). Both TiO2 and
72
MIP sorption phases successfully accumulated these analytes. However, limitations of the
73
developed sampling tools include:
74
i) the low sampling rates (Rs) achieved for PMG and AMPA with the DGT based
75
sampler, i.e. around 10 mL day-1 (Fauvelle et al., 2015), which affects the sensitivity
76
and applicability of the sampler under environmental conditions
77
ii) the dependency of the analytes flux and sampling rates on the external water velocity
78
(i.e., water boundary layer thickness; WBL) with the POCIS based sampler, which
5
can increase the uncertainty of water concentration estimates (Berho et al., 2017;
80
Fauvelle et al., 2017)
81
iii) the absence of in situ testing of the devices developed
82
A higher Rs (Eq. 1) can be obtained by increasing the product of the exposure surface area of the
83
sampler (A) and the overall mass transfer coefficient (ko):
84
𝑅
"= A × 𝑘
'(1)
85
ko (Eq. 2) is dependent on the MTCs (mass transfer coefficients) of each successive compartment
86
of the sampler (Booij et al., 2017), as evidenced by the expression of the resistance to mass
87 transfer (1/ ko): 88 ( )*
=
( )++
( -.+).+
( -/+)/(2) 89
Where kw, km, ks are the MTC for the WBL, the membrane (microporous polyethylene tube in our
90
case, MPT), and the sorbent respectively, and Kmw, Ksw are the sorption coefficients of the
91
membrane and the sorbent. When Kmw = 1, and transport through the membrane (MPT) is only via
92
the pore space (i.e., filled with water), Eq. 2 becomes (Fauvelle et al., 2017):
93 ( )*
=
1 2++
345 62++
( -/+)/(3) 94
Where d and d are WBL and membrane thicknesses, Dw is the contaminant diffusion coefficient
95
in water, q is the tortuosity, and f is the membrane porosity.
6
Otherwise, a promising way to limit the influence of WBL thickness can be found in increasing
97
the second term of Eq. 3, e.g. increasing d (Belles et al., 2017; Chen et al., 2013; Fauvelle et al.,
98
2017).
99
In the present study, we propose to assess MPT (d = 2 mm thick, A = 17.6 cm2, f = 35% porosity,
100
2.5 μm pore size) as a diffusion barrier filled with a receiving phase consisting of TiO2 particles
101
embedded in an agarose gel. Compared to the conventional DGT, A is increased from 3.14 to
102
17.6 cm2 (factor of 5.6), d is increased from 0.8 to 2 mm (factor of 2.5), f is decreased from
103
almost 100 % to 35 % (factor of 3), and q2 could be also decreased from 3 to 1. Indeed, q2 is
104
supposed to be much higher in a gel than in MPT, as Belles et al. observed lower (factor of 3 to
105
factor of 9) diffusion coefficients for polar organic substances in hydrogels than in water (Belles
106
et al., 2017). Therefore, in light of Eq. 3, MPT could increase Rs by a factor of 2, and as Rs is
107
proportional to A, increasing MPT length will increase Rs accordingly when required. Otherwise,
108
resistance to mass transfer induced by MPT should be 4 times higher than the one induced by the
109
WBL, considering a worst case d value of 1.50 ± 0.013 mm in an unstirred medium (Warnken et
110
al., 2006; with d = 2 mm, q2 = 1, f = 35 %), suggesting a full MPT control (i.e., low dependency
111
to flowing conditions) of the diffusion of PMG and AMPA across the sampler.
112
The objectives of this study were i) to determine Kmw for PMG and AMPA to ensure their
113
transport is occurring only via the pore space and to avoid any interferences during the sampling,
114
ii) to verify that MPT is the compartment of the sampler providing the higher resistance to mass
115
transfer, and iii) to evaluate the performances of the sampler in situ.
116
2. EXPERIMENTAL SECTION
117
2.1. Chemicals and reagents
7
Acetonitrile (ACN), methanol (MeOH) and dichloromethane (DCM) were purchased from Merck
119
(Darmstadt, Germany) and their purity were higher than 99.8%. Trimethylamine (TEA) was
120
obtained from Atifina Chemicals Inc. (USA) and its purity was 99.5%. Water with resistivity >
121
18.2 MW (MQ) was produced by a Millipore system. Glyphosate (PMG),
122
aminomethylphosphonic acid (AMPA), 13C
2-15N-PMG, 13C-15N-D2-AMPA, agarose, titanium dioxide
123
(325 mesh, TiO2), sodium borate, ethylenediaminetetraacetic acid disodium (EDTA),
124
fluorenylmethyloxycarbonyl chloride (FMOC) were purchased from Sigma-Aldrich (China).
125
NaOH pellets were obtained from Selby Biolab (Calyton, Victoria, 97% purity).
126
2.2. Passive sampler procedure
127
Passive sampler assembly
128
Microporous Polyethylene Tubes (MPTs) were purchased from Pall Corp. Crailsheim, Germany
129
(Filtroplast®, 12 mm O.D., 8 mm I.D., 35% porosity, 2.5 μm pore size, 0.6 g cm-3 density). Tubes
130
were cut in cylinders (8 cm length), solvent cleaned in a 400-mL jar with MeOH for 2 hours and
131
stored in MQ until assembly. 200 mg of agarose gel, 216 mg of TiO2 and 10 mL of MQ were
132
mixed together at 90°C for 10 min in single-use 15-mL polyethylene conical centrifuge tubes.
133
The mixture was immediately cast into a nonporous plastic tube (8 mm I.D.; 25 cm length), and
134
then placed in an ice bath for 1 h to get a homogeneous distribution of the TiO2 particles in the
135
agarose matrix. Tubes were stored in the fridge for ~ 2 hours (until the mixture solidified). The
136
TiO2 + agarose gels were removed from the plastic tubes, cut in 7 cm length pieces, and then
137
allowed to sit for 30 min at ambient temperature to shrink (i.e., through desiccation) and facilitate
138
their subsequent introduction into the MPTs. Plastic tube inserts (5 mm length each, Stockcap,
139
Sydney, Australia) were used to cap the tubes at both ends. Assembled MPT samplers (see
8
Supplementary Material Figure 1) were stored in MQ until deployment. A total sampler exposure
141
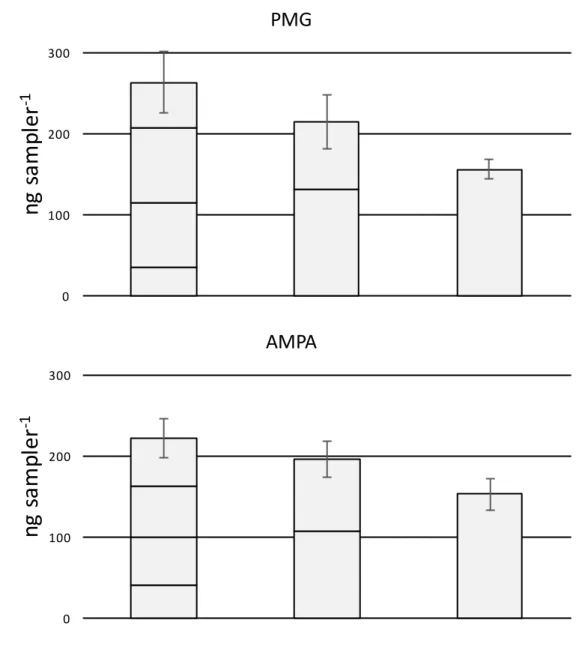
area of 17.6 cm2 (vs. 3.14 for a DGT housing) was considered for each MPT device i.e.,
142
considering the internal diameter of the MPT in contact with the receiving phase (Cristale et al.,
143
2013).
144
Extraction of passive samplers
145
After deployment, samplers were stored in the fridge at 4 °C until extraction within a week.
146
Entire MPT samplers were placed in 15-mL polyethylene conical centrifuge tubes with 4 mL of
147
0.3 M NaOH. Tubes were placed on a shaker (60 rpm) in the darkness. Different extraction times
148
(i.e. 24, 48 and 96 h) were tested with the passive samplers deployed in situ for 11 days. No
149
significant differences were found in PMG and AMPA concentrations measured at different
150
extraction times, and thus, hereafter, a 24 h elution step was performed with the all samplers.
151
After extraction, a derivatization step was performed (see section 2.4). As only 400 μL were used
152
for the derivatization step, a correction factor (22.5) was finally applied according to the overall
153
water content of the extract (9 mL): selectively the NaOH extraction fraction (4 mL), the gel
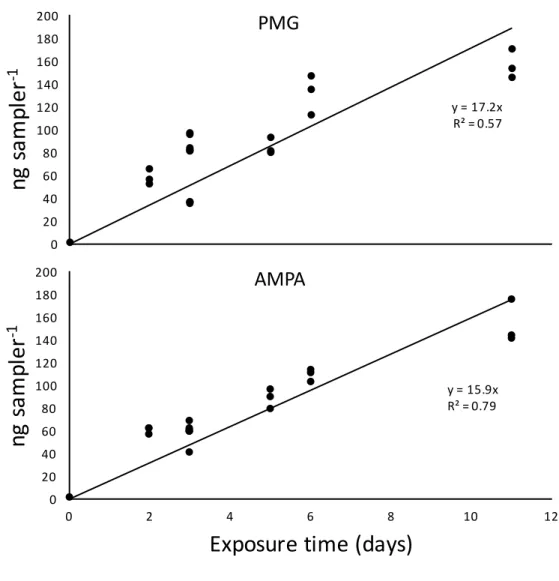
154
water content (i.e., total gel volume 3.5 mL, consisting of more than 95% of water) and the MPT
155
pore water content (i.e., tube volume × f = 1.5 mL).
156
2.3. Water samples procedure
157
Grab water samples (20 mL) were filtered through 0.45 μm regenerated-cellulose filters (Agilent)
158
and were not pre-concentrated prior to the derivatization step (see section 2.4). When not
159
analyzed the same day, samples were stored at –18°C.
160
2.4. Derivatization step
9
In order to reach sufficient retention on a C18 reversed phase chromatographic analytical column,
162
analytes were derivatized using FMOC-Cl, as suggested in ISO 16308:2014. Briefly, 400 μL of
163
sample (i.e. passive sampler eluate or grab water sample) was transferred in a 15-mL
164
polyethylene falcon tube, together with 480 μL of borate buffer (10 g L-1 of sodium tetraborate in
165
MQ). Then, 20 μL of internal standard solution (1 ng μL-1 13C
2-15N-PMG and 13C-15N-D2-AMPA), 40
166
μL of EDTA (29.2 g L-1 of EDTA-Na
2 in MQ, pH adjusted to 8 with NaOH for improved
167
dissolution) and 60 μL of FMOC (12 g L-1 of FMOC-Cl in ACN) was added (final pH was 9).
168
Samples were shaken after each addition and then left overnight at room temperature in the dark
169
for complete derivatization of the analytes. Next day, the excess of FMOC was removed by
170
adding 300 μL of DCM, shaking, and recovering the upper aqueous phase (~ 500 µL). Final
171
eluents were placed in amber glass LC vials and stored in the fridge (4 °C) until analysis (within
172
3-4 days).
173
2.5. Analytical method
174
Sample analysis methodology was adapted from previous studies (Fauvelle et al., 2015; Freuze et
175
al., 2007). Briefly, analysis was performed on HPLC-MS/MS using an AB/Sciex API6500+Q
176
mass spectrometer (Sciex, Concord, Ontario, Canada) equipped with an electrospray (TurboV)
177
interface coupled to a Shimadzu Nexera HPLC system (Shimadzu Corp., Kyoto, Japan).
178
Glyphosate, AMPA and their analogues, derivatized with FMOC-Cl, were separated by a
179
Phenomenex Gemini-NX column (50 mm length, 3 μm particle size, 2.1 mm diameter). Mobile
180
phase consisted of a 0.1 % TEA aqueous solution pH adjusted to 9.5 with acetic acid (A), and
181
MeOH/ACN 50:50 (v/v) (B). The analytical gradient was set at 92:8 (A/B) for 1.5 min; B was
182
then increased linearly to 95% during 1.5 min and kept constant for another 1.5 min. B was
183
decreased thereafter to initial conditions during 1.5 min, and a final 5 min equilibrating phase was
10
applied at the end of the gradient (11 min run). The mobile phase flow rate was set at 400 µL min
-185
1, and the column oven temperature was 40 °C. Mass acquisition was performed using selected
186
reaction monitoring (SRM) and negative ESI mode (Fauvelle et al., 2015). A 6-point calibration
187
curve (from 1 to 200 ng mL-1) was prepared and derivatized according to the protocol described
188
above (section 2.4). Instrumental limits of quantification were estimated at 0.5 ng mL-1 for PMG
189
and 1 ng mL-1 for AMPA. It is noteworthy that TEA resulted in the contamination of the mass
190
spectrometer. This can be mitigated by flushing the system with a mix of solvents
191
(isopropanol/ACN/MeOH) for 24 h. However, low levels of TEA remained detectable. Replacing
192
TEA by ammonium acetate will avoid contaminations, at the expense of chromatographic
193
parameters (worst peak shape and lower retention time).
194
2.6. Adsorption on MPT
195
To ensure transport is only occurring via the pore space, and is not delayed because of the
196
diffusive material (Fauvelle et al., 2017), MPT to water partition coefficient (Kmw = CMPT.Cw-1, with
197
CMPT the concentration in MPT and Cw the concentration in water) values for PMG and AMPA
198
were determined. To this end, 8 cm MPTs (n = 3) were conditioned (see section 2.2), and
199
immersed individually for 72 h in 10 mL of a 10 µg L-1 aqueous solution of both analytes. Three
200
controls with no MPT ensured the solution stability for the whole experiment duration. Water
201
concentration was measured at the end of the experiment in the 3 above mentioned controls and
202
in the 3 samples containing MPT. Kmw after 72 h of exposure (mL g-1) was determined as the
203
concentration ratio in the MPT (i.e., deduced from water concentration balance before and after
204
exposure, ng g-1) and in the water (ng mL-1).
205
2.7. MPT sampler laboratory calibration
11
Laboratory calibration of TiO2 gels, naked or inserted in MPTs, was performed in two separated 3
207
L plastic beakers filled with ultrapure water (one for 8 MPT samplers, another one for 8 naked
208
TiO2 gels). The calibration system was spiked with PMG and AMPA and allowed to equilibrate
209
for 24 h before samplers’ exposure. Water concentrations were measured daily (5 ± 0.8 and 10 ±
210
2.7 μg L-1 for PMG and AMPA, respectively). Duplicates of TiO
2 gels, naked and enclosed in
211
MPTs, were retrieved after 1, 2, 3 and 6 days, and treated according to the method described
212
above. Naked TiO2 gels and MPT samplers were enclosed in a nylon mesh (2 mm mesh) together
213
with a PTFE weight to ensure that samplers were completely submerged throughout the
214
experiment (Supplementary material Figure 2). Shaking was performed using a rotary shaker (60
215
rpm) and beakers were completely covered in aluminum foil. The temperature and pH of the
216
system were periodically checked and were in the range 22-25°C and 6.8-7, respectively.
Non-217
linear regressions were fitted using Addinsoft XL-STAT software 19.02.
218
2.8. MPT sampler in situ calibration
219
A field calibration was performed in a drinking water reservoir in South East Queensland,
220
Australia (Wappa Dam, 26.572105 °S, 152.922028 °E) in May 2016 (Supplementary material
221
Figure 3). Triplicate MPT samplers were deployed in staggered configuration for 2, 3, 5, 6 and 11
222
days. Each triplicate was deployed in stainless steel cages (5 mm mesh). Grab samples for water
223
concentration measurements (see section 2.3) were taken every 2 or 3 days, together with the
224
passive sampler replacement or retrieval. Wappa Dam, along with many other freshwater bodies
225
in South East Queensland, are subject to excessive growth of aquatic weeds (e.g., Salvinia, water
226
lettuce, water hyacinth) that may affect water quality (e.g., depleting dissolved oxygen,
227
increasing nutrient load) and wildlife habitat. Therefore, one type of chemical control that is
228
routinely implemented, to restrain weed growth, consists of spraying glyphosate onto newly
12
grown weeds. The MPT samplers were deployed about 2 h post spraying of glyphosate in the
230
dam. Physico-chemical parameters (i.e., temperature, conductivity, pH, turbidity, dissolved
231
oxygen) and total and dissolved concentrations of major and trace elements (i.e., Ca, Mg, Al, Cd,
232
Co, Cu, Fe, Mn, Zn) were measured every 3 days (Supplementary material Table 1).
233
2.9. Quality assurance and quality control
234
Passive sampler blanks, MQ blanks, analytical blanks, and non-extracted spikes were prepared
235
and treated along with passive and water samples. Positive controls were made by checking the
236
intensity of internal standards (PMG and AMPA 13C) spiked in all the samples and QA/QC
237
samples (always between 81 and 115% recoveries). A 6-point calibration curve ensured the
238
efficiency of the derivatization protocol for native PMG and AMPA. No PMG or AMPA were
239
detected in any blanks or negative controls, relative standard deviation (RSD) of passive
240
samplers’ replicates were within 3 and 18% for both laboratory and field deployments.
241
3. RESULTS AND DISCUSSION
242
3.1. PMG and AMPA adsorption on MPT
243
Kmw values (see section 2.6) for PMG and AMPA were found to be close to 1 (1.07 ± 0.17 and
244
0.76 ± 0.07 mL g-1, respectively), meaning comparable quantities are found in MPT and in water.
245
Therefore, adsorption at the MPT surface can be expected to be minimal for the diffusive layer
246
selected and consequently, it is assumed that diffusion only occurs via the MPT pores. The
247
diffusive material of a passive sampler should otherwise have a low affinity towards the analytes
248
of interest to avoid any interferences during the sampling that may complicate data interpretation,
249
e.g. delayed accumulation in the receiving phase (Belles et al., 2014; Vermeirssen et al., 2012).
13
The low Kmw for the compounds of interest suggests that the surface of the MPT will interact only
251
minimally with the compounds and thus not affect their diffusion into the sampling phase which
252
simplifies modelling.
253
3.2. Uptake of PMG and AMPA in TiO2 gels and MPT passive samplers
254
255
Figure 1. Uptake of PMG and AMPA in naked TiO2 + agarose gels (open circles) and in TiO2 +
256
agarose gels inserted in microporous polyethylene tubes (MPTs) (full circles), under laboratory
257 y = 18.6x R² = 0.930 0 50 100 150 200 250 300 350 0 1 2 3 4 5 6 7
Co
nc
en
tr
at
io
n
fa
ct
or
(m
L
sa
m
pl
er
-1)
Exposure (d)
PMG
TiO2 gel naked TiO2 gel + PE tube y = 25.4 x R² = 0.911 0 100 200 300 400 500 600 700 800 900 0 1 2 3 4 5 6 7Co
nc
en
tr
at
io
n
fa
ct
or
(m
L
sa
m
pl
er
-1)
Exposure (d)
AMPA
TiO2 gel naked TiO2 gel coated in MPT14
controlled conditions. An indicative first order kinetic [y=K(1-e-k´t)] was fitted to the non-linear
258
data.
259
A second experiment was set up to evaluate the uptake kinetic of PMG and AMPA in the TiO2 +
260
agarose gel both with and without the MPT housing. In both cases, no measurable lag phase was
261
observed at the beginning of the sampling, confirming no high interactions analytes and MPT.
262
Looking at the first order kinetics [y=K(1-e-k´t)], the mass of analyte sampled reached a
pseudo-263
plateau (K = 307 ± 21 and 831 ± 29 mL sampler-1 for PMG and AMPA respectively) within a
264
couple of days without MPT. Kinetics seem however, on the basis of our data, increasing beyond
265
those pseudo-plateaux. Thus, the actual TiO2 to water distribution coefficient could be higher than
266
those values. The slope at t = 0 (i.e., k) gave otherwise an estimation of the analytes fluxes in TiO2
267
gels naked of 156 ± 28 and 475 ± 46 mL day-1 for PMG and AMPA respectively. These data are
268
to be compared with the analytes fluxes in the case of TiO2 gels covered by MPT: we observed
269
experimental Rs values of 18.4 ± 0.9 and 25.4 ± 1.4 mL day-1 for PMG and AMPA, respectively
270
(Fig. 1; Eq 1). Thus, the mass transfer resistance by the MPT is almost 10 times higher than the
271
receiving phase alone. We can therefore consider a large control of contaminants fluxes by MPT
272
to the receiving phase. Rs values measured with MPT are otherwise twice higher than those
273
reported for o-DGT (Chen et al., 2013, 2012; Fauvelle et al., 2015), which shows the ability of
274
MPT based passive sampler to increase Rs, which was identified a main issue of o-DGT.
275
Considering Eq 1 and 3 with A = 17.6 cm2, f = 35%, d = 2 mm, and adopting q = 1, and a typical
276
Dw value for organic acids of 5 to 10×10-10 m2 s-1, we can predict a generic Rs between 13 and 27
277
mL day-1, which is in good agreement with the experimental data mentioned above. The
278
difference in Rs estimates between PMG and AMPA is likely to be attributed to the higher Dw of
15
AMPA related to its lower molecular weight and steric hindrance. The same pattern was also
280
observed in a previous study (Fauvelle et al., 2015).
281
The role of the water boundary layer, whose thickness depends on hydrodynamics, was not
282
investigated here. Nevertheless, assuming no water advection phenomena within the MPT matrix,
283
the 2-mm thick MPT with f = 35% (d/f = 5.71, Eq. 3 with q = 1) used here should be able to
284
minimize the effect of the WBL with typical thicknesses between 0.230 ± 0.032 mm under stirred
285
conditions, increasing up to 1.50 ± 0.013 mm in an unstirred medium (Warnken et al., 2006).
286
Thereby, the maximum error on sampling rates would be lower than 20% whatever the flowing
287
conditions (except in the theoretical case of zeroflow where d is infinite).
288
3.3. Calibration of MPT passive samplers for PMG and AMPA in freshwater lake
289
MPT samplers were deployed in overlapping and consecutive periods (Fig. 2) in order to check
290
the accuracy and consistency of the PMG and AMPA uptake in the samplers (Allan et al., 2008).
291
If uptake over time is uniform, all three bars should show the same level of mass accumulated
292
after 11 days of exposure. Similar uptake was observed at the shortest deployment times (i.e. 3+3
293
d and 6 d), but contaminant fluxes seem to decrease with increasing exposure duration (3 bars
294
statistically different, Kruskal-Wallis test, α = 0.05). This might be explained by i) the increased
295
pathway thickness due to the equilibrium reached with the surface TiO2 particles of the receiving
296
phase, and ii) the addition of an increasing resistance attributed to biotic or abiotic fouling (i.e.,
297
additional thickness of the MPT layer due to the development of biofilm at the surface of the
298
sampler or pore clogging by natural particles, increasing d or lowering f, respectively). Another
299
possibility is the potential degradation of the compounds sequestered inside the sampler, since
300
MPT pore size is big enough to allow the passage of microorganisms. These phenomena may
16
imply an underestimation of the time-weighted average concentrations and require further
302
investigation.
303
304
Figure 2. Mass of PMG and AMPA accumulated in MTP passive samplers deployed in Wappa
305
dam. Left bar represents the sum of 4 x triplicate samplers exposed successively for 3 or 2 days.
306
Middle bar is the sum of 2 x triplicate samplers exposed successively for 6 and 5 days. Right bar
307
is the analyte mass found in the single triplicate sampler exposed for the entire 11 days. Error
308
bars are the square roots of the sums of squared standard deviations (n = 3).
309 0 100 200 300
ng
s
am
pl
er
-1PMG
0 100 200 300ng
s
am
pl
er
-1AMPA
17
Uptake results for PMG and AMPA in MPT samplers deployed in Wappa dam are presented in
310
Fig. 2 and 3. The concentration of PMG directly measured in grab water samples (collected every
311
3 days) was found to be relatively constant (0.77 ± 0.12 ng mL-1, Supplementary Material Figure
312
4, LOQ = 0.5 ng mL-1), whereas AMPA concentration in grab samples was always below the
313
LOQ (1 ng mL-1). In MPT passive samplers, a linear relationship between the analyte mass
314
accumulated in the sampler and the exposure duration was observed (Fig. 3) for both PMG and
315
AMPA. The PMG mass accumulated after 11 days of exposure is below the linear regression,
316
which can be partially explained by the lower concentration reported at the end of the experiment
317
(Supplementary Material Figure 4). Although AMPA was not detected in grab samples, linear
318
uptake of the analyte in the MPT passive samplers was observed (Fig. 3), which demonstrate the
319
better sensitivity of MPT technique compare to grab sample directly injected. Taking into
320
account the previously determined Rs for AMPA (Fig. 1, 25.4 ± 1.4 mL day-1), and the slope of
321
Fig. 3 (i.e. average mass of AMPA accumulated per day, 15.9 ± 0.7 ng day-1), we can estimate a
322
hypothetical time averaged AMPA concentration of 0.63 ng mL-1 during the experiment, which is
323
below the analytical LOQ of grab water samples.
18
325
Figure 3. Mass of PMG and AMPA accumulated in MTP passive samplers in Wappa dam as a
326
function of exposure duration.
327
PMG accumulation in MTP passive samplers deployed in surface water (in situ experiment) and
328
in MQ (laboratory experiment) is illustrated in Fig. 4. The slopes indicate the sampling rates in
329
each exposure environment. The 6-day averaged sampling rates are 50 % higher in the field than
330
in the laboratory. However, the distribution of the in situ data points is scattered, and slopes are
331
rather close to the theoretical one determined in section 3.2 (13 to 27 mL day-1).
332 y = 17.2x R² = 0.57 0 20 40 60 80 100 120 140 160 180 200 0 2 4 6 8 10 12
ng
s
am
pl
er
-1Exposure (d)
PMG
y = 15.9x R² = 0.79 0 20 40 60 80 100 120 140 160 180 200 0 2 4 6 8 10 12ng
s
am
pl
er
-1Exposure time (days)
AMPA
19
A previous study mentioned the presence of metal cations as a potential interfering factor with
333
the accumulation of PMG and AMPA in passive samplers (Fauvelle et al., 2015). That
334
interference was not observed in the current study, because similar concentration factors were
335
observed in the laboratory and in situ. An explanation can be found in the different bivalent
336
cation composition of each study, which may differ by an order of magnitude (see Supplementary
337
Material Table 1). A special attention should then be paid to the inorganic composition of each
338
medium sampled.
339
340
Figure 4. Concentration factor (mL sampler-1) of PMG in MPT passive samplers in surface water
341
(open circles) and in MQ water (full circles). Slopes represent the sampling rates over the 6-day
342
period.
343
The use of MPT samplers allowed the measurement of low PMG and AMPA concentrations in
344
the aquatic environment. This study is part of several recent studies aimed at improving the
345 y = 28x R² = 0.63 y = 18x R² = 0.93 0 50 100 150 200 250 0 1 2 3 4 5 6 7
Co
nc
en
tr
at
io
n
fa
ct
or
(m
L
sa
m
pl
er
-1)
Exposure (d)
PMG
20
passive sampling of polar organic compounds. It opens the possibility of applying them in other
346
complex systems, presenting low concentrations, such as the marine environment. Accordingly,
347
future studies would focus on testing the reliability and robustness of the performance of MPT
348
passive samplers under different environmental conditions.
349
ACKNOWLEDGMENTS
350
The authors are grateful to Kelvin O’Halloran, Cameron Veal and Daniel Guinea (Seqwater) for
351
sampling aid and technical support. Elissa O’Malley, Chris Paxman, Geoff Eaglesham, Kristie
352
Thompson, Jennifer Braunig (QAEHS) and Marion Cerou for sampling support. Natalia Montero
353
was funded by the Basque Government Postdoctoral Fellowship Program. Jochen Mueller was
354
funded by an Australian Research Council (ARC) Future Fellowship (FF120100546) and
355
Australian Linkage Infrastructure, Equipment and Facilities (LIEF) grant (LE140100129). 356
REFERENCES
357
Allan, I.J., Knutsson, J., Guigues, N., Mills, G.A., Fouillac, A.-M., Greenwood, R., 2008.
358
Chemcatcher® and DGT passive sampling devices for regulatory monitoring of trace metals
359
in surface water. J. Environ. Monit. 10. doi:10.1039/b802581a
360
Alvarez, D.A., Petty, J.D., Huckins, J.N., Jones-Lepp, T.L., Getting, D.T., Goddard, J.P.,
361
Manahan, S.E., 2004. Development of a passive, in situ, integrative sampler for hydrophilic
362
organic contaminants in aquatic environments. Environ. Toxicol. Chem. 23, 1640–1648.
363
Annett, R., Habibi, H.R., Hontela, A., 2014. Impact of glyphosate and glyphosate-based
364
herbicides on the freshwater environment. J. Appl. Toxicol. 34. doi:10.1002/jat.2997
365
Aparicio, V.C., De Gerónimo, E., Marino, D., Primost, J., Carriquiriborde, P., Costa, J.L., 2013.
366
Environmental fate of glyphosate and aminomethylphosphonic acid in surface waters and
367
soil of agricultural basins. Chemosphere 93, 1866–73.
368
doi:10.1016/j.chemosphere.2013.06.041
369
Arkan, T., Molnár-Perl, I., 2015. The role of derivatization techniques in the analysis of
370
glyphosate and aminomethyl-phosphonic acid by chromatography. Microchem. J. 121.
21
doi:10.1016/j.microc.2015.02.007
372
Battaglin, W.A., Meyer, M.T., Kuivila, K.M., Dietze, J.E., 2014. Glyphosate and its degradation
373
product AMPA occur frequently and widely in U.S. soils, surface water, groundwater, and
374
precipitation. J. Am. Water Resour. Assoc. 50. doi:10.1111/jawr.12159
375
Beeton, R., Buckley, K., Jones, G., Morgan, D., Reichelt, R., Trewin, D., 2006. Australia State of
376
the Environment.
377
Belles, A., Alary, C., Aminot, Y., Readman, J.W., Franke, C., 2017. Calibration and response of
378
an agarose gel based passive sampler to record short pulses of aquatic organic pollutants.
379
Talanta 165, 1–9. doi:10.1016/j.talanta.2016.12.010
380
Belles, A., Pardon, P., Budzinski, H., 2014. Development of an adapted version of polar organic
381
chemical integrative samplers (POCIS-Nylon). Anal. Bioanal. Chem. 406, 1099–1110.
382
doi:10.1007/s00216-013-7286-2
383
Benbrook, C.M., 2016. Trends in glyphosate herbicide use in the United States and globally.
384
Environ. Sci. Eur. 28. doi:10.1186/s12302-016-0070-0
385
Berho, C., Claude, B., Coisy, E., Togola, A., Bayoudh, S., Morin, P., Amalric, L., 2017.
386
Laboratory calibration of a POCIS-like sampler based on molecularly imprinted polymers
387
for glyphosate and AMPA sampling in water. Anal. Bioanal. Chem.
doi:10.1007/s00216-388
016-0150-4
389
Booij, K., Maarsen, N.L., Theeuwen, M., van Bommel, R., 2017. A method to account for the
390
effect of hydrodynamics on polar organic compound uptake by passive samplers. Environ.
391
Toxicol. Chem. doi:10.1002/etc.3700
392
Borggaard, O.K., Gimsing, A.L., 2008. Fate of glyphosate in soil and the possibility of leaching
393
to ground and surface waters: A review. Pest Manag. Sci. 64. doi:10.1002/ps.1512
394
Chen, C.-E., Zhang, H., Jones, K.C., 2012. A novel passive water sampler for in situ sampling of
395
antibiotics. J. Environ. Monit. 14, 1523–30. doi:10.1039/c2em30091e
396
Chen, C.-E., Zhang, H., Ying, G.-G., Jones, K.C., 2013. Evidence and recommendations to
397
support the use of a novel passive water sampler to quantify antibiotics in wastewaters.
398
Environ. Sci. Technol. 47, 13587–93. doi:10.1021/es402662g
399
Comoretto, L., Arfib, B., Chiron, S., 2007. Pesticides in the Rhône river delta (France): basic data
400
for a field-based exposure assessment. Sci. Total Environ. 380, 124–32.
401
doi:10.1016/j.scitotenv.2006.11.046
402
Coupe, R.H., Kalkhoff, S.J., Capel, P.D., Gregoire, C., 2012. Fate and transport of glyphosate
403
and aminomethylphosphonic acid in surface waters of agricultural basins. Pest Manag. Sci.
404
68. doi:10.1002/ps.2212
22
Cristale, J., Katsoyiannis, A., Chen, C., Jones, K.C., Lacorte, S., 2013. Assessment of flame
406
retardants in river water using a ceramic dosimeter passive sampler. Environ. Pollut. 172,
407
163–169. doi:10.1016/j.envpol.2012.08.014
408
Dong, Y.-L., Guo, D.-Q., Cui, H., Li, X.-J., He, Y.-J., 2015. Magnetic solid phase extraction of
409
glyphosate and aminomethylphosphonic acid in river water using
410
Ti<sup>4+</sup>-immobilized
411
Fe<inf>3</inf>O<inf>4</inf> nanoparticles by capillary
412
electrophoresis. Anal. Methods 7. doi:10.1039/c5ay00109a
413
Fauvelle, V., Kaserzon, S.L., Montero, N., Lissalde, S., Allan, I.J., Mills, G., Mazzella, N.,
414
Mueller, J.F., Booij, K., 2017. Dealing with Flow Effects on the Uptake of Polar
415
Compounds by Passive Samplers. Environ. Sci. Technol. 51, 2536–2537.
416
doi:10.1021/acs.est.7b00558
417
Fauvelle, V., Mazzella, N., Belles, A., Moreira, A., Allan, I.J., Budzinski, H., 2014. Optimization
418
of the polar organic chemical integrative sampler for the sampling of acidic and polar
419
herbicides. Anal. Bioanal. Chem. 406, 3191-3199. doi:10.1007/s00216-014-7757-0
420
Fauvelle, V., Mazzella, N., Delmas, F., Madarassou, K., Eon, M., Budzinski, H., 2012. Use of
421
mixed-mode ion exchange sorbent for the passive sampling of organic acids by polar
422
organic chemical integrative sampler (POCIS). Environ. Sci. Technol. 46, 13344–13353.
423
Fauvelle, V., Nhu-Trang, T.-T., Feret, T., Madarassou, K., Randon, J., Mazzella, N., 2015.
424
Evaluation of Titanium Dioxide as a Binding Phase for the Passive Sampling of Glyphosate
425
and Aminomethyl Phosphonic Acid in an Aquatic Environment. Anal. Chem. 87, 6004–9.
426
doi:10.1021/acs.analchem.5b00194
427
Freuze, I., Jadas-Hecart, A., Royer, A., Communal, P.-Y., 2007. Influence of complexation
428
phenomena with multivalent cations on the analysis of glyphosate and aminomethyl
429
phosphonic acid in water. J. Chromatogr. A 1175, 197–206.
430
doi:10.1016/j.chroma.2007.10.092
431
Kaserzon, S.L., Hawker, D.W., Booij, K., O’Brien, D.S., Kennedy, K., Vermeirssen, E.L.M.,
432
Mueller, J.F., 2014. Passive sampling of perfluorinated chemicals in water: in-situ
433
calibration. Environ. Pollut. 186, 98–103. doi:10.1016/j.envpol.2013.11.030
434
Kaserzon, S.L., Kennedy, K., Hawker, D.W., Thompson, J., Carter, S., Roach, A.C., Booij, K.,
435
Mueller, J.F., 2012. Development and calibration of a passive sampler for perfluorinated
436
alkyl carboxylates and sulfonates in water. Environ. Sci. Technol. 46, 4985–93.
437
doi:10.1021/es300593a
438
Kingston, J.K., Greenwood, R., Mills, G.A., Morrison, G.M., Björklund Persson, L., 2000.
439
Development of a novel passive sampling system for the time-averaged measurement of a
23
range of organic pollutants in aquatic environments. J. Environ. Monit. 2, 487–495.
441
doi:10.1039/b003532g
442
Li, H., Helm, P. a, Paterson, G., Metcalfe, C.D., 2011. The effects of dissolved organic matter
443
and pH on sampling rates for polar organic chemical integrative samplers (POCIS).
444
Chemosphere 83, 271–80. doi:10.1016/j.chemosphere.2010.12.071
445
Magbanua, F.S., Townsend, C.R., Hageman, K.J., Lange, K., Lear, G., Lewis, G.D., Matthaei,
446
C.D., 2013. Understanding the combined influence of fine sediment and glyphosate
447
herbicide on stream periphyton communities. Water Res. 47, 5110–20.
448
doi:10.1016/j.watres.2013.05.046
449
Mercurio, P., Flores, F., Mueller, J.F., Carter, S., Negri, A.P., 2014. Glyphosate persistence in
450
seawater. Mar. Pollut. Bull. 1, 1–6. doi:10.1016/j.marpolbul.2014.01.021
451
Portier, C.J., Armstrong, B.K., Baguley, B.C., Baur, X., Belyaev, I., Bellé, R., Belpoggi, F.,
452
Biggeri, A., Bosland, M.C., Bruzzi, P., Budnik, L.T., Bugge, M.D., Burns, K., Calaf, G.M.,
453
Carpenter, D.O., Carpenter, H.M., López-Carrillo, L., Clapp, R., Cocco, P., Consonni, D.,
454
Comba, P., Craft, E., Dalvie, M.A., Davis, D., Demers, P.A., De Roos, A.J., DeWitt, J.,
455
Forastiere, F., Freedman, J.H., Fritschi, L., Gaus, C., Gohlke, J.M., Goldberg, M., Greiser,
456
E., Hansen, J., Hardell, L., Hauptmann, M., Huang, W., Huff, J., James, M.O., Jameson,
457
C.W., Kortenkamp, A., Kopp-Schneider, A., Kromhout, H., Larramendy, M.L., Landrigan,
458
P.J., Lash, L.H., Leszczynski, D., Lynch, C.F., Magnani, C., Mandrioli, D., Martin, F.L.,
459
Merler, E., Michelozzi, P., Miligi, L., Miller, A.B., Mirabelli, D., Mirer, F.E., Naidoo, S.,
460
Perry, M.J., Petronio, M.G., Pirastu, R., Portier, R.J., Ramos, K.S., Robertson, L.W.,
461
Rodriguez, T., Röösli, M., Ross, M.K., Roy, D., Rusyn, I., Saldiva, P., Sass, J., Savolainen,
462
K., Scheepers, P.T.J., Sergi, C., Silbergeld, E.K., Smith, M.T., Stewart, B.W., Sutton, P.,
463
Tateo, F., Terracini, B., Thielmann, H.W., Thomas, D.B., Vainio, H., Vena, J.E., Vineis, P.,
464
Weiderpass, E., Weisenburger, D.D., Woodruff, T.J., Yorifuji, T., Yu, I.J., Zambon, P.,
465
Zeeb, H., Zhou, S.-F., 2016. Differences in the carcinogenic evaluation of glyphosate
466
between the international agency for research on cancer (IARC) and the european food
467
safety authority (EFSA). J. Epidemiol. Community Health 70.
doi:10.1136/jech-2015-468
207005
469
Shushkova, T., Ermakova, I., Leontievsky, A., 2010. Glyphosate bioavailability in soil.
470
Biodegradation 21. doi:10.1007/s10532-009-9310-y
471
Stewart, M., Olsen, G., Hickey, C.W., Ferreira, B., Jelić, A., Petrović, M., Barcelo, D., 2014. A
472
survey of emerging contaminants in the estuarine receiving environment around Auckland,
473
New Zealand. Sci. Total Environ. 468–469, 202–10. doi:10.1016/j.scitotenv.2013.08.039
474
Vermeirssen, E.L.M., Dietschweiler, C., Escher, B.I., van der Voet, J., Hollender, J., 2012.
475
Transfer kinetics of polar organic compounds over polyethersulfone membranes in the
24
passive samplers POCIS and Chemcatcher. Environ. Sci. Technol. 46, 6759–66.
477
doi:10.1021/es3007854
478
Warnken, K., Zhang, H., Davison, W., 2006. Accuracy of the diffusive gradients in thin-films
479
technique: Diffusive boundary layer and effective sampling area considerations. Anal.
480
Chem. 78, 3780–3787. doi:10.1021/ac060139d
481
Zhou, C.-F., Wang, Y.-J., Li, C.-C., Sun, R.-J., Yu, Y.-C., Zhou, D.-M., 2013. Subacute toxicity
482
of copper and glyphosate and their interaction to earthworm (Eisenia fetida). Environ.
483 Pollut. 180, 71–7. doi:10.1016/j.envpol.2013.05.016 484 485 SUPPLEMENTARY MATERIAL 486
Supplementary material Table 1. Physico-chemical parameters measured at Wappa Dam with a
487
YSI 650 MDS multiparameter probe. Dissolved metal concentrations refer to water filtered
488
through 0.45 µm regenerated cellulose filters measured by inductively coupled plasma-mass
489 spectrometer. 490 0.2 m depth RSD (%) 1.5 m depth RSD (%) Average temperature (°C) 23 4 22 3 Conductivity (µs cm-1) 226 6 229 5 pH 7 1 7 2 Turbidity (NTU) 3 32 4 22 Dissolved Oxygen (%) 63 28 24 45 Dissolved Oxygen (mg L-1) 6 20 2 46 Ca total (mg L-1) 7.8 49 - - Ca dissolved (mg L-1) 7.3 49 - - Mg total (mg L-1) 7.8 49 - - Mg dissolved (mg L-1) 7.6 50 - - Al total (mg L-1) 0.13 128 - - Al dissolved (mg L-1) 0.015 55 - -
25 Cd total (mg L-1) 0 - - - Cd dissolved (mg L-1) 0 - - - Co total (mg L-1) 0 - - - Co dissolved (mg L-1) 0 - - - Cu total (mg L-1) 0.001 78 - - Cu dissolved (mg L-1) 0 - - - Fe total (mg L-1) 0.26 60 - - Fe dissolved (mg L-1) 0.06 52 - - Mn total (mg L-1) 0.061 81 - - Mn dissolved (mg L-1) 0.008 143 - - 491 492
Supplementary material Figure 1. Schematic view of the microporous polyethylene tube (MPT)
493
sampler developed for the sampling of glyphosate and its transformation product
494
aminomethylphosphonic acid. O.D. is outside diameter, I.D. is internal diameter.
495 0.5 cm 0.5 cm 7 cm 8 cm I.D. 0.8 cm O.D. 1.2 cm Top insert TiO2 + agarose Receiving phase Microporous polyethylene tube MPT BoDom insert
26
496
Supplementary material Figure 2. Laboratory calibration system for MPT passive samplers and
497
TiO2 + agarose receiving phases naked.
498 Plas%c Beaker Contaminated water Nylon bag (2 mm mesh) PTFE weight Rotary shaker TiO2 + agarose Receiving phase MPT passive sampler
27
499
Supplementary material Figure 3. Scheme of in situ deployment system.
500 501
Atmosphere/water interface
Water/sediment interface
Buoy
Anchor line
Weight
Inox cages containing samplers
28
502
Supplementary material Figure 4. PMG concentration in spot samples during the in situ
503 calibration of MPT samplers. 504 0 0.2 0.4 0.6 0.8 1 1.2 0 2 4 6 8 10 12 μ g L -1 Time (day)