HAL Id: hal-02913775
https://hal.archives-ouvertes.fr/hal-02913775
Submitted on 2 Dec 2020
HAL is a multi-disciplinary open access
archive for the deposit and dissemination of sci-entific research documents, whether they are pub-lished or not. The documents may come from teaching and research institutions in France or abroad, or from public or private research centers.
L’archive ouverte pluridisciplinaire HAL, est destinée au dépôt et à la diffusion de documents scientifiques de niveau recherche, publiés ou non, émanant des établissements d’enseignement et de recherche français ou étrangers, des laboratoires publics ou privés.
Development of a near infrared protein nanoprobe
targeting Thomsen-Friedenreich antigen for
intraoperative detection of submillimeter nodules in an
ovarian peritoneal carcinomatosis mouse model
Mathilde Coustets, Caroline Ladurantie, Elisabeth Bellard, Mélissa Prat,
Marie-Pierre Rols, Vincent Ecochard, Gwenaël Ferron, Sophie Chabot, Muriel
Golzio, Laurent Paquereau
To cite this version:
Mathilde Coustets, Caroline Ladurantie, Elisabeth Bellard, Mélissa Prat, Marie-Pierre Rols, et al.. Development of a near infrared protein nanoprobe targeting Thomsen-Friedenreich antigen for intra-operative detection of submillimeter nodules in an ovarian peritoneal carcinomatosis mouse model. Biomaterials, Elsevier, 2020, 241, pp.119908. �10.1016/j.biomaterials.2020.119908�. �hal-02913775�
1
Development of a protein nanoprobe for intraoperative detection of
submillimeter nodules in an ovarian peritoneal carcinomatosis mouse model
Mathilde COUSTETS1,2, Caroline LADURANTIE1, Elisabeth BELLARD1, Mélissa PRAT3, Marie-Pierre ROLS1, Vincent ECOCHARD1, Gwenaël FERRON4,5, Sophie CHABOT2, Muriel GOLZIO1, Laurent PAQUEREAU1*
1
Institut de Pharmacologie et de Biologie Structurale, IPBS, Université de Toulouse, CNRS, UPS, 205 Route de Narbonne, BP64182, 31077 Toulouse, France.
2
Urosphere, Parc technologique du canal, Canal Biotech II, 3 rue des Satellites, 31400 Toulouse, France.
3 UMR 152 Pharma Dev, Université de Toulouse, IRD, UPS, France 4
INSERM U1037, Cancer Research Center in Toulouse (CRCT) 19, 31037, Toulouse, France.
5 Institut Universitaire du Cancer de Toulouse - Oncopole, Toulouse, France ; Department of Surgical Oncology
Institut Universitaire du Cancer de Toulouse - Oncopole, Toulouse, France.
Contact Information
Correspondence to: Laurent Paquereau, Email: Laurent.Paquereau@ipbs.fr
Keywords
Protein Nanoprobe, Cancer Imaging, Ovarian Peritoneal Carcinomatosis, Thomsen-Friedenreich Antigen, Near Infrared Fluorescence
Abstract
The epithelial ovarian cancer is one of the most lethal gynecological malignancy due to its late diagnostic and many relapses observed after first line of treatment. Once diagnose, the most important prognostic factor is the completeness of cytoreductive surgery. To achieve this goal, surgeons have to pinpoint and remove nodules, especially the smallest nodules. Recent advances in fluorescence-guided surgery led us to develop a recombinant lectin as a nanoprobe for the microscopic detection of nodules in the peritoneal cavity of tumor-bearing mice. This lectin has an intrinsic specificity for a carcinoma-associated glycan biomarker, the Thomsen-Friedenreich antigen. In this study, after its labelling by a near infrared dye, we first demonstrated that this nanoprobe
2
allowed indirect detection of nodules already implanted in the peritoneal cavity, through tumor microenvironment targeting. Secondly, in a protocol mimicking the scattering of cells during surgery, we obtained a direct and long-lasting detection of tumor cells in vivo. This lectin as already been described as a nanocontainer able to do targeted delivery of a therapeutic compound to carcinoma cells. Future developments will focus on the combination of the nanoprobe and nanocontainer aspects in an intraperitoneal nanotheranostic approach.
Introduction
Carcinoma is a generic term including all cancers originating from the epithelial tissue. Those solid tumors represent the most common form of cancer and a major cause of lethality [1]. Among them, the epithelial ovarian cancer (EOC) has a relatively low incidence compare to other cancers in women, but it is one of the most lethal gynecological malignancy [2] due to the lack of symptoms and reliable diagnosis methods at early stages of the disease. Indeed, over 75% of cases are diagnosed at advanced stages [3, 4]. Those advanced stages, IIb to IV in FIGO (International Federation of Gynecology and Obstetrics) classification, lead to the spread of cancer cells, emerging from the primary tumor site, throughout the peritoneal cavity resulting in peritoneal carcinomatosis (PC) mainly responsible for poor prognosis [5]. This metastasis process is atypical because clusters of cells are driven to their implantation sites by peritoneal flow [6]. Despite improvements during the last decade in five-year overall survival, from 30% to 55%, thanks to the concentration of cases in expert centers and the development of new strategies including maintenance treatment with antiangiogenics [7] and PARP inhibitors [8], the majority of patients recurred inside the peritoneal cavity [9]. In initial management, the standard of care for patient diagnosed with ovarian PC is a cytoreductive surgery (CRS) as complete as possible followed by intraperitoneal and/or systemic chemotherapy [10, 11]. Here lies a major challenge, since it is indispensable to remove every residual cancerous cells from the peritoneal cavity to prevent tumor recovery. Peritoneal metastasis implants are variable in size, ranging from microscopic nodules to several centimeters tumor masses [12, 13]. Residual microscopic nodules, undetectable to the naked eye (<1mm²), are often the cause of relapses after cytoreductive surgery and remain despite chemotherapy [14-16] which compromises long term patient survival. Intraoperative imaging techniques, in particular fluorescence-guided surgery (FGS), promise to improve significantly the detection and resection of tumors especially from the peritoneal cavity [13, 17-20]. Indeed, the quality of the CRS is a major factor to reduce recurrence of the disease. To date few intraoperative imaging techniques are available in clinic and most of them lack of specificity. One of the few Food and Drug Administration (FDA) approved near infrared (NIR) agent is the Indocyanine green (ICG) [21]. Even though ICG is well tolerated and has a rapid
3
hepatic clearance, this probe remains passive thus nonspecific of cancer tissue. After intravenous injection, it accumulates in the vessels irrigating tumors because of its affinity for plasma proteins and in the tumor masses due to the enhanced permeability and retention effect (EPR). Thus, nowadays, surgeons are using high-resolution fluorescence cameras to detect it and do intraoperative evaluation of cancerous tissue perfusion [13, 21]. Although ICG presents some advantages, its lack of specificity results in a high rate of false positives (62%) [22]. The oral or intraperitoneal administration of 5-aminolevulinic acid (ALA), a nontoxic photosensitizer naturally formed in mitochondria, and the subsequent accumulation of endogenous protoporphyrin IX (precursor of heme) in tumor cells, has also been tested in diagnosis for biopsies assistance in second-look laparoscopy [23] and CRS assistance [24]. The detection of peritoneal nodules was improved by 30% in comparison to white light for non-microscopic implants, and precaution has to be taken after 5-ALA administration regarding patient photo sensibility [23-26]. The first tumor-specific imaging agent used in clinic targets folate receptor (FRα), overexpressed in 90% of ovarian cancer [27]. A folate analogue (OTL38) conjugated to a NIR fluorescent dye enabled a 29% improvement in malignant nodules detection compared to conventional methods (palpation) on a small cohort of patients [28]. However, no threshold of nodules’ size and no effect on overall survival has been established. Despite those existing imaging agents, there is still room for the development of specific probes for intraoperative assistance of CRS to enable higher specificity and intra-abdominal microscopic nodules detection.
In epithelial ovarian cancer, the mucin 16 glycoprotein (MUC16) and its circulating form, the cancer antigen 125 (CA125), are overexpressed. CA125 is the standard FDA approved biomarkers for EOC. This overexpressed protein marker is mainly used in treatment monitoring but not as a diagnostic marker. Indeed, elevated CA125 serum levels are also associated to other malignancies, to benign gynecological conditions, and to early pregnancy and menstruation [29, 30]. More generally in carcinoma tissue, cancer-associated mucins show reduced expression of complex O-glycans and increased expression of short oligosaccharides due to the altered expression of selective glycosyltransferases in the Golgi [31-34]. Among those abnormal O-glycosylations, the Thomsen-Friedenreich antigen (TF antigen or CD176), a disaccharide (-D-Gal(1-3)-D-GalNac), or its direct precursor Tn-antigen (GalNAc), are rarely seen in normal epithelia [35, 36] but are highly expressed by about 80-90% of human carcinomas [37-39]. The TF antigen is also detected on several hematopoietic cells including the myeloid and lymphoid lineages [40-43]. The increased expression of TF antigen, and therefore the decreased expression of complex O-glycans, perturb normal cellular functions, which will favor cancer progression [33]. Thus, TF antigen is considered as a glycan cancer biomarker that is recognized by antibodies and lectins [33, 35].
4
In this context, we previously reported the specific recognition of TF antigen by a recombinant lectin protein cloned from Xerocomus Chrysenteron mushroom (XCL) [44, 45]. Isothermal titration calorimetry experiments demonstrated a high affinity between XCL and the TF antigen with dissociation constants of 1.6 μM and 0.38 μM for Fetuin and Asialofetuin, respectively (protein carrying a TF antigen sialylated or not) [45]. Studies at cellular level showed that XCL was endocytosed by a clathrin-dependent pathway and delivered to late endosome/lysosome compartments [46]. The 3D structure of the XCL protein was resolved by X-ray crystallography and revealed that its homo-tetrameric assembly displayed a complex network of protomer–protomer interfaces and generated a large, hydrated inner cavity of 1 nm3 [47]. We have recently described the biochemical development and use of this lectin as a nanocontainer enables to specifically deliver in
vitro a chemotherapeutic agent [48]. To achieve this objective, it was necessary to control the
stability and the dynamic of XCL’s quaternary structure by designing XCL variants in which monomers were covalently bonded to each other. The addition of disulfide bonds in a crosswise manner prevented the dissociation of oxidized A38C tetramers, a variant of the wild type XCL protein, and we showed that the position of these mutated residues did not interfere with the formation of the TF antigen binding site.
In the present study, we labeled the A38C variant in NIR and characterized its interaction with three human ovarian carcinoma cell lines in vitro, determining that those cells can be stained independently of their MUC16 expression. Indeed, TF antigen is carried by others mucins and membrane glycoproteins on cancer cells [31]. Then, in order to evaluate the efficiency of A38C-alexa647 as an in vivo imaging probe, we established a murine model of ovarian peritoneal carcinomatosis and performed two different detection procedures mimicking clinical situations. We demonstrated that the A38C probe was able to highlight microscopic nodules inside the peritoneal cavity by per-operative imaging with a high specificity and a good signal to noise ratio. The characterization of the interaction between our probe and the nodules in mice was addressed by histological and flow cytometry analysis. Altogether, our data demonstrated that the A38C probe could be a valuable tool for intraoperative nodules detection. This work opens the possibility of developing nano-theranostics approaches by combining the nanoprobe and nanocontainer aspects of A38C.
Materials and Methods
Recombinant Protein labeling
Recombinant protein was produced and purified as previously described [44] [48]. After purification, the recombinant A38C protein was labeled with a near infrared emitting dye (Alexa Fluor 647), with
5
an NHS ester covalent bound to -amine lysine residues, using CF®647 SE Protein labeling kit (cat n°#92218, Biotium, USA). A38C (30µM) were incubated overnight at room temperature in the dark in a medium composed of 100mM sodium bicarbonate (pH 8.3) and CFTM647 dye. After elimination of unconjugated free dye by gel filtration (Biogel P-30, Bio-rad, USA), the labeled protein was recovered and the yield of labeling was determined by spectrophotometry. The protein-bound dye ratio was calculated using the following extinction coefficient for CFTM647: 650nm = 240.000 M-1 cm-1. Protein concentrations after labeling were calculated using 280 nm = 119.640 M-1 cm-1 with a previous correction from the absorption of the probes at this wavelength. The typical labeling ratio was 1 mole of dye per mole of protein.
Cell lines, products and reagents
The human ovarian adenocarcinomas cell lines NIH: OVCAR-3 (ATCC® HTB-161™) and SKOV-3 (ATCC® HTB-77™) were purchased from American Type Culture Collection and IGROV-1 were obtained from the Gustave Roussy Institute [49]. Cells were routinely cultured in RPMI 1640 medium (CM1RPM00K, Eurobio, France) supplemented with 2mM L-Glutamine (CSTGLU00, Eurobio, France), 1% penicillin/streptomycin (P0781, Sigma, USA), 10% fetal calf serum (FCS) (F7524, Sigma, USA), 10μg/mL human Insulin (I9278, Sigma, USA) and 20ng/mL human recombinant epidermal growth factor (E9644, Sigma, USA). Cells were cultured as monolayers at 37°C in a humidified 5% CO2 atmosphere, and were tested every other week for mycoplasma (MycoAlert Mycoplasma Detection kit, cat n°#LT07-318, Lonza, Switzerland).
For in vivo experiments, the lentiviral vectors used for stable gene expression of Firefly luciferase (Luc) and Green Fluorescent Protein (GFP) were supplied by Flash Therapeutics (Toulouse, France). The GFP expression level was assessed by flow cytometry after double transfection and cells were 99% GFP positive compared to IGROV-1 wild type.
Immunofluorescence staining and confocal imaging of tumor cell lines
For the detection of MUC16 expression and A38C-alexa647 staining, 1.105 OVCAR-3, 7,5.104 SKOV-3 and 7,5.104 IGROV-1 cells were cultivated, into chamber slides device (PEZGS0496, Millipore, USA). Once cells were plated, they were fixed with 4% paraformaldehyde (PFA) (102091-904, VWR, USA) for 20 minutes, PFA was neutralized with PBS (phosphate buffered saline, CS1PBS01K, Eurobio, France) NH4Cl 50mM for 2 minutes and a blocking with PBS 10% FCS, 2% BSA (Bovine Serum Albumin) was performed for 30 minutes at room temperature. Cells were labeled with CA-125/MUC16 (Ov185:1) mouse monoclonal antibody (MA5-11579, Thermo Fisher Scientific, USA) at 1:250 dilution in PBS, 2% FCS and incubated for 3 hours at room temperature. After 3 washes with
6
PBS, cells were labeled simultaneously with Goat anti-Mouse IgG (H+L) alexa488 (A11017, Thermo Fisher Scientific, USA) at 1:200 dilution and A38C-alexa647 at 160nM, in PBS, 2% FBS and incubated 30 minutes at room temperature. After 3 washes with PBS, nuclei were stained with Vectashield® antifade mounting medium containing DAPI (H-1200, Clinisciences, USA) and slides were kept at -20°C prior confocal imaging. Fluorescence images were acquired using an Olympus FV-1000 confocal microscope with a UPLSAPO40X2 objective.
Cellular uptake kinetic by fluorescence microscopy imaging
For the uptake kinetic experiments, 1.105 OVCAR-3, 5.104 SKOV-3 and 5.104 IGROV-1 cells were seeded on 4 wells cover glass Lab Tek devices (155383, Thermo Fisher Scientific, USA). Once all cells were plated, the labeled A38C protein was added at 160nM per well, while keeping a well without protein for negative control. Fluorescence imaging acquisitions were made at indicated times after cells/protein incubation. PBS washes (x2) were performed to remove unbound A38C-alexa647. Cells were imaged on an inverted digitized videomicroscope (DMIRB, Leica Microsystems SA, Rueil-Malmaison, France) equipped with a Cool Snap HQ2 Camera (Roper Scientific, Photometrics, Tucson, AZ, USA) and a 63x 0.7 NA objective. Cells were imaged by fluorescence using appropriate filters: Leica L4 block filter (excitation filter, BP: 480/40 nm, emission filter, BP: 527/30 nm) was used to see the cells expressing constitutively GFP, and Leica Cy5 TET filtercube (excitation filter, BP 620/60 nm, emission filter, BP 700/75 nm) was used to view the labeled protein (exposure time = 1s).
Cellular uptake quantification and dose response assessments by flow cytometry
For quantification experiment, 1.105 OVCAR-3, 5.104 SKOV-3 and 5.104 IGROV-1 cells were seeded on 12 wells plate. Once all cells were plated, the labeled A38C protein was added at 160nM per well, while keeping a well without protein for negative control. After 24 hours’ incubation with A38C-alexa647, cells were washed twice with PBS, harvested with trypsin and fluorescence intensity was analyzed by flow cytometry. Fluorescence of alexa647 was measured with a BD FACSCalibur™ cell analyzer (104 events counted) and results were analyzed with Cell Quest Pro software (BD Biosciences) to determine fluorescence intensities. For dose-response assessments, 7.5.104 OVCAR-3, 5.104 SKOV-3 and 5.104 IGROV-1 cells were seeded on 12 wells plate. Once all cells were plated, the labeled A38C-alexa647 protein was added at various concentrations (16, 32, 63, 126, 160, 253, 320 and 510nM). Cells were incubated 6h at 37°C with A38C-alexa647, harvested and fluorescence intensity was measured by flow cytometry as described above.
7
Mice xenografts, labeled protein administration and tumor growth monitoring
Female nude mice (BALB/c nu/nu from Janvier Labs, France) 8 weeks of age and weighing between 18–23 g were used in this study. All animal experiments were conducted in accordance with ARRIVE guidelines, European Union Directive 2010/63/EU and French procedural guidelines for animal handling, with approval from the ethical committee (C2EA-01) of the Ministère de l'Enseignement Supérieur, de la Recherche et de l'Innovation (MESRI) (agreement number #2017080816182218). In the sequential procedure, nude mice were intraperitoneally injected with 2.106 IGROV-1 Luc/GFP cells (cellular suspension in PBS) at day 0 (D0). Three weeks later the labeled protein was administrated intraperitoneally (0.8µM) one day before euthanasia. In the coinjection procedure, IGROV-1 Luc/GFP cells (2.106 cells in PBS) were intraperitoneally injected into nude mice simultaneously with the labeled protein (0.8µM) at day 0 (D0). In either case, one week after cells injection, noninvasive bioluminescence imaging was performed to ensure that animals developed peritoneal carcinomatosis. D-luciferin sodium salt (150mg/kg, cat n°#LN10000, OZ Biosciences, France) were intraperitoneally injected 5 minutes before imaging. Bioluminescence was carried out on a customized device equipped with a black Box (Photek, UK), a Schneider objective VIS-NIR Cinegon 1.4/12-0515 and a heating pad (37°C) (Harvard Apparatus, USA). Animals were anaesthetized using isoflurane inhalation anesthesia (Vetflurane, Virbac, France) throughout the experiment. Mice were imaged with a Camera Ikon M and data stored with Solis acquisition software (ANDOR Technology). Six acquisitions of 5 minutes (exposition time) at binning 2 were made. The same day, noninvasive fluorescence imaging was performed to detect the labeled nanoprobe using a Fluobeam ®700 (Fluoptics, Grenoble, France) device which is a highly sensitive CCD camera able of real-time imaging in the near infrared window. In both procedures, mice were euthanized 3 weeks after tumor cells injection.
Ex vivo tumor tissues fluorescence macroscopy imaging
After euthanasia, autopsies were performed under fluorescence monitoring. Macroscopy was carried out on an upright “Macrofluo” fluorescence macroscope (Leica Microsystems SA, Rueil-Malmaison, France), equipped with a Cool Snap HQ2 Camera (Roper Scientific, Photometrics, Tucson, AZ, USA) and a PlanApo 0.5x, WD 187mm objective. Images were stored with image acquisition software (Metavue, Metamorph, Molecular devices, Sunnyvale, CA, USA). To identify tumor tissues, GFP constitutive expression of implanted human cells was detected using appropriate filter: L5 (excitation filter, BP: 480/40 nm; emission filter, BP: 527/30 nm). Tissues were also imaged using Cy5 filter (excitation filter, BP: 620/60 nm, emission filter, BP: 700/75 nm) in order to see the bio distribution of A38C-alexa-647 administrated into xenografts mice.
8
Nodules’ surfaces assessment
Fluorescence images (GFP) of each carcinomatosis sites were processed using Fiji software. The images were first scaled according to calibration of the fluorescence macroscope camera and objective (mm/pixel, depending on the magnification used during acquisition). Then a threshold was applied to the images and the analyze particles function of the software was used to get the number of nodules and their area in mm².
Signal to noise ratio (SNR) calculations
Non-xenograft mice received the same amount of A38C-alexa647 (0.8µM) as the tumor-bearing mice by intraperitoneal injections, one day or 21 days before euthanasia for control mouse of sequential and coinjection protocol, respectively. To evaluate signal to noise ratio on the fluorescence images, control mice were used to determine a threshold value (Ft) corresponding to the maximum fluorescence background signal for each peritoneal carcinomatosis sites. Those threshold values were used to analyze fluorescence images of tumor-bearing mice. A mean fluorescence intensity was obtained above (F+) and below (F-) the fixed threshold (Ft), the one above was considered as specific signal and the one below as background. The signal to noise ratio (SNR) was calculated according to the equation:
where
F+ is the mean fluorescence intensity above Ft F- is the mean fluorescence intensity below Ft
This evaluation was realized on three mice compared to non-tumor bearing mice of each protocol, and all images were taken at the same magnification.
Treatment and confocal microscopy imaging of tissue samples
Once removed and imaged, tumor tissues were incubated overnight in a fixative buffer (phosphate buffer 50mMpH7.4, lysine 0.1M, sodium periodate 2mg/mL, PFA 1%,). To insure removal of water from tissue samples before cryopreservation, each sample was incubated at 4°C in 3 consecutives sucrose baths (starting at 10%, 20% and 30% sucrose in 0.1M phosphate buffer).Then tumor tissues were snap-frozen, embedded in optimal cutting temperature (O.C.T.) gel medium (Cell Path, UK) and stored at - 80°C. Twenty µm frozen sections were cut with a Cryostat device (Cryostat CM1950, Leica, Germany), and mounted on slides. After PBS bath to wash off remaining O.C.T, a NeoMount fluorescence mounting medium containing DAPI (NB-23-00159-2, Clinisciences, USA)was dispensed onto the specimen. Coverslips were permanently sealed around the perimeter with nail polish. Mounted
9
slides was stored at -20°C and protected from light before imaging. Fluorescence confocal images were acquired using an Olympus FV-1000 confocal microscope with a UPLSAPO10X2, a UPLSAPO20X or a UPLSAPO40X2 objectives.
Hematoxylin and Eosin (H&E) staining and imaging
Frozen sections (thickness = 10µm) were stained with Hematoxylin and Eosin according to standard protocols. Digital images of H&E staining were captured with a Zeiss Axioimager M2 (Carl Zeiss S.A.S., Jena, Germany) and a 20x objective (NA 0.8). The microscope was equipped with an Axiocam 503 color camera (14 bits) for color imaging and with an ORCA-Flash4 LT digital sCMOS camera (Hamamatsu, 4.2 Megapx) for bright field and fluorescence imaging with appropriates filters for alexa647 (excitation BP 640/30 and emission BP 690/50).
Multiphoton microscopy
Second harmonic generation (SHG) was used to visualize the collagen capsule surrounding the peritoneal nodules on nodule’s frozen section (thickness = 80µm) using multiphoton microscopy. The acquisitions were made in sequential mode on a 7MP upright fluorescence microscope (Carl Zeiss S.A.S., Jena, Germany), equipped with a 20x objective (NA 0.95) and coupled to a Ti-Sapphire femtosecond laser, Chameleon Ultra 2 (Coherent Inc). The laser was tuned at 800nm to detect the alexa647 (BP 640/710) and SHG (BP 390/410) signals, and at 920nm to detect GFP (BP 500/550) signals.
Immunohistofluorescence staining of tumor tissues
Twenty µm frozen sections were dry in ambient air during 1h and remaining O.C.T washed off by a PBS bath during 30 min. Tissue sections underwent permeabilization in a PBS 0.1% Triton-X-100 bath for 10 minutes. Two 10 min washes in PBS were performed before surrounding each sections with a PAP pen for immunostaining (Z6725481EA, Sigma, USA). A blocking was performed during 30 min with Maxblock (15252, Active motif, USA). Tissue sections were stained, overnight at 4°C and protected from light, with a CD45 monoclonal antibody (30-F11 clone) efluor405 (48-0451-80, Thermo Fisher Scientific, USA) or its rat IgG2b Kappa isotype control (eB149/10H5) efluor405 (48-4031-82, Thermo Fisher Scientific, USA) diluted at 1/200° in PBS 20% Maxblock. After 10 min washes in PBS thrice, a NeoMount fluorescence mounting medium without DAPI (NB-23-00158-2, Clinisciences, USA) was dispensed onto the specimen. Coverslips were permanently sealed around the perimeter with nail polish. Mounted slides were stored at -20°C and protected from light before imaging. Fluorescence confocal images were acquired using an Olympus FV-1000 confocal microscope with a
10
UPLSAPO20X or a UPLSAPO40X2 objectives and processed to filter the noise (PureDenoise plugin) with Fiji software. This filter was similarly applied to all images within an experimental group.
Tumor dissociation and flow cytometry
Nodules were resected from mice which underwent the sequential procedure (n=10), and mechanically dissociated using the plunger of a syringe on a cell strainer membrane to break the collagen capsule. Then an enzymatic dissociation was realized in HBSS + Ca2+/Mg2+ (14025092, Thermo Fisher Scientific, USA) supplemented with 100µg/mL DNase I (11284932001, Sigma, USA) and 50µg/mL LiberaseTM TL (5401020001, Sigma, USA) for 30 minutes at 37°C on a rotating mixer. Afterwards nodules suspensions were filtered through 70µm cell strainers, spun down for 5 minutes, 500g at room temperature and red blood cells were lysed in ACK lysis buffer (A1049201, Thermo Fisher Scientific, USA) for 5 minutes. Samples were resuspended in PBS 2% FCS 2mM EDTA and maintained on ice until staining with antibody panels. All analyses were gated on viable cells after a Live/Dead Staining (Molecular Probes® LIVE/DEAD Fixable Violet Dead Cell Stain Kit, Life technologiesTM, USA).Antibodies used for each panel are listed below:
Macrophage panel:
CD45-Viogreen (clone 30F11, Miltenyi, USA), F4/80-PE (clone REA126, Miltenyi, USA), CD206 BV605 (clone C068C2, Biolegend, USA), MHC class II-PerCP-Vio700 (clone M5/114.15.2, Miltenyi, USA) and CD279 (PD1)-PeCy7 (clone 29F.1A12, Biolegend, USA).
MDSCs (myeloid-derived suppressor cells) panel:
Gr1-PE (clone REA810, Miltenyi, USA), F4/80-PerCP-Vio700 (clone REA126, Miltenyi, USA), CD11b-BV605 (clone M1/70, Biolegend, USA).
For every channels, fluorescence minus one controls (FMOs) were used to gate positive cells (see gating strategy in supplementary data). Macrophage population was analyzed by surface expressed MHCII and F4/80 detection and MDSCs by Gr1 and CD11b detection. All staining were performed on 100 µL of PBS (without Ca2+ & Mg2+) 1% heat-inactivated fetal calf serum. A population of at least 30.000 live cells was analyzed for each data point. All analyses were done in a BD Fortessa flow cytometer with Diva software for acquisition and FlowJo software for analysis.
Statistical analysis
Data analysis was performed using GraphPad Prism 6.0 program (GraphPad Software, Inc., La Jolla, CA, USA) and data were expressed as means ± SD for the number of experiments indicated in the legends of the figures. Multiple comparisons were performed using one-way analysis of variance (ANOVA) followed by Bonferroni multiple comparison post-test.
11
Molecular illustration was made with PyMOL software [50].
Results
1. Description and labeling of the nanoprobe
The A38C variant of the XCL protein was designed by directed evolution as previously described (Figure 1A) [48]. In order to first study its interaction with cell lines in vitro and later evaluate its efficiency as a nanoprobe in vivo, A38C was labeled with a NIR dye to be followed by micro and macroscopic fluorescence imaging. The protein was labeled with Alexa Fluor 647 by a NHS ester linkage with -amine of lysines. Three -amine were exposed on the surface of each protomer and therefore 12 lysines could be potentially labeled. Only one lysine (K75) by protomer, the closest to the sugar site, would have been able to interfere with this recognition site, but the lateral chain of K75 had an orientation that took it away from the sugar-binding site (Figure 1B). Once labeled at a recurring output of one mole of dye per mole of protein, no obstruction of binding on TF antigen allowing the endocytosis was observed (Figure S1A). Interestingly, the formation of disulfide bridges on this variant, induced by the A38C mutation, prevented any redistribution of protomers and thus that of the labeling (Figure S1B). This structural constraint made it possible to maintain the labeled protein in the same state over time, i.e. the absence of exchange between protomers prevented a fraction of A38C from being labeled with 4 fluorophores and the remaining fraction without labeling. In order to perform in vivo detection in small animals, and later on in humans, the probe must be stable over time and easy to use. Biochemical data showed very high temperature stability with Tm in the range of 70°C [48]. We have completed this characterization by evaluating the stability of the protein and its labeling over time. Samples from different production batches, either of the wild type protein XCL or the variant A38C, were stored at room temperature and at different pH levels over a 6 months’ period (Figure 1C). These data showed an extreme stability of the A38C variant at pH7 over time with an initial concentration of 0.5mg/mL. The XCL wild type protein, was also very stable but after reaching a steady state at lower concentrations (0.35mg/mL). For acidic pH (5.5 and 4.5) conditions, the A38C mutant showed once more an excellent stability, since no protein loss was observed over this monitoring period. It is interesting to note that acidic pH values are found in tumor microenvironments and will have no impact on the stability of the probe. Finally, we checked the stability of the binding to the chromophore over a one-month period. After labeling reaction, the free Alexa-647 was separated from the bound by exclusion chromatography. After one month, a new
12
exclusion gel column was performed to remove unbound Alexa-647, which may have been detached from the protein. Our results indicated that there was no loss of labeling over this period, regardless of the initial labeling yield, ranging from 0.8 to 1.2 mole of dye per mole of protein (Figure S1C). This A38C-alexa647 nanoprobe was used in all experiments.
2. Characterization of A38C-alexa647 interaction with human ovarian adenocarcinoma cell lines
Before evaluating the efficiency of A38C-alexa647 as an imaging agent on xenograft mice, we first assessed it on different ovarian cancer cell lines presenting various characteristics depending on their origin. We selected three cell lines to characterize in vitro their interaction with the nanoprobe: OVCAR-3, SKOV-3 and IGROV-1. The OVCAR-3 cells were established from the malignant ascites of a
Figure 1: A38C (XCL variant): Structure, NIR labelling and stability. (A) Structure representation (ribbon diagram) showing the overall organization of the homo-tetrameric
A38C variant with the protomers noted A to D, position of mutated residues A38C and the resulting disulfide bridges (red). Due to the symmetry of the protein, this mutation introduces two disulfide bridges [48]. Figure was prepared with Pymol software. (B) Localization of the
TF antigen binding site (orange) and lysine residues (magenta backbone) on one protomer. (C) Monitoring of stability over a 6 months’ period at different pH for the XCL protein and its variant A38C. Spectrophotometry at 280nm. The dashed line represents the initial concentration of both XCL and A38C; Mean ±SEM; n= 3 production batches (pH 7) n=2 production batches (pH 5,5 and 4,5).
13
patient with a high grade serous EOC who received a combination of chemotherapy and became chemo resistant [51]. SKOV-3 were retrieved from a patient with a serous type EOC who also underwent chemotherapy with an alkylating drug [52, 53]. IGROV-1 cells have been considered as naïve because the patient from whom they were sampled did not receive any chemotherapy, and they have been described as a mix of several histological types of EOC [49, 54]. Regarding EOC, the MUC16 glycoprotein and its circulating form (CA125) are the standard FDA approved biomarkers. OVCAR-3 cells have been described expressing MUC16 [55] whereas it has not been found on SKOV-3 cell line [56] and there was no available information about MUC16 expression on IGROV-1 cell line. Thus, we first performed immunofluorescence staining to determine whether MUC16 was expressed by IGROV-1 cells using, OVCAR-3 and SKOV-3 as positive and negative controls respectively. The experiment was realized on fixed cells, after a first staining with a monoclonal antibody specific of MUC16. A38C-alexa647 was added at the same time as the secondary antibody revealing the anti-MUC16 (labeled with alexa488). Among the three cell lines tested only OVCAR-3 showed staining with anti-MUC16 monoclonal antibody (Figure 2, MUC16 panel). In contrast, A38C-alexa647 fluorescence staining revealed the expression of TF antigen on all three cell lines (Figure 2, A38C-alexa647 panel). The double staining with both MUC16 monoclonal antibody and A38C-A38C-alexa647 (Figure 2, Merge panel) pointed out co-localization regions on OVCAR-3 cell membranes and also simple stained regions with A38C-alexa647. The A38C-alexa647 nanoprobe labeled all three cell lines independently of MUC16. Those results confirmed that TF antigen was carried by the MUC16 and highlighted its expression on other mucins or mucin-like protein. Overall, we showed that the nanoprobe was able to stain a wider range of human adenocarcinoma cell lines, by detecting TF antigen, than the monoclonal antibody directed against MUC16.
14
3. Uptake kinetics and quantification of the nanoprobe interaction with cell lines in vitro
To go deeper in the in vitro characterization of the nanoprobe, we then looked at the interaction of A38C-alexa647 with living cells as a function of incubation time. After an incubation period of 30 minutes, OVCAR-3 cells membranes were entirely stained by A38C-alexa647, membrane staining has begun for SKOV-3 cells and there was no detectable signal on IGROV-1 (Figure 3A). After 4 h, the nanoprobe labeled all cell lines and OVCAR-3 cells presented a vesicular signal. At 24h, all three cell lines presented a vesicular and perinuclear signal as previously described [46]. Thus, for a fixed quantity of A38C-alexa647, these kinetic experiments suggested different levels of marker expression at the surface of the three cell lines.
We quantified the uptake of the nanoprobe by flow cytometry after a 24h incubation period for each cell line (Figure 3B). We obtained significant differences showing that OVCAR-3 was the one with the highest uptake rate thus expressing the most TF antigen followed by SKOV-3, expressing 60% less TF
Figure 2: TF antigen detection by A38C-alexa647 independently of MUC16 expression. Confocal 40x processed images of fixed cells incubated with MUC16 (Ov185:1) mouse monoclonal antibody for 3h at room temperature and labeled simultaneously with the secondary antibody (goat anti mouse alexa488) and A38C-alexa647 for 30 minutes. Nuclei were stained with DAPI in blue. MUC16 staining in green (left); A38C-alexa647 staining in red (middle); double staining in yellow (merge panel). Representative images of two independent experiments. Scale bars: 10µm.
15
antigen compared to OVCAR-3, and IGROV-1 that showed the lowest uptake rate. We concluded that the difference in uptake kinetics was due to a significant difference in marker expression level at the membrane of each cell line. Dose-response assessments of A38C-alexa647 have been performed on each three cell line to obtain apparent dissociation constants (KD) and Bmax values in order to better characterize the interaction between the nanoprobe and its glycan marker at the cell surface (Figure 3C). With this experiment, we obtained 3 important informations. First, the non-linear regression fit revealed a saturation of the A38C-alexa647 signal after a 6h incubation period demonstrating the specificity of the interaction between the nanoprobe and TF antigen. Then, the fit enabled us to obtain apparent KD and Bmax values for each cell lines. Those apparent KD were all in the range of 100nM showing that the nanoprobe at the membrane of every tested cells recognizes the same glycan marker. On top of that we determined that this apparent KD was four times lower on cells surface than the one previously obtained with ITC experiments in vitro [45]. We can assume that cluster of glycoproteins at the plasma membrane was a contributing factor to this quantifiable improvement. The differences in Bmax values between the cell lines was in the same range as the differences observed in the uptake experiments (Figure 3B) due to the variability in amount of TF antigen expressed by protein carrier at the plasma membrane of each cell line.
Taken together, those results revealed that the uptake and the kinetic were variable depending on the TF antigen expression rate of cell lines in the in vitro model. This observation let us to hypothesize that the use of the nanoprobe could be generalized to all adenocarcinoma cells from various origin, not only ovarian. A38C-alexa647 presented a similar affinity for all ovarian adenocarcinoma cells because it recognizes the same glycan on each of them and the saturation of the signal showed once again the specificity of the nanoprobe for its target, the TF antigen. All data considered, we chose to use the IGROV-1 cells for the development of the in vivo model. Indeed, IGROV-1 cells have been described for their imitating capability to develop a peritoneal carcinomatosis in vivo after intraperitoneal injection into mice [49]. Moreover, among the three cell lines, the IGROV-1 cells presented the lowest expression level of TF antigen at their membranes. Therefore, we decided to use this cell line for the in vivo imaging proof of concept.
16
4. Establishment of the mouse model and nodules’ size evaluation
The main clinic problematic regarding peritoneal carcinomatosis is the dissemination of secondary tumors within the peritoneal cavity. The cytoreductive surgery aim to eliminate all those secondary tumors that present various sizes depending on their state of growth. In order to remove all the cancerous tissues, surgeons must be able to detect even the smallest implantation sites given that what will be left is able to redevelop and spread in the cavity, so to give birth to new cancerous sites. To assess the efficiency of A38C-alexa647 as a nanoprobe for submillimeter detection, we had to establish a mouse model with various tumor size implanted at the same sites as ovarian PC development sites found in patients. We first transduced the IGROV-1 cells with two reporter genes,
Figure 3: Characterization of the kinetics of A38C-alexa647 cellular uptake in ovarian cell lines. (A) Visualization of A38C-alexa647 uptake kinetics: Cells were incubated with 160nM of A38C-alexa647 (labelling
ratio = 1.2) for the indicated times. Fluorescence images were acquired with a Cy5 TET filtercube. BF: Bright Field. Representative images of 5 independent experiments with equal dynamic range fluorescence intensity. (B)
Quantification of cellular uptake: Cells were incubated 24h with 160nM of A38C-alexa647 and fluorescence
intensity was measured by flow cytometry. Data are expressed as a rate regarding OVCAR-3 values. n=5 independent experiments. Statistical analysis: ****p<0.0001. (C) Bmax and apparent dissociation constants
(KD) evaluation: Cells were incubated 6h at 37°C with different concentrations (16, 32, 63, 126, 160, 253, 320
and 510nM) of A38C-alexa647 and fluorescence intensity was measured by flow cytometry. Apparent dissociation constants (KD) and Bmax values were determined by a nonlinear regression fit with a one site-specific binding model (Prism software). n=3 independent experiments.
17
green fluorescent protein (GFP) and luciferase (Luc). Their constitutive expression allowed an easy detection of engrafted cells by bioluminescence non-invasive imaging and, after euthanasia, by fluorescence macroscopy (Figure S2A-B). We chose an intraperitoneal injection of the cells to mimic the spreading within the peritoneal cavity, as described in [49, 57]. The duration of the experiment and the number of injected cells had to be determined to ensure that the implanted nodules were in the mm² range. We started with 10.106 injected cells that developed tumor masses in less than 2 weeks (Figure S3A-B). The tumor growth was quick but the resulting tumor masses were too big and did not implant on many sites in peritoneal cavity. To obtain a peritoneal carcinomatosis with mostly submillimeter nodules, which implanted on several sites as observed in clinical situations, we set our protocol on 2.106 injected cells and a 3 weeks monitoring period. One week after cells injection, we visualized mice by whole body non-invasive bioluminescence imaging to verify that the xenograft cells implanted. After euthanasia, peritoneal nodules have been detected with GFP constitutive expression of IGROV-1 cells using fluorescence macroscopy (Figure 4A). The peritoneal carcinomatosis development sites were defined as follow: digestive tract (stomach, pancreas, intestines), spleen and large omentum (peritoneum extension), liver and small omentum, diaphragm and retroperitoneum. We detected the implanted nodules with fluorescence macroscopy and evaluated their surface by image processing (Figure 4B). The resulting median nodule diameter on all development sites was in the submillimeter range (around 0.4mm). The detection of microscopic nodules on all organs of the peritoneal cavity allowed us to validate the cell implantation protocol.
18
5. In vivo detection procedures of microscopic nodules with A38C-alexa647
Figure 4: Peritoneal spread of microscopic nodules mouse model. (A) Macrofluorescence imaging of
peritoneal tumors developed on preferential peritoneal carcinomatosis sites 3 weeks after tumor cells implantation. Fluorescence images were acquired with an upright fluorescence macroscope using proper filters to detect GFP constitutive expression of implanted human cells. One representative image for each site among 6 mice. Scale bars= 5mm. (B) Nodules’ surface assessments: evaluation of nodule sizes at different preferential
peritoneal carcinomatosis sites by image processing of macrofluorescence acquisitions using the GFP constitutive expression of IGROV-1. The dashed line at 1mm² represents the human eye detection threshold.
19
Two different protocols (sequential and coinjection) have been used to evaluate the nodule detection efficiency of the nanoprobe in our mouse model. Both procedures lasted 3 weeks to
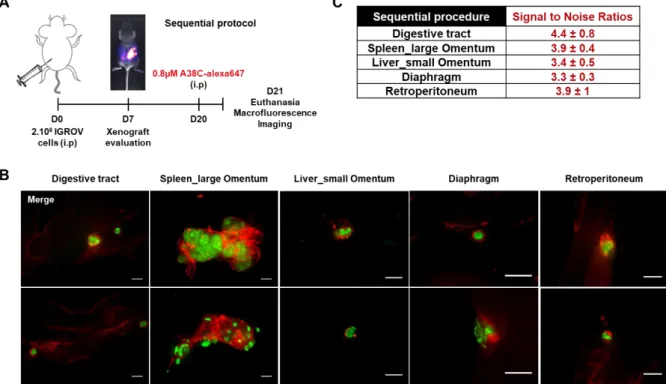
minimize the impact on animals and ensure that implanted nodules were in the submillimeter range. The first protocol, named sequential, consisted in an intraperitoneal injection of 2.106 cells to induce peritoneal carcinomatosis and then, 3 weeks later, an intraperitoneal injection of the nanoprobe (0.8µM) the day before euthanasia (Figure 5A). The goal was to mimic an injection of the nanoprobe before CRS to use it as intraoperative assistance. The specific nanoprobe fluorescent signal in the peritoneal cavity was easily distinguishable from the background signal allowing the detection of every implanted nodule (Figure 5B and S4). Indeed, when a non-tumor bearing mouse received an intraperitoneal injection of the same amount of nanoprobe one day before euthanasia as control, no specific labelling was observed (Figure S5A). The same regions on non-tumor and tumor bearing mice were imaged and used to calculate the signal to noise ratios (SNR) ranging from 3.3 to 4.4 depending on the site of observation (Figure 5C and S5B). This procedure highlighted that it was possible to detect all implanted nodules, independently of their sizes, all around the peritoneal cavity with a specific labeling of the nanoprobe surrounding them.
Figure 5: Peritoneal carcinomatosis microscopic nodule detection in the sequential procedure. (A) Schematic illustration of the sequential experimental procedure: mice were xenograft with 2.106 IGROV-1 cells by intraperitoneal injection and one day before euthanasia 0.8µM of A38C-alexa647 was administrated by intraperitoneal injection (i.p). Xenografts were evaluated by non-invasive luminescence imaging at day 7 and animals were euthanized at day 21. (B) Macrofluorescence imaging of peritoneal tumors developed on preferential peritoneal carcinomatosis sites. Fluorescence images were acquired with an upright fluorescence macroscope using proper filters to detect GFP constitutive expression of implanted human cells and the labeled protein A38C-alexa647. Tumor masses in green and A38C-alexa647 in red. Two representative mice are shown for each site (n=5). Scale bars= 1mm. (C) Signal to noise ratios (SNR) calculated by image processing in comparison with a control mouse not xenograft which was intraperitoneally injected with 0.8µM A38C-alexa647 one day before euthanasia (n=3).
20
21
22
23
24
25
of the nanoprobe did not interfere neither with the sites of tumor implantation nor the surfaces of the implanted nodules. The surface assessment in this coinjection procedure revealed that it was comparable to the one of control mice that did not receive the nanoprobe (Figure 6B and 4B). With
this procedure, every nodule was found labeled with the nanoprobe and a strong fluorescence signal persisted for at least 3 weeks. The nanoprobe detected those tumors at every preferential peritoneal carcinomatosis sites with a submillimeter resolution (Figure 6C and S6). It is noteworthy that no signal was detectable in non-tumor bearing mice that received an intraperitoneal injection of the same amount of nanoprobe and were euthanized 3 weeks later (Figure S7A). Signal to noise ratios were also calculated for this procedure by comparison between a non-tumor bearing mouse and mice that underwent coinjection procedure (Figure 6D and S7B). These SNRs were similar to those obtained with the sequential procedure ranging from 3.4 to 4.9 depending on the site of observation.
Figure 6: Peritoneal carcinomatosis microscopic nodule detection in the coinjection procedure. (A) Schematic illustration of the coinjection experimental procedure: 2.106 human ovarian adenocarcinoma cells (IGROV-1) were xenograft into nude mice by intraperitoneal (i.p) coinjection with 0.8 µM of A38C-alexa647. (B) Nodule surface assessment: evaluation of nodules’ sizes at different preferential peritoneal carcinomatosis sites by image processing of macrofluorescence acquisitions using the GFP constitutive expression of IGROV-1 and the calibration of the camera. The dashed line at 1mm² represents the human eye detection threshold. n=6. (C) Representative macrofluorescence images of peritoneal tumors developed on preferential peritoneal carcinomatosis sites. Fluorescence images were acquired with an upright fluorescence macroscope using proper filters to detect GFP constitutive expression of implanted human cells and the labeled protein A38C-alexa647. Tumor masses in green and A38C-alexa647 in red. Two representative mice are shown for each site (n=5). Scale bars= 1mm. (D) Signal to noise ratios calculated by image processing. n=3 mice.
26
Altogether, our results demonstrated that the in vivo model of ovarian peritoneal carcinomatosis were relevant to the clinical situation. The nanoprobe successfully detected every nodule with two different procedures. The fluorescence signal was specific and persistent over time, with a microscopic resolution and a good signal to noise ratio.
6. Characterization of the interaction between the nanoprobe and peritoneal nodules
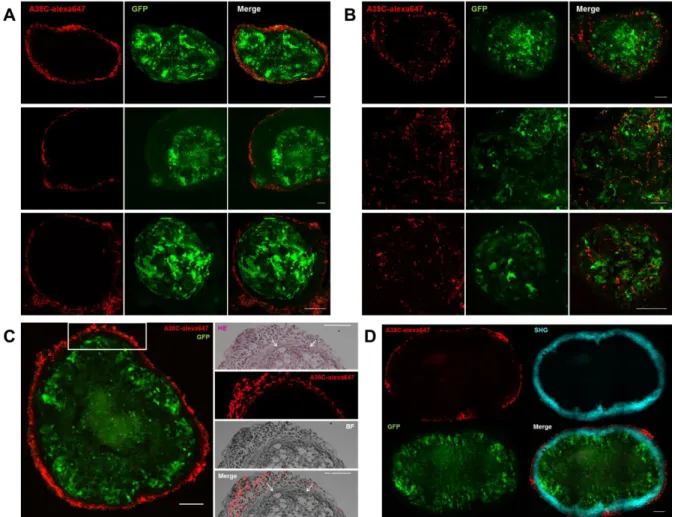
The histological samples obtained from the mice in both procedures were fixed and frozen sections were observed by confocal microscopy to better characterize the in vivo interaction between the nanoprobe and the cancerous tissues. In both procedures, the same labeling pattern was found on every nodule, independently of its implantation site in the peritoneal cavity. Concerning the sequential procedure (Figure 7A and S8A and C), the nanoprobe fluorescent signal was outlining the cancerous tissues by labelling cells outside the nodule following its shape, leaving a small space between the GFP-tumor cells and the labelled cells. In the coinjection procedure (Figure 7B and S8B and D), part of the signal was also surrounding the nodule, in a less clearly defined manner than the labelling obtained in the sequential protocol. The A38C fluorescent signal was also found inside nodules, and part of it co-localized with tumor cells (GFP signal). Healthy peritoneal tissue from non-tumor bearing mice (controls of both procedures) were also collected and prepared for confocal microscopy. Images from controls were processed the same way as images from tumor-bearing mice and presented to display equal dynamic range fluorescence intensity as images of nodules’ frozen sections, as shown in figure S8E and F, for sequential and coinjection controls respectively. No background signal of the probe was visible in absence of tumor, so the signal observed on nodules’ sections was specific. Our observations showed that the entire probe signal was found outside of nodules with the sequential procedure and most of it was not on the cancerous cells with the coinjection procedure. To get a more precise localization of cells interacting with the probe in vivo, we performed hematoxylin and eosin (H&E) staining on nodule’s frozen section from the sequential protocol (Figure 7C). It showed a putative fibroblast layer surrounding the peritoneal nodules and another layer of unidentified cells labelled by the A38C probe. To determine if it was a fibroblast layer, multiphoton microscopy and second harmonic generation (SHG) were used to visualize the collagen capsule synthetized by fibroblasts (Figure 7D). The SHG signal was located on this first layer of cells surrounding nodules thereby identified as fibroblasts. The signal of the nanoprobe was found on an outer layer of unidentified non-GFP cells in the tumor microenvironment. The in vivo model was developed with immunodeficient mice that only conserved their innate immunity (lack of T cells, B cells remains). Among the variety of cells present in tumor microenvironment, the myeloid lineage
27
is heavily represented, tumor associated macrophages (TAMs) and Myeloid Derived Suppressor cells (MDSCs) in particular [59-61]. Thus, we hypothesized that the cells labeled by the nanoprobe could be immune cells.
7. Identification of peritumoral cells labelled by A38C nanoprobe
To determine if immune cells within the tumor microenvironment were labelled by A38C-alexa647 in our model, we first realized immunohistofluorescence staining on nodules’ frozen sections, from mice which underwent the sequential procedure, with a mouse anti-CD45 monoclonal antibody that revealed all immune cells from lymphoid and myeloid lineages. In Figure 8A (see control isotype staining Figure S9), the CD45 signal on the left panel was more extended than on the right panel,
Figure 7: Characterization of A38C interaction with nodules in vivo. Confocal imaging of peritoneal nodules’
frozen sections developed on preferential peritoneal carcinomatosis sites. (A) Sequential and (B) Coinjection protocols. Images were analyzed with Fiji software. Tumor masses fluorescent signal (GFP) and A38C probe fluorescent signal (alexa647) are intrinsic. Three representative nodules from various sites are presented for each procedure. n=6 mice. (C) Left panel: Confocal imaging of a peritoneal nodule from a mouse that underwent sequential protocol; right panel (white square region of the left panel): H&E staining of the next serial frozen section, color, fluorescence (alexa647) and bright field images (BF). The arrows on the HE and merge images point to the fibroblast layer surrounding the nodule. (D) Multiphoton microscopy: tumor masses fluorescent signal (GFP) and A38C probe fluorescent signal (alexa647) are intrinsic, second harmonic generation (SHG) was used to visualize the collagen capsule. n=2 mice. Images were analyzed with Fiji software. Confocal, HE staining and Multiphoton frozen sections thicknesses = 20µm / 10µm / 80µm. Scale bars= 100µm.
28
pointing out two different stages of tumor microenvironment’s development. However, in both cases the A38C-alexa647 signal was found at the periphery on cells stained with the anti-CD45 antibody. This observation suggested that the nanoprobe was able to detect peritoneal nodules independently of their microenvironment extent. In order to better qualify which type of immune cells were labelled by the nanoprobe, we then dissociated peritoneal nodules from mice which underwent the sequential protocol and used flow cytometry to identify populations. Thus, we started by isolating all cells positive for the A38C-alexa647 signal. More than 80% of these were positive for CD45 staining and almost 60% for CD11b staining, which showed that indeed immune cells (lymphoid and myeloid cells) were labelled by the nanoprobe and the majority of them were from the myeloid lineage (Figure 8B). Among myeloid cells around 20% of cells stained with the nanoprobe were identified as TAMs and 35% as MDSCs and neutrophils (see gating strategies Figure S10, TAMs’ gating strategy adapted from [62], and MDSCs’ gating strategy from [63]). We also determined the percentage of TAMs (M1-like and M2-like phenotypes), MDSCs and neutrophils labelled with A38C-alexa647. Thus, around 60% of M1-like and M2-like macrophages and almost 40% of MDSCs and neutrophils were stained by the nanoprobe (Figure 8C). Thus, in the sequential protocol, nodules’ detection was made possible by the accumulation of immune cells expressing CD176 around the cancerous tissues. This suggested that the nanoprobe would be able to detect microscopic nodules even at their earliest development stages.
29
Figure 8: Tumor microenvironment labelled by A38C nanoprobe (A) Immunohistofluorescence on peritoneal
nodules’ frozen sections stained with a mouse anti-CD45 monoclonal antibody coupled to an alexa405 dye. Tumor masses fluorescent signal (GFP) and A38C probe fluorescent signal (alexa647) are intrinsic. Representative images from 2 mice. Frozen sections thickness = 20µm. Scale bars= 50µm. (B and C) Flow cytometry analysis with two antibodies panels on peritoneal nodules’ dissociation, after debris, doublets and dead cells exclusion (see figure S10 for gating strategies). (B) Percentage of CD45 (immune cells), CD11b (myeloid cells), tumor associated macrophages (TAMs) and Myeloid Derived Suppressor cells (MDSCs) and neutrophils (N) within the cells labelled by A38C-alexa647. (C) Percentage of A38C-alexa647 positive cells within M1-like, M2-like macrophages, Myeloid Derived Suppressor cells (MDSCs) and neutrophils (N). Representative contour plots from n=8 mice in each antibodies panel.
30
Discussion
In this project, we focused on EOC as a generic model but the approach developed here could be extended to other epithelial cancers since the TF antigen detected by the nanoprobe is a carcinoma biomarker. The choice of the model to evaluate the potential of A38C-alexa647 as a nanoprobe was conditioned by the established characteristics and stability of the A38C protein, which could answer several challenges raised by surgeons. On top of that the already existing FDA approved protein marker for EOC (MUC16) is known to carry the TF antigen, specific target of our nano object. The in
vitro model comprised 3 human adenocarcinoma cell lines chosen in order to evaluate the
membrane recognition of the glycan marker carried by MUC16 and other mucins or mucin-like proteins. We saw that A38C-alexa647 stained all 3 cell lines independently of their MUC16 expression. It is important to underline that the glycan recognized by the A38C protein is only expressed on proteins at the membrane of cancerous cells and masked on healthy cells by more complex and ramified glycosylations of the same proteins [35, 36]. These are the same on healthy and cancerous cells, but they are overexpressed in the context of cancer. The detection of the circulating form of MUC16, CA125, in the blood stream is not used in diagnostic because of high false positives rate, however targeting the glycan marker carried by CA125, or other circulating mucin-like protein, would permit to select only the CA125 coming from ovarian carcinoma and thus increase the sensitivity of detection.
Once the in vivo model established, we expected to directly detect tumor masses developed with the IGROV-1 cells intraperitoneally injected in mice. As demonstrated here, macrofluorescence imaging proved that the detection of submillimeter nodules within the peritoneal cavity of small animals was doable, and the A38C-alexa647 signals seemed to co-localize with the GFP nodule signals. The confocal microscopy on nodules’ frozen sections demonstrated that direct detection of the tumor cells was only possible with the coinjection procedure. In this protocol, developed to imitate the detachment of cells during the cytoreductive surgery, the nanoprobe signal was found inside and outside the nodules, mostly on non-GFP cells but also in part on IGROV-1 GFP cells. Those experiments also showed a persistence of the labelling for at least 3 weeks in the peritoneal cavity, a property of the nanoprobe that can be exploited for a post-operative follow up by non-invasive fluorescence imaging. As previously described [48], the A38C protein is also a nanocontainer able to carry a therapeutic molecule, confined in its cavity, to carcinoma cells and deliver it to endosomes and late lysosomes after specific recognition of the TF antigen and subsequent endocytosis. In light of those results, the combination of imaging and targeted drug delivery in a nanotheranostic approach is worth considering with the coinjection procedure.
31
Secondly, the sequential procedure did not demonstrate a direct detection of tumor cells in nodules but rather an indirect one with the staining of immune cells in tumor microenvironment. It is conceivable that the collagen capsule, seen in multiphoton microscopy surrounding the nodules, presented as a barrier that prevents direct interaction of cancerous cells with the nanoprobe in vivo. Our results suggested that the glycan cancer biomarker (TF antigen), described on 80-90% of epithelial tumors, was also expressed by various immune cell types in the tumor microenvironment. Indeed, expression of the TF antigen was already described on cells from the lymphoid and myeloid lineages. By comparing reactivity of peanut agglutinin (PNA) and monoclonal antibodies specific of TF antigen, staining was found on pre-B cells in bone marrow, immature thymocytes and blastic cells in most cases of acute leukemia, but there was no staining in normal mature peripheral blood lymphocytes because the glycan marker was not present in mature B cells and masked by sialic acid in mature T cells [41-43]. Knowing that only B cells were present in our mouse model, we assumed that part of the CD45+ / CD11b- cells, among cells labelled by the nanoprobe, could be cancer-associated B cells. As for the myeloid lineage, monoclonal antibodies and PNA positively stained CD176 on macrophages in lymphoid organs (Thymus gland, Spleen and Lymph nodes) but there was no expression on macrophages in connective tissues [36]. The TF antigen was also found on acute myeloid leukemia cells carried by other proteins than in carcinoma cells [64], indeed co-staining of CD45 and CD176 has already been described on human leukemic cells [65]. Although as previously shown, there was no background signal within the peritoneal cavity of tumor bearing or non-tumor bearing mice, so the A38C-alexa647 nanoprobe did not stain immune cells, such as peritoneal resident macrophages, other than cancer-associated ones. Moreover, this sequential procedure being developed to mimic an intraoperative assistance to the surgeons during CRS, the labelling of tumor microenvironment might allow the detection of even smaller niches of carcinomatosis. However, in this case before considering a theranostic development, the effect of targeted drug delivery on the immune cells labeled by the nanoprobe has to be addressed.
The mice model used here was developed with immortalized cell lines because they were easy to handle, cultivate and transduce with reporter genes. The proof of concept being now established for both the nanocontainer and nanoprobe aspects of the A38C protein, better models of peritoneal carcinomatosis have to be developed to pursuit a theranostic approach. Patient Derived Xenograft (PDX) models consist in the engraftment of a small piece of tumor extracted surgically from a patient, established after several passages in animals and verification of patient-like clinical features preservation (histological and genomic profiles) [66-68]. These kind of PDX models would permit to determinate the efficiency of an intraperitoneal nanotheranostic setting using the A38C protein as an imaging probe and a cargo transporting therapeutic molecules. PDX from chemo resistant patients
32
could also be developed to evaluate the ability of the A38C nanocontainer to bypass the chemo resistance often acquired during carcinomatosis relapse.
Conclusions
The present work first demonstrated the specific detection of a cancer-associated glycan biomarker
in vitro on three human adenocarcinoma cell lines, independently of MUC16 expression. This
interaction was specific, fast and with an apparent KD around 100nM. In accordance with surgeons’ specifications we obtained a microscopic detection of nodules in the peritoneal cavity of IGROV-1 tumor bearing mice, this cell line being the one expressing the smallest rate of glycan biomarker among the 3 cell lines composing the in vitro models. The A38C-alexa647 nanoprobe allowed a direct detection of tumor cells in vivo with the coinjection procedure, thus its utilization during surgery can be considered. It was also possible to use the nanoprobe to detect nodules already implanted in the peritoneal cavity. It is interesting to notice that in this case the immune cells surrounding the nodules were targeted. In future developments, we will work on PDX models of ovarian peritoneal carcinomatosis to be as close as possible to the clinic situation, and test the combination of the nanoprobe and nanocontainer aspects of the A38C variant in an intraperitoneal nanotheranostic approach.
Conflicts of interest
There are no conflicts to declare.
Authors’ Contributions
Conceptualization: M. Coustets, S. Chabot, M. Golzio, L. Paquereau
Development of methodology: M. Coustets, E. Bellard, M. Prat, G. Ferron, S. Chabot, M. Golzio, L.
Paquereau
Resources and Investigation: M. Coustets, C. Ladurantie, E. Bellard, M. Prat, V. Ecochard, M. Golzio,
L. Paquereau
Analysis and interpretation of data: M. Coustets, E. Bellard, M. Prat, G. Ferron, S. Chabot, M. Golzio,
L. Paquereau
Writing-Original draft preparation: M. Coustets, M. Golzio, L. Paquereau
Reviewing of the manuscript: M. Coustets, C. Ladurantie, E. Bellard, M. Prat, M.P. Rols, V. Ecochard,
G. Ferron, S. Chabot, M. Golzio, L. Paquereau
Visualization: M. Coustets, G. Ferron, S. Chabot, M. Golzio, L. Paquereau Funding acquisition: S. Chabot, M. Golzio, L. Paquereau