HAL Id: hal-02640446
https://hal.sorbonne-universite.fr/hal-02640446
Submitted on 28 May 2020
HAL is a multi-disciplinary open access archive for the deposit and dissemination of sci-entific research documents, whether they are pub-lished or not. The documents may come from teaching and research institutions in France or abroad, or from public or private research centers.
L’archive ouverte pluridisciplinaire HAL, est destinée au dépôt et à la diffusion de documents scientifiques de niveau recherche, publiés ou non, émanant des établissements d’enseignement et de recherche français ou étrangers, des laboratoires publics ou privés.
synthetic microbial community: Conditions and
trade-offs
Marco Mauri, Jean-Luc Gouzé, Hidde de Jong, Eugenio Cinquemani
To cite this version:
Marco Mauri, Jean-Luc Gouzé, Hidde de Jong, Eugenio Cinquemani. Enhanced production of heterol-ogous proteins by a synthetic microbial community: Conditions and trade-offs. PLoS Computational Biology, Public Library of Science, 2020, 16 (4), pp.e1007795. �10.1371/journal.pcbi.1007795�. �hal-02640446�
RESEARCH ARTICLE
Enhanced production of heterologous
proteins by a synthetic microbial community:
Conditions and trade-offs
Marco MauriID1, Jean-Luc Gouze´ID2, Hidde de JongID1☯*, Eugenio CinquemaniID1☯*
1 Univ. Grenoble Alpes, Inria, 38000 Grenoble, France, 2 University Coˆte d’Azur, Inria, INRAE, CNRS,
Sorbonne Universite´ , Biocore Team, 06902 Sophia-Antipolis, France
☯These authors contributed equally to this work.
*hidde.de-jong@inria.fr(HdJ);eugenio.cinquemani@inria.fr(EC)
Abstract
Synthetic microbial consortia have been increasingly utilized in biotechnology and experi-mental evidence shows that suitably engineered consortia can outperform individual spe-cies in the synthesis of valuable products. Despite significant achievements, though, a quantitative understanding of the conditions that make this possible, and of the trade-offs due to the concurrent growth of multiple species, is still limited. In this work, we contribute to filling this gap by the investigation of a known prototypical synthetic consortium. A first E. coli strain, producing a heterologous protein, is sided by a second E. coli strain engineered to scavenge toxic byproducts, thus favoring the growth of the producer at the expense of diverting part of the resources to the growth of the cleaner. The simplicity of the consortium is ideal to perform an in depth-analysis and draw conclusions of more general interest. We develop a coarse-grained mathematical model that quantitatively accounts for literature data from different key growth phenotypes. Based on this, assuming growth in chemostat, we first investigate the conditions enabling stable coexistence of both strains and the effect of the metabolic load due to heterologous protein production. In these conditions, we estab-lish when and to what extent the consortium outperforms the producer alone in terms of pro-ductivity. Finally, we show in chemostat as well as in a fed-batch scenario that gain in productivity comes at the price of a reduced yield, reflecting at the level of the consortium resource allocation trade-offs that are well-known for individual species.
Author summary
In nature, microorganisms occur in communities comprising a variety of mutually inter-acting species. Established through evolution, these interactions allow for the survival and growth of microorganisms in their natural environment, and give rise to complex dynam-ics that could not be exhibited by any of the species in isolation. The richness of microbial community dynamics has been leveraged to outperform individual species in biotechno-logical production processes and other processes of high societal value. Yet, in view of their complexity, natural communities are difficult to study and control. In order to
a1111111111 a1111111111 a1111111111 a1111111111 a1111111111 OPEN ACCESS
Citation: Mauri M, Gouze´ J-L, de Jong H,
Cinquemani E (2020) Enhanced production of heterologous proteins by a synthetic microbial community: Conditions and trade-offs. PLoS Comput Biol 16(4): e1007795.https://doi.org/ 10.1371/journal.pcbi.1007795
Editor: Kiran Raosaheb Patil, EMBL-Heidelberg,
GERMANY
Received: October 16, 2019 Accepted: March 18, 2020 Published: April 13, 2020
Copyright:© 2020 Mauri et al. This is an open access article distributed under the terms of the
Creative Commons Attribution License, which permits unrestricted use, distribution, and reproduction in any medium, provided the original author and source are credited.
Data Availability Statement: All relevant data are
within the manuscript and its Supporting Information files.
Funding: This work was supported in part by the
Inria IPL project CoSy and by the French national funding agency (ANR) under project Maximic (ANR-17-CE40-0024). The funders had no role in study design, data collection and analysis, decision to publish, or preparation of the manuscript.
Competing interests: The authors have declared
overcome these issues, a rapidly growing research field concerns the rational design and engineering of synthetic microbial consortia. Despite the great potential of synthetic microbial consortia, and significant efforts devoted to their mathematical modelling and analysis, a detailed understanding of how enhanced production can be achieved, and at what cost, is still unavailable. In this work, based on a quantitative model of a prototypical synthetic microbial consortium, we determine precise conditions under which a consor-tium outperforms individual species in the production of a recombinant protein. More-over, we identify the inherent trade-offs between productivity and efficiency of substrate utilization.
Introduction
Synthetic microbial consortia have been proposed for a variety of applications in industrial and environmental biotechnology and in biomedicine [1–7]. In general, the advantage of syn-thetic consortia, in comparison with naturally evolved microbial communities, is that they have a simpler composition and often a known interaction structure, which makes them easier to understand and exploit [8]. For example, a co-culture of two engineeredEscherichia coli
strains has been shown to significantly increase the production of muconic acid, a commodity chemical, from a mixture of glucose and acetate [9]. The pathway for the production of muco-nic acid was distributed over the two strains, coupled by an intermediate metabolite secreted by the first strain and assimilated by the second, which enabled more efficient conversion of the sugar mixture to muconic acid.
Natural communities are a source of inspiration for the design of synthetic consortia. An interesting example is the small ecosystem that emerged during evolution experiments with
E. coli in a glucose-limited chemostat [10,11]. In the conditions of the experiment, and more generally when growing fast on glucose,E. coli bacteria secrete acetate into the medium [12,
13]. After several hundreds of generations, the initially isogenic population in the bioreactor was found to have differentiated into genetically distinct subpopulations, including a strain with enhanced glucose uptake and acetate secretion rates, and another strain with enhanced acetate uptake and reduced acetate secretion rates [11]. The adaptive genetic changes had rein-forced the feeding of one strain on a metabolic by-product of the other, thus enabling their sta-ble coexistence.
Apart from being a model system for studying interactions in naturally occurring microbial communities [14], the results of this evolution experiment also suggest novel applications. The secretion of acetate is not only wasteful but also toxic, as its accumulation in the medium inhibits bacterial growth [15–17]. Growth inhibition by acetate and other weak acids is a well-known problem in industrial biotechnology, where it limits the productivity of strains modi-fied to convert a substrate into a recombinant protein or a metabolite of interest [18,19]. The
E. coli community described above suggests an elegant solution to this problem. When
cocul-turing a species producing a heterologous protein of interest and secreting acetate with another species specialized in the assimilation of acetate, the latter could remove the acetate secreted into the medium by the former (Fig 1). Several instances of synthetic consortia imple-menting (variants of) this idea have been reported in the literature [20–23]. For example, Zhou
et al. [23] describe a consortium of modifiedE. coli and Saccharomyces cerevisiae strains jointly
producing a precursor for an antitumor agent, where the acetate secreted by the bacteria pro-vides the substrate for growth of the yeast population.
Despite these promising results, it is not obvious that a consortium of heterologous protein producers and acetate cleaners will produce more of a protein of interest than a single strain. In particular, it requires that the gain in productivity obtained by the depletion of acetate out-weighs the loss of substrate incurred by the maintenance of the population of acetate cleaners. The aim of this study is to investigate under which conditions enhanced productivity of a het-erologous protein is possible and which trade-offs in the use of available resources this involves. We focus on a prototypical synthetic consortium ofE. coli strains that was previously
implemented and shown to lead to higher biomass accumulation in both batch, chemostat, and biofilm conditions [20].
Mathematical modeling can be leveraged to quantitatively characterize the conditions for improved productivity and inherent trade-offs. For the consortium considered here, and other communities exhibiting cross-feeding and mutualism, a large variety of models have been pro-posed in the literature [24–27]. We here focus on coarse-grained models that describe by means of a few variables the main processes fueling microbial growth and the interactions between different microbial species. Such models remain mathematically tractable while allow-ing structural determinants of the productivity of a consortium to be clearly identified.
The models we develop differ in two main respects from existing coarse-grained models of similarly structured communities [28–33]. First, we take into account a range of mechanisms controlling the growth phenotypes of theE. coli strains constituting our consortium, with the
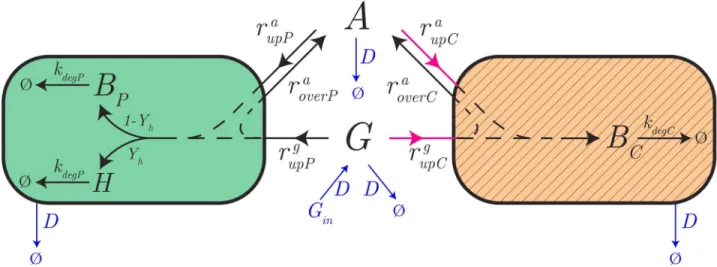
Fig 1. Synthetic consortium for the production of a heterologous protein. (A) The consortium consists of two bacterial species. A first bacterial
species growing efficiently on glucose (producer, green) produces a heterologous protein and secretes acetate as a by-product. A second species (cleaner, hatched orange) grows preferentially on acetate, thus removing the latter from the environment and relieving its inhibitory effect on the growth of the producer. Assuming a well-stirred reaction volume,BPandBCdenote the biomass concentrations of the producer and cleaner species,
respectively,H is the concentration of the heterologous protein, A and G denote the concentrations of acetate and glucose. (B) The consortium is grown in a bioreactor, where the inflow and outflow rates and the glucose concentration in the inflowing medium can be externally controlled. We here consider equal and constant inflow and outflow rates, which means that the bioreactor volume is constant and a well-defined steady state can eventually be reached [38].
aim of obtaining quantitatively predictive models. In particular, in addition to acetate toxicity, we consider carbon catabolite repression [34], threshold regulation of acetate overflow [12], and growth-independent maintenance [35]. These mechanisms play an important role in shaping the dynamics of the consortium and are also crucial for making quantitative sense of the experimental data [13]. Second, whereas most of the modeling studies have been con-cerned with the conditions of coexistence of strains secreting and consuming acetate, we will focus here on the conditions for enhanced productivity of the expression of a heterologous protein by the former. The relationship between coexistence and productivity is not straight-forward: while increased productivity requires coexistence, it may also affect the latter, not least through the metabolic load incurred by heterologous protein expression [36,37].
The models developed in this study will be analyzed in the well-defined steady-state condi-tions of growth in a chemostat as well as in fed-batch [38]. This results in three main contribu-tions. First, we explain how the overexpression of the heterologous protein modifies the growth rate of the producer strain and thus the boundaries of the producer and cleaner coexis-tence domain. Second, we determine how productivity is improved under conditions of coex-istence, when the loss of substrate due to the growth of the acetate cleaner population is offset by the gain in productivity due to the removal of acetate from the medium and the consequent increase in biomass of the producer. Third, we predict that the increased productivity comes at the price of a reduced yield of conversion of substrate into product, thus generalizing to the community level the rate-yield trade-off observed on the level of individual species [39,40]. While our study focuses on the synthetic consortium of heterologous protein producers and acetate cleaners described inFig 1, the main conclusions are sufficiently general to carry over to other cross-feeding and mutualistic systems harnessed as microbial cell factories. Moreover, the conditions and trade-offs identified here may also provide a starting point for the development of model-based feedback control strategies for optimizing the productivity of synthetic microbial consortia.
Results
A dynamical model of the bacterial production strain
Model principles and state equations. The synthetic consortium considered here consists
of twoE. coli strains, one growing on glucose and producing the heterologous protein, and the
other preferentially growing on acetate and thus removing this growth-inhibitory by-product from the environment [20]. While the overall structure of the model is similar to other popula-tion-based models of synthetic mutualistic consortia [28–33], it also differs on key points from previous work in order to account for regulatory mechanisms specific toE. coli. We here
explain the model for the producer strain in detail and then appropriately modify the model for the cleaner in a later section.
The model for the producer is schematically represented inFig 2A. In a well-defined mini-mal medium, glucose at a concentrationG [g L−1] is taken up at a raterg
up[g gDW
−1h−1]
(where gDW stands for “gram Dry Weight”). The substrate is converted partly into proteins and other macromolecules, which make up most of the biomass, and partly utilized for pro-ducing ATP and other energy carriers. In fact, around half of the carbon contents of the sub-strate is consumed by energy metabolism and leaves the cell in the form of CO2[41]. The
conversion of glucose into biomass is thus characterized by the biomass yield coefficientYg [gDW g−1]. Acetate overflow at a ratera
over[g gDW
−1
h−1] occurs when the glucose uptake rate reaches a threshold level [42,43], thus increasing the acetate concentrationA in the medium.
In the absence of glucose,E. coli can utilize acetate as an alternative substrate, taken up at a
ratera
up[g gDW
−1h−1] and converted into biomass with a yield coefficientY
Accumulation of acetate in the medium inhibits bacterial metabolism and growth [15–17]. The producer strain differs from a wild-typeE. coli strain in that it carries a plasmid for the
inducible expression of a heterologous protein. As a consequence, the total biomass concentra-tionBtot[gDW L−1] is the sum of the concentration of heterologous proteinH [gDW L−1] and the concentration of biomass actively involved in cellular growth and maintenance, the auto-catalytic biomassB [gDW L−1]. The fraction of biomass production assigned to the synthesis of heterologous protein is determined by the (dimensionless) product yield constantYh. The total biomassBtot[gDW L−1] decays at a ratekdegBtot, with degradation rate constantkdeg [h−1]. In other words, non-growth-related maintenance of the biomass requires an expendi-ture of resources equal tokdegBtot[44].
The producer strain is assumed to grow in a bioreactor operating in continuous mode [38], that is, with a dilution rateD [h−1] and a glucose concentrationGin[g L−1] in the inflow. This
Fig 2. Model of the producer strain and its calibration. (A) The model describes the uptake of nutrients, glucose and acetate, at ratesrg upandrupa,
respectively, as well as the pathways for acetate overflow (ra
over), production of autocatalytic biomass and heterologous protein in proportions
determined by the yield coefficientYh, and degradation of biomass (kdeg). The bacterial population grows in a bioreactor operating in continuous mode,
whereby the dilution rateD and the glucose concentration in the inflow Gincan be tuned (indicated in blue). Concentrations in the bioreactor are
denoted byG for glucose, A for acetate, H for heterologous protein, and B for autocatalytic biomass. For clarity, regulatory interactions due to growth inhibition by acetate and carbon catabolite repression have been omitted from the figure. (B) and (C) Experimental data from [13] used to identify the parameter values of the system of Eqs1–6. The data include measurements of the growth rateμ+
, the glucose uptake ratergþ
up, the (net) acetate uptake
rateraþ
up, and the acetate overflow rater aþ
overduring exponential growth of anE. coli wild-type strain in batch conditions in minimal medium with glucose
as the sole carbon source (B left panel), acetate as the sole carbon source (B right panel) and in glucose with increasing concentrations of acetate added (C). The + symbol indicates that the measurements have been carried out during exponential growth in batch. The fit of the model to the data is shown as well (red curve). The R2values of the fit are 0.6, 0.77, and 0.77 (from left to right).
gives rise to the following dynamical system of Ordinary Differential Equations (ODEs): dG dt ¼ r g upðG; AÞ B þ D ðGin GÞ; ð1Þ dA dt ¼ ðr a overðG; AÞ r a upðG; AÞÞ B D A; ð2Þ dB dt ¼ ð1 YhÞ ðYgr g upðG; AÞ þ Yaðr a upðG; AÞ r a
overðG; AÞÞÞ B kdegB D B; ð3Þ
dH dt ¼YhðYgr g upðG; AÞ þ Yaðr a upðG; AÞ r a
overðG; AÞÞÞ B kdegH D H; ð4Þ
with
Btot¼B þ H: ð5Þ
The term Yaraoverrepresents the biomass equivalent lost due to acetate overflow, that is,
the biomass that would have been produced if the secreted acetate had instead been taken up by the cells. Note that the specific rate of biomass production per unit of biomass, including both heterologous protein and catalytic biomass, is given by
Ygr g upðG; AÞ þ Yaðr a upðG; AÞ r a
overðG; AÞÞ. Since only catalytic biomass is actively participating
in cellular growth, the total rate of biomass production is obtained by multiplying the specific rate withB.
Definition of growth rate. The model of Eqs1–5allows the (specific) growth rateμ [h−1] to be explicitly defined in terms of the reaction rates. By definition, the rate of change of the total biomass in the bioreactor equals the biomass produced due to the growth of the bacterial culture (μBtot) minus the biomass flushed out due to dilution (DBtot):
dBtot
dt ¼ ðm DÞ Btot: ð6Þ
Therefore, the specific growth rateμ represents the sum of the rate of change of total
bio-mass per total biobio-mass unit and the dilution rate m ¼ 1
Btot
dBtot
dt þD: ð7Þ
From Eqs3–5it then follows that m ¼ ðYgrg upþ Yaðr a up r a overÞÞ B Btot kdeg: ð8Þ
In the absence of heterologous protein productionBtot=B, and the growth rate is given by the balance between substrate assimilation and dissimilation and biomass degradation. Heter-ologous protein production, however, puts a burden on the growth of the population, by draw-ing away resources from catalytic biomass.Eq 8brings out this burden in that a largerH leads
to a smaller ratioB/Btotlowering the specific growth rate. At steady state, as shown in the
Methods section, we find from Eqs3and4thatB�=B�
tot¼ 1 Yh, with
at steady state. Then,Eq 8reduces to m� ¼ ð1 Y
hÞ ðYgrg�upþ Yaðra�up rovera� ÞÞ kdeg: ð9Þ
This formulation emphasizes that, at steady state, the growth rate linearly depends on the product yieldYh, as well as on the glucose and acetate uptake rates.
Definition of reaction rates. The rate equations are functions of the nutrient
concentra-tions and express the regulatory mechanisms at work. The rate laws are motivated by a combi-nation of modeling assumptions and experimental evidence as explained below.
The uptake rates are defined in such a way that, when inserted intoEq 8, they lead to Monod-like dependencies of the growth rate on the substrate concentrations, modulated by terms accounting for regulatory effects [45,46]:
rg upðG; AÞ ¼ kg G G þ Kg Yna Anþ Yn a ; ð10Þ ra upðG; AÞ ¼ ka A A þ Ka Ymg rgupðG; AÞmþ Ymg : ð11Þ
kg,ka[g gDW−1h−1] denote maximal uptake rate constants andKg,Ka[g L−1] half-maximal saturation constants. The inhibition term with the constantΘa[g L−1] inEq 10represents the inhibitory effect of acetate on bacterial growth [15–17], whereas the inhibition term with the constantΘg[g gDW−1h−1] inEq 11corresponds to carbon catabolite repression (CCR), that is, the repression of enzymes in the metabolism of acetate and many other secondary carbon sources while cells are growing on glucose [34,47]. The strength of CCR is correlated with the phosphorylation state of the preferred glucose uptake system, the phosphotransferase system (PTS) [48], and therefore with the glucose uptake rate in our conditions. Note that, due to ace-tate inhibition, the glucose uptake rate may be low (and CCR partially relieved) even in the presence of high glucose concentrations in the medium. The exponentsn and m shape the
nonlinear effect of acetate inhibition and carbon catabolite repression, respectively. When the glucose uptake rate exceeds a thresholdl [g gDW−1h−1],E. coli produces and
secretes acetate as a fermentation by-product [42,43]. This overflow metabolism has been explained as providing cells, in the presence of excess glucose, with a less efficient but also less costly way to produce ATP than through respiration [43]. Experimental data show that, above the threshold level, the acetate secretion rate is proportional to the excess glucose uptake rate:
ra
overðG; AÞ ¼ kover max ð0; rupgðG; AÞ lÞ: ð12Þ
Model calibration. The model has 14 parameters most of which have been measured or
can be estimated from published data sets. The fact that these experiments have been carried out with differentE. coli strains and in different conditions carries the risk of obtaining
param-eter values that are mutually inconsistent. In order to avoid this problem, we have calibrated the model as much as possible against a single, recently published data set for anE. coli
wild-type strain grown in batch in minimal medium with different concentrations of glucose and acetate [13], that is, for conditions in whichD = 0 h−1andYh= 0. Only the values for the bio-mass degradation constantkdeg, the threshold for acetate overflowl, and the half-maximal satu-ration constantsKgandKawere taken from the literature. The results of the parameter estimation procedure, described in more detail in theMethods section, are plotted inFig 2and show an excellent fit of the model to the data, despite the apparent noise in the measurements,
which prevents a perfect fit by any sufficiently smooth model. The parameter values are reported inTable 1and were compared with other published values for consistency (Methods). In order to verify that the resulting model is well-posed, we also performed ana-posteriori
identifiability analysis (S1 Fig), showing tight confidence intervals for the parameter estimates. In most simulations, the product yield coefficient was set toYh= 0.2.
The model is able to reproduce key growth phenotypes
Simple as it is, the model is able to reproduce a range of experimentally observed growth phe-notypes that are important for the study of a consortium aimed at the production of a heterolo-gous protein of interest, both quantitatively and qualitatively. We demonstrate this by
validating the model in scenarios that are different from the one used for model calibration (Fig 2). In particular, we consider dynamic growth in batch of the wild-type strain (diauxic growth on glucose and acetate), exponential growth of an energy-dissipating mutant strain (with a different acetate overflow behavior), and exponential growth of several glucose uptake mutant strains (with different growth rates and acetate secretion rates). In each case, the model predictions are compared with experimental data sets that were not used for identifying the model parameters. Moreover, we explain the relevance of the different scenarios for the construction of the producer and cleaner making up the consortium ofFig 1.
Diauxic growth. When growing in batch in minimal medium with glucose,E. coli
bacte-ria attain a high growth rate and secrete acetate into the medium. Only after the glucose has been consumed, the cells start to take up acetate [12,49]. We validated our model by ensuring that it reproduces this so-called diauxic growth behavior by simulating a batch experiment (D = 0 h−1) in the absence of heterologous protein production (Yh= 0). The results are shown inFig 3A. The biomass concentration in the bioreactorB is seen to increase while the glucose
concentration (G) decreases and acetate accumulates without being consumed (A). When the
glucose is almost completely depleted (*4 h), cells continue growth on acetate at a lower rate.
Table 1. Parameter values. Values of the parameters of the model of Eqs1–4describing the producer strain, with rates as in Eqs10–12, and the cleaner strain, with rates as in Eqs14–16.
Parameter Value Reference
kg 1.53 g gDW−1h−1 This work
Kg 0.09 g L−1 [69]
Θa 0.52 g L−1 This work
n 1 This work
kover 0.17 This work
l 0.7 g gDW−1h−1 [68] ka 0.97 g gDW−1h−1 This work Ka 0.5 g L−1 [70] Θg 0.25 g gDW−1h−1 This work m 1 This work Yg 0.44 gDW g−1 This work Ya 0.298 gDW g−1 This work Yh 0.2 This work kdeg 0.0044 h−1 [45] kΔPTS 0.38 g gDW−1h−1 This work
kAcs 1.46 g gDW−1h−1 This work
KAcs 0.012 g L−1 [12]
As shown in the same plot, the simulations are in good agreement with the experimental data of Enjalbertet al. [13]. The capability to reproduce diauxic growth depends on the inclusion of a regulatory term for CCR [34,47] inEq 11, a feature absent from many previous models. The property of diauxic growth is preserved in the case of heterologous protein production (S2 Fig).
Shift in acetate overflow in energy-dissipating mutant. The proton-leaking LacY
mutant described by Basanet al. [43] has an effect of energy dissipation and therefore a lower
Fig 3. Model validation. (A) Time evolution of the concentration of glucoseG (blue curve), acetate A (red curve), and biomass B (green curve) in a bioreactor operating in batch mode, with initial concentrations of 2.7 g L−1of glucose and 0.1 g L−1of biomass. The predicted time-courses are compared with the data from Enjalbertet al. [13] (dots). (B) Effect of lower growth yieldYg, accounting for the use of an energy-dissipating LacY
mutant, on the onset of acetate overflow, indicated by the overflow rate (black curves) reached at steady state in a bioreactor operating in continuous mode, withGin= 20 g L−1. A decrease in growth yield (Yg= 0.27 gDW g−1for the mutant vsYg= 0.44 gDW g−1for the wild-type strain) causes acetate
overflow to occur at a lower growth rate in the mutant and the rate of overflow to depend more strongly on the growth rate (steepness of the curve). The model predictions are compared with the data from Basanet al. [43] (dots). Since the onset of acetate overflow occurs at slightly different growth rates in the wild-type strain used for calibration and the wild-type strain used by Basanet al., we compare the relative changes in growth rates upon a decrease in growth yield. ^m^refers to the growth rate at which acetate overflow starts. (C) Predicted versus measured growth rate values for glucose uptake mutants (dots and diamonds, see legend) with different values forkgthat grow exponentially in batch in minimal medium with glucose (G(0) =
3.6 g L−1). The growth rates of the mutantsμ+have been normalized with respect to the growth rate of the wild-type strain mþ
WTin the same conditions.
Dashed lines indicate perfect predictions as a reference. The data are from Steinsieket al. [52]. (D) Idem for acetate secretion rates of mutants (raþ over) and
wild type (raþ
overWT). In all four plots there is a good or very good correspondence between the model predictions and the experimental data. https://doi.org/10.1371/journal.pcbi.1007795.g003
growth rate. One might naively expect that the decrease in growth rate would lower the amount of acetate secreted, but this is not the case as energy dissipation causes acetate overflow to start at a lower growth rate [43]. The model reproduces this observation in the case of steady-state growth in a bioreactor operating in continuous mode, without heterologous pro-tein production (Yh= 0), as shown inFig 3B. In order to mimick the effect of the LacY muta-tion, the growth yieldYgwas decreased from its estimated value of 0.44 gDW g−1(Table 1) to 0.27 gDW g−1. Intuitively, the onset of acetate overflow occurs at a lower growth rate, because for a lower growth yield more substrate is needed to produce a given amount of biomass. As a consequence, the glucose uptake rate must be higher to attain the growth rate set by the dilu-tion rate. The model not only correctly predicts that acetate overflow starts at a lower growth rate, but also that the rate of acetate secretion increases more strongly with growth rate, as wit-nessed by the steeper curve for the lowerYgvalue inFig 3B. The reproduction of the shift in acetate overflow is a non-trivial achievement of the model and critically depends on the intro-duction of a regulatory term for acetate overflow in the model,Eq 12, a feature missing in many other models.
Like energy dissipation, the overexpression of a heterologous protein puts a burden on the metabolism of the host cell, leading to a lower growth rate and other problems for the meta-bolic engineering of the cell [36,37]. The analogy between energy dissipation and protein overexpression can be further developed by deriving fromEq 9the following relation between the yieldsYg,Yh, the dilution rateD, and the threshold l for acetate overflow:
D ¼ ð1 YhÞYgl kdeg: ð13Þ
In the derivation we used thatμ�=D and overflow starts at rg�
up¼l, where r a�
over¼ 0 and
ra�
up ¼ 0 (due to carbon catabolite repression).Eq 13shows that a glucose uptake rate equal tol
occurs at lowerD for both lower Yg(energy dissipation) and higherYh(heterologous protein production). For an increase in product yield, the model indeed predicts the same shift in ace-tate overflow as for a decrease in growth yield (S2 Fig), consistent with reports in the literature [50].
Changes in growth rate and acetate secretion rate in glucose uptake mutants. While
the PTS is the main glucose uptake system ofE. coli, a number of other systems are capable of
transporting glucose into the cell, such as maltose and galactose transporters [51,52]. Steinsiek
et al. systematically tested during exponential growth in batch how the growth rate, the glucose
uptake rate, and acetate secretion rate change in strains in which (combinations of) uptake sys-tems have been deleted. The mutants are straightforward to simulate by means of the model bearing in mind that the deletion of an uptake system decreases the value ofkg, the maximum glucose uptake rate. More precisely, the observed relative decrease of the glucose uptake rate in a mutant strain leads to a decrease in the same proportion ofkg. The predicted growth rates and acetate secretion rates for the mutants correspond well to those measured experimentally by Steinsieket al. (Fig 3C and 3D). As expected, for mutants strongly reducing glucose uptake the growth rates are low and no acetate overflow occurs. Mutations in glucose uptake systems form the basis for constructing a cleaner strain that does not or only weakly grow on glucose but instead takes up acetate at a high rate (see [20] and below).
A dynamical model of the producer-cleaner consortium
As shown inFig 3, even at low concentrations, the acetate secreted by theE. coli producer
strain impairs growth, and therefore the capability to produce the heterologous protein in high amounts. The detrimental effect of acetate could be alleviated by engineering a second
briefly describe the genetic modifications required to turn a wild-typeE. coli strain into a
cleaner strain, and we provide the model of the synthetic consortium consisting of produc-ers and cleanproduc-ers. A very similar consortium has been implemented in previous experimental work [20] and coexistence properties have been analyzed by means of a mathematical model of the consortium [31]. The analysis in the next section will focus on a different topic, the conditions and trade-offs underlying improved productivity of a heterologous protein.
Design of cleaner strain and model equations. The cleaner strain is obtained from a
wild-typeE. coli strain by knocking-out the gene ptsG, encoding a major subunit of the glucose
uptake system PTS [51], and transforming this strain with a plasmid enabling the inducible overexpression of the native geneacs, coding for the enzyme acetyl-CoA synthetase (Acs) [12]. It has been shown that deletion ofptsG reduces the glucose uptake rate 4-fold [52]. The possi-bility of the cell to continue to take up glucose at a reduced rate, through other, non-specific systems, is advantageous for our purpose, since it allows the cleaner to grow faster than on ace-tate alone and thus enlarges the coexistence range in continuous-mode cultivation (see below). Overexpressingacs has been shown to increase the growth rate of E. coli on acetate
[53]. Unlike the producer, the cleaner strain does not express the heterologous protein of interest.
With the above design, the model of the cleaner strain is similar to that of the producer, except thatEq 4can be eliminated andBtot=B. The rate equations for the cleaner are the fol-lowing, using the subscriptCto refer to concentrations and rates of the cleaner:
rgupCðG; AÞ ¼ kDPTS G G þ Kg Yna Anþ Yn a ; ð14Þ ra
overCðG; AÞ ¼ kover max ð0; r g upCðG; AÞ lÞ; ð15Þ ra upCðG; AÞ ¼ ka A A þ Ka Ymg rgupCðG; AÞ m þ Ymg þkAcs A A þ KAcs : ð16Þ
The only modifications with respect to the producer strain are the replacement ofkgby
kΔPTS[g gDW−1h−1],kΔPTS<kg, inEq 14, and the addition of an extra term acounting for Acs overexpression inEq 16, with maximal uptake ratekAcs[g gDW−1h−1],kAcs>ka, and half-maximal saturation constantKAcs[g L−1].
Model of consortium. Next, we assemble the model for the protein producer and the
ace-tate cleaner to obtain the model of the consortium (Fig 4). The two populations, growing in the same reactor environment, interact in a number of direct and indirect ways. Both the pro-ducer and the cleaner take up glucose from the environment, while in addition the cleaner is capable of assimilating acetate secreted by the producer. The removal of acetate cleans the environment from a toxic by-product inhibiting the growth of, especially, the producer. The mutualistic interaction structure of the consortium, in which both strains favor growth of the other, causes the consortium to escape the exclusion principle [54] and makes coexistence of the two strains possible.
The dynamics of the system are thus characterized by the following system of ODEs, where the dependency of the rate expressions on the concentrations has been dropped for clarity:
dG dt ¼ r g upPBP r g upCBCþ D ðGin GÞ; ð17Þ dA dt ¼ ðr a overP r a upPÞBPþ ðr a overC r a upCÞBC D A; ð18Þ dBP dt ¼ ð1 YhÞ ðYgr g upPþYaðr a upP r a overPÞÞBP kdegBP D BP; ð19Þ dH dt ¼YhðYgr g upPþYaðr a upP r a overPÞÞBP kdegH D H; ð20Þ dBC dt ¼ ðYgr g upCþYaðr a upC r a overCÞÞBC kdegBC D BC; ð21Þ
completed by the following mass conservation equation:
BtotP¼BPþH: ð22Þ
The growth rates of the producer and cleaner strains are defined by the following equations
dBtotP
dt ¼ ðmP DÞ BtotP; dBC
dt ¼ ðmC DÞ BC; ð23Þ
which leads to expressions forμP, andμCanalogously toEq 8.S3 Figshows an example simula-tion of the consortium, in condisimula-tions leading to coexistence of producer and cleaner strains.
Fig 4. Model of the producer-cleaner consortium. The model describes the protein producer and acetate cleaner strains, in green and hatched orange,
respectively. The producer strain preferentially grows on glucose, whereas the cleaner has been modified in such a way as to prefer acetate over glucose. The genetic modifications (purple uptake arrows) include the deletion of the preferred glucose uptake system and the overexpression of a selected enzyme in acetate metabolism. The producer also expresses the heterologous protein of interest. The biomass concentrations of the producer and the cleaner are denoted byBPandBC, respectively. Reaction rates specific to the producer and the cleaner are also identified by the subscriptsPandC,
respectively (e.g., rgupPvs r g
upCfor the glucose uptake rate). The consortium grows in a bioreactor operating in continuous mode, whereby the dilution rate D and the glucose concentration in the inflow Gincan be tuned (indicated in thin blue). For clarity, regulatory interactions due to growth inhibition by
acetate and carbon catabolite repression have been omitted from the figure.
Coexistence of producer and cleaner depends on the product yield
When can the species composing the consortium stably coexist? To answer this question, we study the consortium model developed above in chemostat, that is, we investigate the existence and nature of the (stable) steady states of the model. First of all, setting both derivatives inEq 23to zero, one finds that nonzero steady-state concentrationsB�
totPandB � Ccan be obtained only if m� P¼ m �
C¼D. This simple but crucial fact immediately implies that D must not exceed
the maximal growth rate of either of the species. At the same time, acetate, the primary sub-strate for cleaner growth, is only available upon overflow in the producer. Since the latter occurs whenrgupP>l, and r
g
upPincreases with the producer growth rate (seeEq 9), it follows
that persistence of the cleaner is guaranteed only by fast enough growth of the producer. All this suggests that coexistence is only possible in a finite range of growth rates (or equivalently, dilution rates). Since the producer growth rate is affected by the product yieldYh, this range must depend onYhas well. In order to quantitatively pinpoint the effects of all these factors on the stability of the consortium, in the following paragraphs we perform steady-state analysis of Eqs17–21in a variety of experimental conditions.
Dependence of coexistence onD and gin. For ease of illustration, in this section, we
con-sider the system withYh= 0, that is, in absence of heterologous protein synthesis. All other parameters of the consortium are fixed as inTable 1. The caseYh> 0 will be considered below.
We sought the (real, nonnegative, stable) steady states of the system for a grid of values of the bioreactor inflow parameters in the region (D, Gin)2[0, 0.7] h−1×[0, 20] g L−1. Assuming that both biomasses are initially present, we first used a numerical integration approach (see details inMethods). For every value of the pair (D, Gin), unique steady-state biomass concen-trationsB�
PandB �
Cwere found for any initial positive biomass concentrations. Uniqueness of
the steady state was reconfirmed by an algebraic approach (seeMethods). Absence of multi-stability (in particular, bimulti-stability) differs from the results in [31] and follows from the mono-tonic dependence of uptake rates, and therefore growth rates, on substrate concentrations (see
Discussion).
The results from the numerical computation ofB� PandB
�
Care summarized inFig 5A(the
same results from the algebraic approach are shown inS4 Fig). As expected, stable coexistence (nonzeroB�
PandB �
C) is only observed in a finite range of values ofD. This range depends very
mildly on the specific value ofGinabove a small threshold of about 2 g L−1. For a given value of
Ginabove this threshold, four different regimes are encountered through increasing values of
D, corresponding to stable existence of the sole producer, coexistence, cleaner washout, and
producer and cleaner washout. To discuss what characterizes these regimes, we rely onFig 5C and 5E, showing steady-state values of several rates and biomass concentrations as a function ofD.
For small values ofD, rupPg� is smaller than the overflow thresholdl. Notably, in analogy with Eq 13, and bearing in mind thatYh= 0, one finds that
rupPg� ¼
kdegþD
ð1 YhÞYg¼
kdegþD
Yg ; ð24Þ
that is, glucose uptake grows linearly withD (seeFig 5C). Absence of acetate overflow impairs cleaner growth due to its inefficient growth on glucose, so that only the producer remains in the bioreactor at this rate.
At a valueD ’ 0.34 h−1whereEq 24reaches thresholdl, acetate overflow occurs. In this
rate is sufficient to sustain growth at the corresponding rateD. The resulting cleaner and
pro-ducer populations balance out in a way that guarantees the precise amount of environmental detoxification to enable growth of the producer at the same rate. The gentle decrease of the producer population size results from utilization of part of the resources to sustain the growth of the cleaner population.
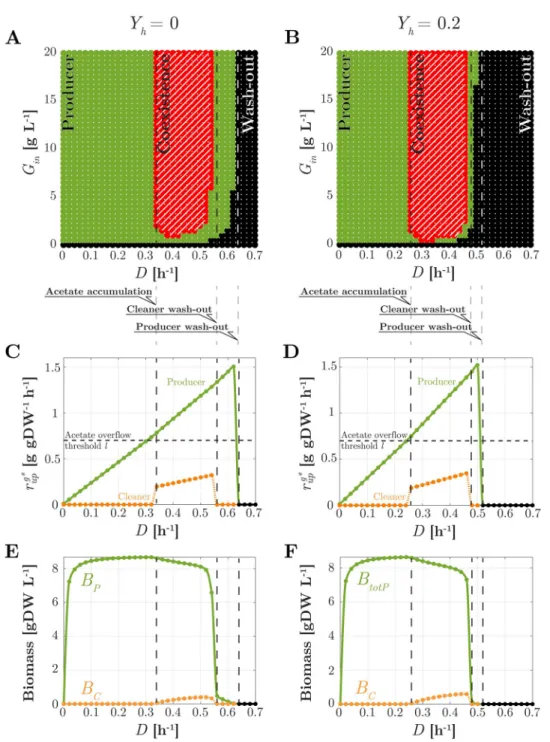
Fig 5. Steady-state analysis of the consortium in chemostat. Left:Yh= 0; Right:Yh= 0.2. (A)-(B) Nature of the
unique (stable) steady state as a function ofD and Gin(hatched red: stable coexistence; green: stable existence of the
producer only; black: washout of both strains). (C)-(D) ForGin= 20 g L−1, for the producer (green dots with solid
lines) and the cleaner (orange dots with dotted lines) strains, steady-state value of glucose uptake rate as a function of D; (E)-(F) Idem, for biomass and substrate concentrations. Consortium parameters are as inTable 1. Acetate uptake and overflow rates are shown inS6 Fig.
ForD exceeding 0.55 h−1, acetate uptake becomes insufficient to support cleaner growth. Together with the faster utilization of glucose by the producer strain, this results in the wash-out of the cleaner strain. In absence of acetate scavenging, producer growth at this high rate is only possible at low acetate concentrations, that is, if the population excreting acetate is small. This is witnessed by the sudden drop ofB�
P.
ForD above the maximal producer growth rate on glucose, the producer population is also
washed out. In view of the dependence of growth rate on glucose concentration via the Monod law (Eq 10), this threshold depends onGin. Finally, for small values ofGinmildly depending on
D and typically below 2 g L−1, the producer population does not excrete enough acetate to sup-port the cleaner growth at the corresponding rate. Of course, in absence of glucose (Gin= 0), the entire consortium is washed out.
Dependence of coexistence onYh. How is coexistence affected by the synthesis of a
heter-ologous protein? To address this question, we repeat the analysis of the previous section for the case whereYh= 0.2, which is the value of product yield reported inTable 1. Steady-state results forB�
PandB �
Care illustrated inFig 5B(a unique stable steady state is again found for
every value ofD and Gin, seeS4B Fig). Compared withFig 5A, a similar shape of the various coexistence domains is observed. Steady-state rates and concentration profiles qualitatively similar to the caseYh= 0 are also obtained, as shown inFig 5D and 5F. However, quantitative differences in the values ofD and Ginsupporting coexistence are observed.
Coexistence occurs forD > 0.25 h−1. This value is smaller than the corresponding value for the case whereYh= 0. This is explained by the fact that, for largerYh, the necessary acetate overflow to support cleaner existence starts at lower growth (dilution) rates (see the discussion followingEq 13). For sufficiently large values ofGin, coexistence persists up to aboutD = 0.48 h−1, whereas the whole consortium is washed out at aboutD ’ 0.52 h−1. Both of these dilution rates are again smaller than their counterparts forYh= 0. This is because the metabolic burden associated withYhsteers away part of the glucose uptake from producer growth, thus decreas-ing the maximal producer growth rate (Eq 9) as well as the size of the producer population. The latter implies less acetate excretion and thus a reduction in the maximal cleaner growth rate as well. It is important to note that the interval of dilution rates supporting coexistence, though shifted toward lower values, is comparable to that observed forYh= 0. Interestingly, in presence of heterologous protein synthesis, smaller values ofGin(about 1 g L−1) are required to observe coexistence at some suitable dilution rate.
We can thus summarize our results with the intriguing observation that, whereas a larger product yield shrinks the survival domain of the producer, it does not shrink the survival domain of the cleaner. In other words, heterologous protein production does not impair coex-istence despite causing a metabolic burden on the producer. However, overly large values of
YHdrastically reduce the ability of the producer to grow, to the detriment of the whole com-munity. In fact, it can be seen that when the burden is so heavy that the cleaner outperforms the producer in growth on glucose, regimes where only the cleaner survives are possible (S5 Fig).
Coexistence improves productivity but lowers the process yield
We have shown in the previous section that coexistence of the producer and cleaner strains in a chemostat is possible and even favored by a nonzero yieldYh, though at lower dilution (growth) rates. Does coexistence improve performance of the heterologous protein production process? Presence of the cleaner has the potential to favor growth of the producer due to the scavenging of acetate. At the same time, however, growth of the cleaner also consumes glucose, thus taking away resources from the producer. The effects of this resource utilization trade-off
on heterologous protein production performance area priori unclear. In the following, we
focus on two main questions: When does a consortium achieve the highest production rates? Does the consortium outperform a producer population alone in the synthesis ofH? As we
will see, based on further anaysis of our model in continuous culture conditions in the chemo-stat (with product yield fixed toYh= 0.2), the answer to these questions will unveil further trade-offs between different notions of production performance.
The consortium attains highest productivity in a coexistence regime. For the same
con-ditions as in Figs5Band6Areports a heatmap of the productivity of the consortium as a func-tion of the bioreactor parametersD and Gin. Productivity is defined as the steady-state rate of outflow of proteinH through the chemostat effluent (DH�
). Productivity is indeed maximal in a coexistence regime. Highest values are obtained near the maximal dilution rates before the cleaner washout, and for high input glucose concentrations (Fig 6A). Productivity drops sud-denly for dilution rates near the boundary of cleaner washout (D ’ 0.5 h−1). This is the result of a sudden decrease of the producer population (Fig 5F). Productivity is of course zero for larger dilution rates where the producer is also washed out. In summary, the highest produc-tivity is obtained in a regime where coexistence of producer and cleaner is possible. In the next section, we investigate the question whether the consortium is indeed advantageous over a producer strain working in isolation.
The consortium attains higher productivity than the producer species alone. Does the
consortium outperform a producer population growing alone? Of course, productivity of the former differs from that of the latter only where coexistence is possible, which is also where the consortium attains highest productivity. The question then becomes whether in this region a producer growing in isolation would outperform the consortium.
InFig 6B, for the same value of glucose inflow concentration ofFig 5D and 5F(Gin= 20 g
L−1), we compare productivity of the consortium and of the producer species in isolation as a function of the dilution rateD. For the intermediate dilution rates where coexistence is
possi-ble, two subdomains can be distinguished. ForD between 0.26 h−1and 0.36 h−1, productivity grows withD for both the consortium and the sole producer. However, since part of the
resources are devoted to maintain the cleaner species, the producer species alone outperforms the consortium. For values ofD between 0.36 h−1and 0.48 h−1, because of the larger overflow at higher growth rates, the toxic effect of acetate becomes dominant. In absence of the cleaner, this results in a sudden drop of productivity due to a reduced size of the producer population (seeS7 Fig). For the consortium instead, the gentle reduction in producer biomass is overcom-pensated by the increase ofD. The net result is an increase in productivity (Fig 6B), up to the dilution rates where the producer biomass washes out. Crucially, the maximum value of the consortium productivity (about 0.7 g L−1h−1atD ’ 0.44 h−1) is about 14% larger than that of
the producer alone (about 0.6 g L−1h−1atD ’ 0.36 h−1). In summary, the consortium outper-forms the producer species alone in terms of productivity. As seen before, maximal productiv-ity is obtained for high values ofGin. It is worth noting that the maximum is obtained at a dilution rate strictly smaller than the maximal rate supporting coexistence. For applications, this warrants persistence of the cleaner in spite of fluctuations of the system and modelling inaccuracies. Results along the same lines are obtained for all other values ofGinsupporting coexistence.
Highest productivity corresponds to a smaller process yield. How efficient is the
con-version of substrate into product by the consortium? How does this relate with productivity? To address this point we computed the yield of the process, defined as
Y� cont¼
D H�
D Gin
Fig 6. Performance of the heterologous protein production process in chemostat (Yh= 0.2). (A) Heatmap of the productivity of the consortium (DH�) as a function of glucose inflowG
inand dilution rateD. The boundaries of the
domains of coexistence and of existence of the sole producer are reported fromFig 5Bin dashed red and solid green lines, respectively. (B) ForGin= 20 g L−1, productivity as a function ofD for the consortium (filled circles), and for a
producer growing in isolation (empty circles). The color code for coexistence (dashed red) or existence of the sole producer (green) is the same as inFig 5B. Vertical dashed lines indicate different productivity domains (seeDiscussion
in main text). (C) Same as B for the process yield ((DH�)/(DG in)). https://doi.org/10.1371/journal.pcbi.1007795.g006
that is, product outflow rate versus substrate inflow rate at steady-state (subscriptcont stands
for continuous bioreactor, to distinguish from later analysis in fed-batch).Fig 6Cshows the yield as a function ofD for the same value of Ginas inFig 6B. Note that, sinceH� ¼YhB
� totP(see Methods), it holds thatY�
cont ¼YhB �
totP=Gin. Therefore, the yield of the consortium is
propor-tional to the producer biomass (compareFig 6CwithFig 5F). The same holds for the producer alone. The highest yield is found at the highest dilution rate before overflow (D ’ 0.26 h−1), thus in particular, in absence of cleaner. Intuitively, this is because at that point, the largest producer biomass is obtained before resources are partly redirected into acetate overflow. For the consortium, this overflow sustains the cleaner growth. At rates aboveD ’ 0.26 h−1, for the producer alone, biomass loss is initially less pronounced than in the consortium, since no other species consumes glucose. However, at higher dilution rates, this results in strong acetate accumulation, whence a sharp loss of biomass and yield. Compared withFig 6Bone notices that, for the consortium, maximizing productivity is paid for in terms of a decreased yield. This trade-off takes place because maximal productivity is achieved in presence of the cleaner, that is, in presence of acetate overflow, which subtracts part of the available glucose from the protein production process. Utilisation of glucose is made even less efficient by the glucose uptake of the cleaner, which subtracts further resources from protein production. From a qual-itative viewpoint, however, the same trade-off is encountered for a hypothetical cleaner strain without residual glucose uptake (seeS8 Fig).
Dynamical model and protein production in fed-batch
The productivity of the community is expressed as the rate at which biomass and thus the protein of interest flow out from a bioreactor operating in continuous mode. From a methodo-logical point of view, continuous culture in a chemostat has the advantage of allowing produc-tivity and yield to be analyzed under well-defined steady-state conditions. However, in many biotechnological applications today, fed-batch cultures are still the standard mode of operation [55]. Moreover, the high biomass densities reached during fed-batch operation make acetate accumulation an even more pressing problem. We have therefore extended the analysis of pos-sible productivity gains of the synthetic consortium to fed-batch scenarios.
To simplify the analysis and focus on production performance, we analyze the model under the following assumptions: (i) glucose concentration in the bioreactor,G, is kept constant by a
suitable time-varying input flow; (ii) there is no outflow; (iii) the total volume in the bioreactor is constant. These assumptions are reasonable over a suitable finite time-horizon and for large ratios between bioreactor volume and input volume. The design of the (time-varying) control input parametersD and Ginto meet these assumptions is beyond the scope of this paper. For the consortium, the model describing this scenario is provided by Eqs18–21, withG fixed and D = 0 h−1. A similar adaptation holds for the model with producer only.
How does production performance of a consortium and of a producer alone compare in fed-batch? What are the trade-offs involved in this case? We illustrate simulation results for
G = 20 g L−1, also referring to more general theoretical results reported in theMethods section.
Fig 7Ashows dynamical simulation results for the producer alone and for the consortium with the cleaner. Of course in this case, biomasses do not reach a steady state. As apparent, they rather settle into an exponential growth regime, which they maintain as long asG is kept
con-stant. We can thus refer to constant proportions and constant rates in exponential growth (indicated with a superscript “+”) to investigate productivity and yield.
In exponential growth, for both the producer alone and the consortium, the growth rateμ+
is constant and equal to the constant rate of increase ofH, that is, (d log H/dt)+= (H−1dH/ dt)+. Moreover, the ratio between the product concentration and the total producer biomass
concentration at any point of the exponential growth regime is precisely equal toYh(seeFig
7A and 7Band alsoMethods). However, the rate of increase ofH is around 0.48 h−1for the consortium and only 0.37 h−1for the producer alone (Fig 7B). In view of the exponential increase ofH, it is reasonable to take the rate of increase of H as a productivity index. By this
criterion, for a fixed environmental glucose concentration, we conclude from the above that the consortium ensures higher productivity ofH.
How efficient is the conversion of glucose into the protein product? Because of the assumed constant concentrationG, at any time, the glucose uptake rate by the entire consortium, rupPg BPþr
g
upCBC, is equal to the rate of glucose supply to the bioreactor. One can thus define the
instantaneous yield of the consortium production process in fed-batch as
Yfed batch¼ dH=dt rgupPBPþr g upCBC : ð26Þ
The same index can be defined for the producer alone (whereBC= 0). In exponential growth, this yield reaches a constant valueYþ
fed batch, which is equal to 0.087 for the producer
alone and 0.08 for the consortium (Fig 7C). Thus, the yield of the producer alone is found to be greater than that of the consortium.
In summary, similar to the case of a chemostat, we observe a trade-off between productivity and yield of a protein production process in fed-batch. Again, due to the resources consumed in the growth of a subsidiary strain, greater productivity of the consortium is paid for in terms of smaller yield compared to a homogeneous population of producers only.
Discussion
Synthetic microbial consortia present a promising avenue for a variety of bioengineering appli-cations [1,3,5–7]. We are interested in the conditions that allow a synthetic consortium to express a heterologous protein with higher productivity than a single species, as well as the underlying trade-offs shaping these conditions.
As a concrete example, we have chosen a prototypical consortium of a protein producer strain and an acetate cleaner strain ofE. coli (Fig 1), a consortium that was experimentally
Fig 7. Protein production dynamics in fed-batch. (A) Time evolution in log scale of the concentrations of the total producer biomass (Btot,BtotP, thick
green) and of the product (H, thin purple) for the consortium (dashed lines) and a producer population alone (solid lines) at a fixed environmental concentration of glucoseG = 20 g L−1(horizontal blue line) (B) Growth rate and rate of increase ofH in exponential growth, for the consortium (hatched red) and the producer alone (green). (C) Idem for the process yield in exponential growth.
constructed recently [20]. In comparison with the latter consortium, we have envisioned a slightly different design of our cleaner strain. First, while removing the preferential glucose uptake system PTS, we have assumed that secondary glucose assimilation pathways remain functional, which reduces but not completely eliminates growth on glucose of the acetate cleaner strain [52], contrary to the implemented consortium. Second, in order to increase the maximal growth rate on acetate, we have included in the design of the cleaner strain a plasmid for the overexpression of Acs, an enzyme for the irreversible conversion of acetate to acetyl-CoA, as suggested by previous work [53]. The addition of the plasmid facilitates the calibration of the acetate cleaner strain, as it allows reuse of the parameter values for acetate metabolism estimated for the wild-type strain (seeMethods). Despite these differences, our model repro-duces the most important conclusion of Bernsteinet al. [20], namely that for dilution rates supporting coexistence, the consortium reaches a higher biomass concentration than the wild-type strain alone (S7 Fig).
A key challenge for constructing synthetic consortia is to guide their design by mathemati-cal modeling and analysis, before the actual implementationin vivo. Along these lines, we
developed a quantitatively predictive model of the consortium, accounting for a range of growth phenotypes (Fig 2). Like in other work on the mathematical modeling of community dynamics [28–33], we have developed coarse-grained models of the physiology of the individ-ual species in the consortium, which requires making stark simplying assumptions (see [24,
27] for other perspectives, based on genome-wide flux balance models). Despite the simplifica-tions, however, a critical requirement to assess the potential for productivity gains is the ability of the model to qualitatively and quantitatively reproduce nutrient production and consump-tion patterns, as well as to predict the growth rates of individual species. In the case of theE. coli consortium studied here, this requires to include a variety of regulatory phenomena
(threshold for acetate overflow, acetate toxicity, carbon catabolite repression, growth-indepen-dent maintenance, . . .), like in [45,46], that have not or only partially been accounted for in previous models of this and structurally similar consortia. The resulting model, with only a sin-gle biomass variable for each species, is able to quantitatively reproduce complex growth phe-notypes like diauxic growth (Fig 3A) the effect of energy dissipation on acetate overflow (Fig 3B), and the effect of glucose uptake mutants on growth and acetate overflow (Fig 3C and 3D). The analysis of the model of the synthetic consortium shows that, over the entire range of dilu-tion rates, the system has a unique stable steady state (Fig 5). These numerical results were con-firmed by explicit computation and analysis of the roots of the multinomial equations (that is, polynomial equations in several variables) characterizing the steady states of the consortium (S4 Fig). Another model of the same consortium, very similar in the level of detail of the description of the community dynamics [31], predicted the possibility of multiple stable steady states, one corresponding to coexistence of the producer and the cleaner strains, and the other to existence of the producer strain alone. The property of multistability was found to rely on the non-monotonicity of the function describing the dependence of the growth rate on the acetate concentration in the medium, when acetate is used as the sole carbon source [31]. The maximal growth rate is thus reached for intermediate acetate concentrations instead of being monotonically approached for high acetate concentrations, like inEq 11. The Monod-like function for acetate uptake used in this study was motivated by experimental data describing a monotonic increase of the growth rate with increasing acetate concentration, over the relevant range considered here [16,56]. The non-monotonicity of the function used by Harveyet al.,
however, is also supported by experimental data (Tomas Gedeon, personal communication). The discrepancy between the studies might be due to the use of differentE. coli strains,
The model predicts that coexistence of the protein producer and acetate cleaner strains is possible over a range of dilution rates (Fig 5). While coexistence in natural and synthetic eco-systems has been studied in previous work [30,31,33], and is an obvious prerequisite for the possibility of increasing productivity by a consortium, the observation that this dependency works in both directions, in that the production of a heterologous protein affects coexistence as well, is a novel finding of this study. In particular, the analysis of the model shows that the coexistence region is shifted towards lower dilution rates (Fig 5), as a consequence of the meta-bolic load associated with heterologous protein production. The effect of metameta-bolic load on microbial growth has been well-studied and is an active subject of research in synthetic biology [37,57], where feedback strategies for avoiding the deleterious consequences of metabolic overloading have been developed [58]. Our results show that questions on the relation between growth and metabolic load appear on the community level as well, and are important for assessing the productivity of synthetic consortia. Whereas the biomass concentration attained, in the absence of the production of a heterologous protein, has sometimes been used as a proxy for the productivity of a consortium [59], our analysis shows that subtle effects involving feedback from metabolic load to growth may be at work. For example, in our system maximal productivity is obtained for a dilution rate where the total biomass concentration is
suboptimal.
One of the main conclusions from this study is that coexistence of the producer and the cleaner strains may lead to a productivity gain (Fig 6). Coexistence alone is not enough to ensure this gain though, as the latter ultimately depends on a trade-off. For lower dilution rates in the coexistence region, the toxic effect of acetate is very limited and thus investing part of the substrate in the growth of non-productive acetate scavengers is not profitable, since it has the sole effect of reducing the producer population. Indeed, despite growth inhibition by ace-tate, the producer strain in monoculture manages to reach a concentration that is sufficient for supporting a higher protein production rate than in coculture. For higher dilution rates in the coexistence region, however, the toxic effect of acetate becomes so strong that the producer concentration, and thus productivity, plummet when the producer is grown without the cleaner. The investment of resources necessary to sustain the cleaner population pays off in this case: removing acetate from the medium allows heterologous protein production at a rate that more than compensates the utilization of glucose by the cleaner. Note that this trade-off involves a subtle balance between growth of the producer and cleaner, acetate overflow, acetate inhibition, and protein production, that is, nonlinear dynamical processes with feedback oper-ating at the level of the individual strains and their interactions. Therefore, predicting the pro-ductivity associated with specific bioreactor control parameters would have been extremely difficult, if not impossible, to achieve without the use of quantitative dynamical models of the type developed here.
Higher productivity in the consortia comes at the price of a lower process yield, that is, the outflow rate of heterologous protein divided by the inflow rate of substrate decreases as the productivity increases (Fig 6). This is basically another manifestation of the trade-off discussed above. Higher productivity requires a higher dilution rate, and thus more acetate overflow. In particular, maximal productivity is attained in presence of the cleaner thanks to its consump-tion of acetate, which allows the producer to grow at rates where acetate concentraconsump-tion in the medium would otherwise have reached toxic levels. However, the acetate overflow that sus-tains the cleaner growth at such high rates subtracts significant amounts of glucose from con-version into the target protein, which results in yield loss. The rate-yield trade-off is well-known in metabolic engineering [39] and has been extensively studied in microbial physiology [40], mostly in the context of single species or strains. We here show that this trade-off also appears on the community level, when weighing the costs of sustaining a cleaner population