Contents lists available atScienceDirect
Marine Pollution Bulletin
journal homepage:www.elsevier.com/locate/marpolbul
Spatial and temporal analysis of meso- and microplastic pollution in the
Ligurian and Tyrrhenian Seas
Jessica Caldwell
a, Livius F. Mu
ff
a, Christopher K. Pham
b, Alke Petri-Fink
a,
Barbara Rothen-Rutishauser
a, Roman Lehner
a,c,⁎aAdolphe Merkle Institute, Université de Fribourg, Chemin de Verdiers 4, 1700 Fribourg, Switzerland
bIMAR/OKEANOS - Universidade dos Açores, Departamento de Oceanografia e Pescas, 9901-862 Horta, Portugal cSail and Explore Association, Kirchweg 42, 8755 Ennenda, Switzerland
A R T I C L E I N F O Keywords: Mesoplastic Microplastic Environmental pollution Mediterranean Tyrrhenian Sea Ligurian Sea A B S T R A C T
Areas like the Mediterranean coastlines, which have high population density, represent locations of high pol-lution risk for surrounding environments. Thus, this study aims to compare data on the abundance, size, and composition of buoyant plastic particles collected during two weeks in 2019 in the Ligurian and Tyrrhenian Seas with data from 2018. The results from 2019 show average meso- and microplastic particle concentrations of 255,865 ± 841,221 particles km−2, or 394.19 ± 760.87 g km−2; values which differ significantly from those reported in 2018. Microplastic particles accounted for 88.7% of the sample; the majority of which had a size range being between 1 and 2.5 mm. These data are an important milestone for long-term monitoring of the highly variable plastic pollution levels within this region; showing overlaps in zones of pollutant accumulation in addition to increased overall concentrations of plastic particles compared to previous data.
1. Introduction
Since the initial studies focusing on the investigation of plastic particles present in marine environments were published, there has been an exponential increase in the amount of publications released on the topic (Ryan, 2015). Such studies often quantify meso- (20 cm to 5 mm) and microplastic (< 5 mm) particles (Eriksen et al., 2014) within these marine environments, and many have focused on the re-gions identified to be areas of high accumulation; rere-gions in the North and South Atlantic, North and South Pacific, and the Indian Ocean; which are also known as “garbage patches” in the subtropical gyres (Cózar et al., 2014). However, recent studies have indicated the Med-iterranean Sea is also highly impacted by plastic particle pollution; accumulating as much as 5% - 10% of global plastic mass (Van Sebille et al., 2015). As much as 1.25 microplastic fragments m−2are present within its waters and up to 101,000/km2present in the sediment on the sea's floor (Galgani et al., 2000;Suaria et al., 2016). Thus, the Medi-terranean has been referred to as the world's 6th largest accumulation zone for marine litter, and multiple studies have been conducted in an effort to quantify the amount of plastic particles present there (Collignon et al., 2012;Faure et al., 2015;Pedrotti et al., 2016; Ruiz-Orejón et al., 2016; Gündoğdu, 2017; Gündoğdu and Çevik, 2017;
Güven et al., 2017;van der Hal et al., 2017;Baini et al., 2018; Ruiz-Orejón et al., 2018;Caldwell et al., 2019).
In addition to the high population density within the Mediterranean region (e.g. approximately 100 million people are estimated to live on a 10 km coastal strip), nearly 200 million tourists visit the region within the year (CIESIN, 2012; Galgani, 2014). During the summer season, which is known to have the highest numbers of tourists, the con-centration of marine pollution is increased by as much as 40% (Galgani, 2014). To keep up with the high demand for plastic products generated by high population density and a booming tourism industry, the plastics industry within the 22 Mediterranean countries produces roughly 76 kg of plastic per person per year living within the region; which is 10% of the global plastic production values and makes the region the 4th lar-gest producer of plastic goods (DalbergAdvisors, 2019). The high plastic particle pollution concentration reported for the region is likely heavily influenced by the presence of these two key industries (e.g. plastics production (DalbergAdvisors, 2019) and tourism (CIESIN, 2012)). In addition, the Mediterranean Sea is an enclosed basin with a high rate of shipping and marine traffic, which also contributes to the high particle concentration found therein (Cózar et al., 2015).
As the amount of plastic pollution present in the Mediterranean rises and chemical and mechanical weathering break down plastics into
https://doi.org/10.1016/j.marpolbul.2020.111515
Received 15 April 2020; Received in revised form 22 July 2020; Accepted 22 July 2020
⁎Corresponding author at: Adolphe Merkle Institute, Université de Fribourg, Chemin de Verdiers 4, 1700 Fribourg, Switzerland. E-mail address:roman@sailandexplore.com(R. Lehner).
Available online 06 August 2020
0025-326X/ © 2020 The Authors. Published by Elsevier Ltd. This is an open access article under the CC BY license (http://creativecommons.org/licenses/by/4.0/).
smaller, more readily bioavailable sizes, the likelihood that wildlife will interact with plastic particles increases. The impact of the resulting high environmental plastic particle concentration has been observed in multiple studies conducted on organisms which inhabit the region. In studies whose focus was fish collected from Mediterranean waters, it was shown that as much as 58% of thefish residing near the surface had ingested microplastic particles and as much as 33% offish which live and feed at the sea bottom ingested microplastics (Bellas et al., 2016; Güven et al., 2017). The effects of ingesting these particles have been shown in laboratory studies to range from inflammation to decreased feeding and growth rates and even starvation for various species (Connors and Smith, 1982;Moore, 2008;Von Moos et al., 2012;Watts et al., 2015). Filter feeding organisms common in the region are also known to ingest microplastic particles, with as much as 46% of mussels sampled for study containing plastic particles (Digka et al., 2018). Skin biopsies from fin whales and analysis of muscle tissue from basking sharks, whose feeding grounds are within the Mediterranean, also showed traces of phthalates (i.e. a type of additive commonly used in plastic products to improve their mechanical properties) (Fossi et al., 2014;Fossi et al., 2016).The overall impact of these effects can be made worse by the adsorption and desorption of additional chemical pollu-tants, or by the leaching of common additives (Rochman et al., 2013; Brennecke et al., 2016;Fossi et al., 2016).
These study results highlight the importance of monitoring the le-vels of plastic particle pollution in highly affected regions during dif-ferent seasons and years in order to determine long-term trends in particle concentrations. Thus, the aim of this work was to get afirst idea about the temporal and spatial abundance, size, and composition of buoyant plastic particles (e.g. mesoplastics and microplastics) in the Ligurian and the Tyrrhenian Seas using a comparison of samples col-lected in 2019 with those colcol-lected during a sample campaign in 2018 (e.g. Assessing Plastic Pollution in the Ligurian and the Tyrrhenian Seas, Caldwell et al. (Caldwell et al., 2019)).
2. Materials and methods 2.1. Sample collection
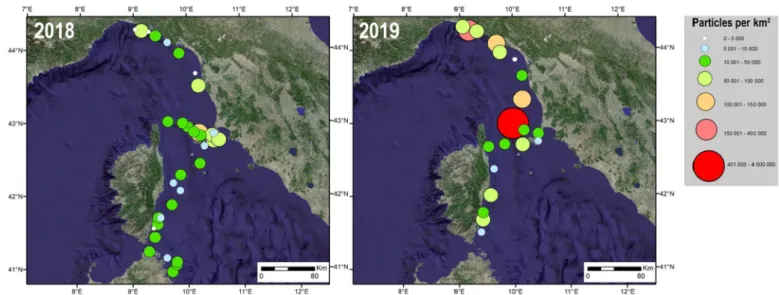
20 surface samples were collected in the Ligurian and Tyrrhenian Sea (Fig. 1) between June 1stand June 14th, 2019. Samples were col-lected from the surface water in 30-minute intervals using a manta trawl (330μm mesh; 16 × 61 cm frame opening; Five Gyres Institute,
USA). The trawl was towed at an average speed of 2 knots on either starboard or port side; with the side used for collection being altered to ensure collection always occurred upwind from the vessel. To position the trawl, a spinnaker pole was used. The spinnaker pole put the trawl 2 m away from the vessel, thus ensuring it was outside of the wake and that loss of samples due to downwelling of debris was avoided. The outer side of the trawl's collection net was rinsed with fresh water to ensure that plastic particles sticking to the sides of the net were washed into thefinal collection bag. Once the entire sample was washed into the collection bag, it was emptied over a 300μm mesh size metal sieve. Plastic particles that were larger than 300μm were collected from the sieve using metal tweezers.
2.2. Sample preparation and visual identification
After the initial sieving,filtered (metal sieve; 100 μm mesh) salt-water was added into sample containers in order to density separate smaller plastic particles from the other organic matter collected. Plastic particles foundfloating on the surface of the filtered saltwater were collected with metal tweezers. Additional sorting of particles whose material composition was still uncertain after the density separation was conducted using a dissecting stereo microscope (Leica) and la-boratory tweezers. At least two crew members checked each sample to increase the likelihood that all plastic particles were detected. All plastic particles were then transferred to 50 mL Falcon tubes and transported to a laboratory for further analysis. Thefinal sorted samples in their respective falcon tubes were dried under vacuum 24 h at 65 °C in a Binder vacuum oven prior to theirfinal storage for future studies. To prevent contamination, samples remained in sealed containers until their handling was necessary and cotton lab coats and latex gloves were worn during the handling.
2.3. Classification
Once the particles were completely dry, the mass of each sample was obtained using an AG204 Delta Range balance (readability and repeatability 0.1 mg (Mettler-Toledo, 2004)). Dried particles were then placed on a grid composed of 5 mm by 5 mm squares; thus allowing for the further differentiation of particles which belonged to the meso- and micro-size categories; and photographed with a Canon EOS 70D.
Particles belonging to the two size categories were then further sorted into five categories based on their shape and properties. The
Fig. 1. Maps from the 2018 and 2019 surveys showing the sampling sites and the particle concentration (circles) expressed as number of particles per square kilometer. Circles of varying sizes and colors (according to the legend shown) are used to represent the total meso- and microplastic concentration of each sampling site. (For interpretation of the references to color in thisfigure legend, the reader is referred to the web version of this article.)
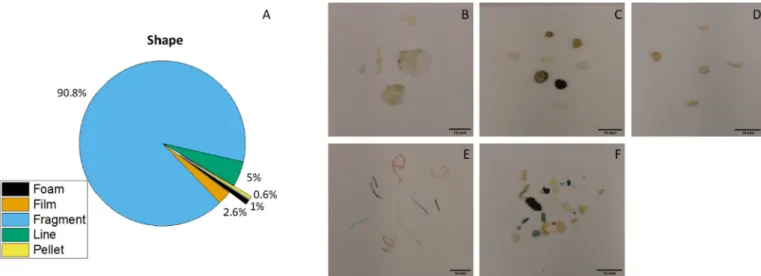
shape categories selected were fragments, foams, films, pellets, and lines. 561 total representative particles (500 fragments, 14 films, 27 lines, 10 pellets, and 10 foams) were then randomly selected at a ratio similar to their overall occurrence (Fig. 2). In order to ensure a single particle was not used to represent an entire category, a minimum value of 10 representative particles per shape was implemented.
2.4. Attenuated total reflection Fourier transform infrared spectroscopy (ATR FTIR)
Analysis of the chemicalfingerprints from representative particles were conducted as previously reported (Caldwell et al., 2019). Briefly, a Perkin Elmer Spectrum 65 FTIR Spectrometer equipped with a Perkin Elmer universal attenuated total reflection (UATR) accessory and pressure arm was used to obtain the chemicalfingerprints of the total 561 representative particles. A combination of 10 spectra ranging from 4000 cm−1to 650 cm−1were collected and averaged for each particle, analyzed with the accompanying Perkin Elmer Spectrum 10 software, and compared to the pristine polymer spectra in the Fluka library. Best matches (typically > 70% similarity) provided by the library are re-ported, with few false positive values identified and discussed. 2.5. Data processing
The sea surface distance trawled was calculated using the Global Positioning System data; which was multiplied with the width of the trawl to determine the sample area and the particle concentrations were divided by this value as previously reported (Caldwell et al., 2019). The final concentrations are reported as number of particles per square kilometer (particles km−2) and mass per square kilometer (g km−2).
Calculations were carried out in Microsoft Office 365 Excel workbooks and subsequent charts used to represent the final data were created with Origin 2016 software. The length and width of all photographed particles were measured utilizing Fiji (ImageJ version 1.52) software, and the largest dimension was used to classify the particles into the aforementioned size categories.
3. Results
Plastic particles were present in all 20 samples collected from the surface waters of the Tyrrhenian and Ligurian Seas; with the total number of tangible particles collected being 7756. Particle size data revealed that 88.7% of the sample was microplastic particles (< 5 mm), with 11.3% being mesoplastic particles (5 mm to 20 cm). The majority of the plastic particles (i.e. 55% of all particles collected) were within the range of 1–2.5 mm (Fig. 2). The calculatedfinal concentrations of buoyant plastic particles ranged from 1286 to 3,814,018 particles km−2, depending on the sample location, with an average of 255,865 particles km−2and a standard deviation of 841,221 particles km−2. This total plastic particle concentration could be further broken down to show an average of 21,938 ± 35,045 mesoplastic particles km−2 and 233,927 ± 810,357 microplastic particles km−2were collected. The mesoplastic particle concentration ranged from 0 to 147,120 par-ticles km−2 while microplastic particle concentrations ranged from 1286 to 3,666,898 particles km−2. The additional sorting of the parti-cles based on their shape showed that fragments accounted for the highest percentage of meso- (50.8%) and microplastics (94.8%) col-lected (Fig. 2).
Data obtained from weighing the particles revealed a range from 0.64 to 3298.40 g km−2with an average of 394.19 ± 760.87 g km−2 Fig. 2. Pie charts representing data collected for the ratios of the particle shape categories by count and mass, and the ratios for the size of all plastic particles present in the samples. A more detailed size breakdown for each shape category can be seen in Fig. SI2.
of plastic particles collected. Fragments were found to account for the majority (76.4%) of the total mass of the collected particles (Fig. 2). This result is in good agreement with particle count data, which shows fragments account for 90.8% of the overall sample (Fig. 3).
When it came time to select representative particles for chemical fingerprint analysis, the overall ratio for particle shape (Fig. 3) was used as the main selection criteria guide, but with a slight modification made to ensure each category had a minimum of 10 representative particles. The final average ATR FTIR spectra collected for each of the re-presentative particles showed that the main plastic types present in the sample were polyethylene, polypropylene, polyamide, and polystyrene (Fig. 4). Multiple additional polymer types (e.g. poly(4-methyle-1-pen-tene), poly(1-bupoly(4-methyle-1-pen-tene), poly(vinyl alcohol), epon, poly(isobutyl metha-crylate), and vinylidene chloride, vinyl chloride copolymers) were de-tected at very low percentages and were sorted into a category titled ‘other’ (Fig. 4). Spectra from representative environmental plastic particles are shown in comparison to the reference spectrum in Fig. SI3. Polyethylene and polypropylene are predominant in all categories other than foams, which were all composed of expanded polystyrene. A single fragment was matched to Paraffin (0.2% of all representative particles). Additional matches were found for chemicals such as 3-Aminopropyltrimethoxysilane (0.2% of all representative particles) and triethylene glycol variants (0.2% of all representative particles); com-monly used in adhesives or paints; and 1,2,3,6-Tetrahydrobenzylalcohol (0.4% of all representative fragments); com-monly used as an additive in plastic food packaging (Environmental Protection Agency (EPA), 2019a; Environmental Protection Agency (EPA), 2019b). Matches were also made with sodium salt containing compounds (0.6% of all representative particles). Small amounts of matches were made with additional organic materials such as chitin (0.6% of all representative particles).
4. Discussion
The particle concentrations reported in the current study, both by count and by mass (i.e. 255,865 ± 841,221 particles km−2 and 394.19 ± 760.87 g km−2 on average), are higher than the values reported for samples collected the previous year (i.e. 28,376 ± 28,917 particles km−2and 268.61 ± 421.18 g km−2on average) (Caldwell et al., 2019). High heterogeneity between samples was observed; which has been previously reported for the same region during the study conducted in 2018, where data showed a particle concentration range of 0.45–1999.79 g km−2by mass or 1009–122,817 particles km−2by count (Caldwell et al., 2019). Such high sample variation lead
researchers to argue that environmental sampling campaigns within the region provide a snapshot of the state of the Mediterranean which is temporally specific (Guerrini et al., 2019). Thus, differences in the concentrations obtained at different times, particularly if the samples are collected years apart, are likely to be the result of the region's heterogenous pollution distribution (e.g. as a result of changes in oceanographic conditions in addition to variations in tourism caused by seasonal changes (Galgani, 2014,Fossi et al., 2017)). It is well known that surface water concentrations of plastics are highly dependent on wind speed and wave height (Kukulka et al., 2012). Thus, one plausible explanation for this clear difference between the 2018 and 2019 survey is that the oceanographic conditions (e.g. wind, waves, current) were different, which was also a key factor that prevented samples from being taken at the exact same location during both years. This argument becomes even more valid when taking into account that during both surveys the same methods, protocols, and equipment were used by the same operators.
Variations detected in the chemicalfingerprint of plastics may be the result of the addition of chemical compounds such as dyes into the plastic products during their manufacturing (Barbeş et al., 2014). These alterations in the chemicalfingerprint of the plastic product likely ac-count for the portion of particles analyzed via FTIR in this study that fell into the non-polymer matches inFig. 4(e.g. 3-aminopropyltrimethox-ysilane and triethylene glycol variants; commonly used in adhesives or paints; and 1,2,3,6-tetrahydrobenzylalcohol; commonly used as an ad-ditive in plastic food packaging) (Environmental Protection Agency (EPA), 2019a;Environmental Protection Agency (EPA), 2019b). In spite of these potential interferences in the chemicalfingerprint analysis, utilizing FTIR to categorize the materials that compose the particles collected in environmental samples is necessary to ensure biopolymeric particles (i.e. chitin, lignin, cellulose) are not included in thefinal data reported.
Afinding of particular interest was a single fragment with a che-micalfingerprint that matched paraffin at sample site 17 (see Fig. SI1). In 2018, Suaria et al. reported thefinding of more than 350 kg of yellow wax lumps, such as paraffin, along a 5 mile front across the northern side of Elba Island as well as double the amount along a 200 km stretch of coast in Tuscany; all of which was known to have been discharged from a ship during tank-cleaning operations (Suaria et al., 2018). As the paraffin found in the current study was present in a sample collected from the same area, ourfinding might be linked to this event. Even if this is not the case, it does show that such paraffin-based waxes are still being discharged into the waters; with the impact of such pollution evident in damages to the local coastal municipalities.
Fig. 3. Thefinal ratios of particle shape for the overall sample (A) and representative images of the particles from each shape category. The categories include films (B), pellets (C), foams (D), lines (E), and fragments (F). Scale bars: 10 mm.
Additionally, chemicalfingerprint analysis revealed that a majority of the plastic particles were composed of polyethylene (50.3%), with polyamide (30.4%), polypropylene (10.9%), and polystyrene (1.9%) also accounting for large portions of the sample. Similar findings (Table 1) were seen in the data from the previous year (e.g. ethylene at 46%, polypropylene at 19%, polyamide at 19% and poly-styrene at 8%) (Caldwell et al., 2019). During both surveys the majority of the plastic particles found were made out of polyethylene while the minor part was polystyrene. In 2019, the amount of polyamide in-creased 10% in comparison to polypropylene, which was found to have almost double the amount. As stated previously, such differences could be due to oceanographic variation between the two years as well as the fact that sampling was not always possible at exactly the same site. However, a clear trend is visible; with polyethylene as the main and polystyrene as the least occurring material found. This also stands in agreement with data published in 2019 by Erni-Cassola et al.,
highlighting the environmental prevalence of each polymer type, with PE as the most abundant followed by PP, PA, and PS (Erni-Cassola et al., 2019).
Subdivision of the plastic particles into thefive shape categories (i.e. film, foam, fragment, line, pellet) revealed the vast majority of the sample, both by count (90.8%) and by mass (76.4%), was composed of fragments. This stands in agreement with both the 2018 study, which showed fragments composed 65% of the overall sample, and other lit-erature; Baini et al. (81%) and Gündoğdu and Çevik (~60%) have re-ported the largest fraction of their samples were plastic fragments (Gündoğdu and Çevik, 2017;Baini et al., 2018;Caldwell et al., 2019). However, while both surveys did reveal a majority of fragments, there is a clear increase of about 25% between the 2018 and the 2019 survey. This could be explained by the different sampling sizes (e.g. 34 samples in the 2018 survey compared to 20 in 2019 while larger sample num-bers enable a more precise picture off the overall situation) or by Fig. 4. The polymer composition of the entire sample of representative particles (top left) and the polymer composition for the particles sorted according to their shape. Data was obtained for a representative sample of 561 particles (500 fragments, 14films, 27 lines, 10 pellets, 10 foams). The color legend used for all pie charts except the‘other’ category in the figure is displayed in lower left corner of the whole sample box. A breakdown of the polymer types included within the ‘other’ category is seen with its own color legend in the last pie chart.
differences in other parameters such as the variation in the number of representative particles chosen for the FTIR analysis (e.g. 140 in 2018 vs 561 in 2019) as well as the differences in the oceanographic conditions (e.g. wind, waves, current) (Caldwell et al., 2019).
The high abundance of these microplastic fragments is hypothesized to be the result of the mechanical weathering by wind and waves and the chemical weathering by UV light of macro- and mesoplastics pre-sent in the region. However, it is important to note that certain shape categories, such as pellets and lines, are likely to be present as a direct result of different industries present within the region. Small pieces of lines or nets are known to come directly from wear-and-tear offishing equipment (Moore, 2008). Pellets are known to be the precursors used to create plastic-based products. As such, their prevalence in the sam-ples may be the result of a mishandling of production materials by the plastics industry, which is known to have a strong regional presence (DalbergAdvisors, 2019).
It is additionally important to consider that only buoyant plastic particles were sampled during this study as a result of the trawling collection technique used. Thus, plastics composed of low-density polymers (e.g. polyethylene, polypropylene (Suaria et al., 2016)) are more likely to stay afloat for longer periods of time and are therefore more likely to be collected. These plastic types are reported to be the main materials utilized for the manufacturing of common consumer goods such as food packaging, plastic bags, and other single-use pro-ducts that have been reported to be common sources of litter in the marine environment and beaches (Xanthos and Walker, 2017; PlasticsEurope, 2018;Asensio-Montesinos et al., 2019). A recent pub-lication which focused on beach pollution within the Mediterranean region reported that the main sources of such litter are beachgoers, wastewater runoff, and fishing (Asensio-Montesinos et al., 2019). As marine litter in the region is shown to increase by 40% during the high season for tourism, this is likely a key source of the plastic particles found during sample collection (CIESIN, 2012).
While tourism has an impact on the number of plastic particles present within the region, understanding the source of the particles and the high variability in particle abundance between samples requires one to consider many other factors. These factors include the proximity of the sample site to busy harbors (e.g. Port of Genoa), industrial zones, popular shipping routes (e.g. Genoa or Livorno to Barcelona), or rivers (e.g. the Magra, Serchio, Arno, Ombrone, Tevere, Tavignano, Golo, Tirso, and Flumendosa). Additional consideration should be given to the influence of wind and ocean currents on the movement of the buoyant plastic particles collected (Guerrini et al., 2019). Regions where ocean currents are weak or move in a cyclonic fashion will be more likely to see the accumulation of plastic particles than regions where currents are strong. Thus, it is not enough to consider the proximity of popular tourist destinations or large industrial zones to the
sample site alone; additional attention must be given to the influence of the marine environment.
Models created utilizing satellite data by Fossi et al. have been used to predict potential accumulation zones for plastic particles present in the Ligurian and Tyrrhenian Seas based on such environmental influ-ences (Fossi et al., 2017). These models have found a few key areas where currents move cyclonically to create gyres. These gyres (i.e. the ‘Capraia Gyre’ located between the eastern coast of Corsica and the coast of Livorno, and the more southern‘Northern Tyrrhenian Gyre’ located off the eastern coast of Corsica close to the northern coast of Sardinia) are expected to be areas of high plastic particle accumulation (Fossi et al., 2017). Additional models created by Liubartseva et al. indicate zones of accumulation for buoyant plastic particles within the region may include coastal waters near cities such as Genoa, Livorno, and, to a lesser extent, Bastia (Liubartseva et al., 2018).
The sample containing the highest number of plastic particles col-lected during this study, sample 12 (shown labelled in Fig. SI1), was collected close to the island Capraia (i.e. near the center of the‘Capraia Gyre’). Sample 12 showed a high spike in particle density (3,814,018 particles km−2 (shown in Table SI1)) compared to all other samples collected throughout the course of the study. Sample 11, collected on the very same day with a time difference of around 4 h and a distance of approximately 18.8 km between the sample collections, showed a very low particle density of 32,663 particles km−2. Sample 13, collected from a region slightly to the north, but still within the area designated as the‘Capraia Gyre’, displayed a particle density of 145,136 particles km−2(shown in Table SI1). This difference in particle concentration demonstrates a heterogenous distribution of plastics even at small spatial scales and also highlights the impact of a single outlier value on the final average particle concentration calculated. The omission of sample 12 gives an average particle concentration value of 68,594 particles km−2, which is nine times less than the average value ob-tained with its inclusion. The sampling site falls within the central re-gion of the Capraia Gyre, which is reported to be a potential accumu-lation zone and could explain the high number of particles collected. However, to understand these big differences in particle count in sample sites at such close proximity, one would need to set up a sam-pling design with more replicates in a well-defined area over a set time period while accounting for oceanographic conditions (e.g. wind, waves, currents).
Samples 2 and 4, taken off the south-eastern coast of Corsica (i.e. near the ‘Northern Tyrrhenian Gyre’) showed a particle density at 71,308 particles km−2and 70,616 particles km−2, while in 2018 the highest value found in the same area was 35,403 particles km−2. There is an increase in the particle concentrations observed in 2019, but it is not yet possible to make a statement about an increase in the particle concentration as more detailed temporal data is needed.
A high particle abundance was located near the shore for the city of Genoa. Samples 16 through 20, collected within this zone, all had particle densities greater than 90,000 particles km−2. This spike in particle density can be attributed to the close proximity of the sample sites to the busy port of Genoa, which is a destination along multiple popular shipping routes and whose surrounding city has a population over 583,000 (ItalianNationalInstituteofStatistics, 2011;Guerrini et al., 2019). The same pattern could be seen in the 2018 survey, however, the average numbers of the 2019 survey (148,719 particles km−2) for this specific area are 6 times higher than the numbers from 2018 (24,864 particles km−2). Given that during the 2018 survey, samples in this region were taken at two different times with a time difference of about 4 weeks in between, such data strengthens the argument for an increase in the particle density over the course of a year.
The areas shown to have a high particle abundance in this study overlap with those reported in 2018 (Caldwell et al., 2019). However, the higher average particle density from 2019 may indicate a slight increase in the amount of pollutants being introduce into the Medi-terranean Sea. Yet, as the region itself is known for high heterogeneity Table 1
Data summary from 2018 published inCaldwell et al. (2019)and 2019 (from this paper) including particle number, size, and composition.
2018 2019
Number of samples 34 20
Total (particle number collected) 1892 7756 Total (particles km−2) 964,789 5,117,307 Average (particles km−2) 28,376 255,865 Deviation (particles km−2) 28,917 841,221 Particles sizes (% of total) > 5 mm 35 11.3
5–2.5 mm 41.6 29.5 2.5–1 mm 21.6 55 < 1 mm 1.7 4.2 Composition (% of total) PE 46.4 50.3 PP 18.6 10.9 PA 18.6 30.4 PS 7.9 3.9 other 8.6 4.6
between samples, it is necessary to gather additional samples in the coming years to confirm or deny such findings in a more concrete manner. Additional sampling will need to be conducted utilizing the same standardized collection and processing method presented in the 2018 and 2019 studies to ensure direct comparison is possible. 5. Conclusions
Every sample collected within the Ligurian and Tyrrhenian Seas during this study contained microplastic particles. A high variability in the concentration of plastic particles in each of the samples (1286–3,814,018 particles km−2or 0.64–3298.40 g km−2) was shown and is hypothesized to be the result of variations in the currents and weather in the region along with the presence of large ports and pop-ular shipping routes. Evidence supporting this hypothesis, such as the elevated particle concentrations present in samples collected near the port of Genoa and the‘Capraia and Northern Tyrrhenian Gyres’, was found.
Revisiting the same region as in 2018 and conducting the sample collection and analysis in the same manner allows for monitoring of changes in the particle densities in the region over time. The average particle density for the samples collected during this study in 2019 are 9 times higher than the average value reported in the 2018 study (Caldwell et al., 2019). However, one should take caution when con-sidering this outcome, as it could be shown that a single value (3,814,018 particles km−2) has a drastic effect on the final average particle count reported for the study. This study also highlights the difficulties of setting up a long-term analysis of particle concentrations in such an area; where planning sample collection is affected by many different parameters such as oceanographic conditions, time, and costs. Nevertheless, further studies conducted in the region could allow for insight into whether the pollution levels are truly increasing over time. In addition, these samples would help to give insight into the pre-dominant accumulation zones for plastic particles within the region. CRediT authorship contribution statement
Jessica Caldwell: Data curation, Formal analysis, Writing - original draft, Writing - review & editing. Livius F. Muff: Data curation. Christopher K. Pham: Visualization. Alke Petri-Fink: Writing - review & editing. Barbara Rothen-Rutishauser: Writing - review & editing. Roman Lehner: Conceptualization, Methodology, Project administra-tion, Writing - review & editing.
Declaration of competing interest
The authors declare the following financial interests/personal re-lationships which may be considered as potential competing interests: Roman Lehner is the co-founder and scientific project leader of the Sail & Explore Association. The authors have no additional conflicts of in-terest to report.
Acknowledgements
The authors would like to thank all the crew members of the 2019 Expedition conducted by the Sail & Explore Association for supporting sample collection. The authors would additionally like to thank the Adolphe Merkle Foundation for the support during subsequent sample analysis. R.L. acknowledges funding from SPARK by Swiss National Science Foundation (190287).
Appendix A. Supplementary data
Supplementary data to this article can be found online athttps:// doi.org/10.1016/j.marpolbul.2020.111515.
References
Asensio-Montesinos, F., Anfuso, G., Williams, A., 2019. Beach litter distribution along the western Mediterranean coast of Spain. Mar. Pollut. Bull. 141, 119–126.
Baini, M., Fossi, M.C., Galli, M., Caliani, I., Campani, T., Finoia, M.G., Panti, C., 2018. Abundance and characterization of microplastics in the coastal waters of Tuscany (Italy): the application of the MSFD monitoring protocol in the Mediterranean Sea. Mar. Pollut. Bull. 133, 543–552.
Barbeş, L., Rădulescu, C., Stihi, C., 2014. ATR-FTIR spectrometry characterisation of polymeric materials. Rom. Rep. Phys. 66 (3), 765–777.
Bellas, J., Martínez-Armental, J., Martínez-Cámara, A., Besada, V., Martínez-Gómez, C., 2016. Ingestion of microplastics by demersalfish from the Spanish Atlantic and Mediterranean coasts. Mar. Pollut. Bull. 109 (1), 55–60.
Brennecke, D., Duarte, B., Paiva, F., Caçador, I., Canning-Clode, J., 2016. Microplastics as vector for heavy metal contamination from the marine environment. Estuar. Coast. Shelf Sci. 178, 189–195.
Caldwell, J., Petri-Fink, A., Rothen-Rutishauser, B., Lehner, R., 2019. Assessing meso-and microplastic pollution in the Ligurian and Tyrrhenian Seas. Mar. Pollut. Bull. 149, 110572.
CIESIN, 2012. National Aggregates of Geospatial Data Collection: Population, Landscape, and Climate Estimates, Version 3 (PLACE III).
Collignon, A., Hecq, J.-H., Glagani, F., Voisin, P., Collard, F., Goffart, A., 2012. Neustonic microplastic and zooplankton in the North Western Mediterranean Sea. Mar. Pollut. Bull. 64 (4), 861–864.
Connors, P.G., Smith, K.G., 1982. Oceanic plastic particle pollution: suspected effect on fat deposition in red phalaropes. Mar. Pollut. Bull. 13 (1), 18–20.
Cózar, A., Echevarría, F., González-Gordillo, J.I., Irigoien, X., Úbeda, B., Hernández-León, S., Palma, Á.T., Navarro, S., García-de-Lomas, J., Ruiz, A., 2014. Plastic debris in the open ocean. Proc. Natl. Acad. Sci. 111 (28), 10239–10244.
Cózar, A., Sanz-Martín, M., Martí, E., González-Gordillo, J.I., Ubeda, B., Gálvez, J.Á., Irigoien, X., Duarte, C.M., 2015. Plastic accumulation in the Mediterranean Sea. PLoS One 10 (4), e0121762.
DalbergAdvisors, 2019. Stop the Flood of Plastic: How Mediterranean Countries Can Save their Sea. WWF Report.
Digka, N., Tsangaris, C., Torre, M., Anastasopoulou, A., Zeri, C., 2018. Microplastics in mussels andfish from the Northern Ionian Sea. Mar. Pollut. Bull. 135, 30–40. Environmental Protection Agency (EPA), 2019a. Chemicals under the Toxic Substances
Control Act (TSCA). from.https://www.epa.gov/chemicals-under-tsca. Environmental Protection Agency (EPA), 2019b. EPA Chemical and Products Database
(CPDat). from.https://pubchem.ncbi.nlm.nih.gov/source/EPA%20Chemical %20and%20Products%20Database%20(CPDat).
Eriksen, M., Lebreton, L.C., Carson, H.S., Thiel, M., Moore, C.J., Borerro, J.C., Galgani, F., Ryan, P.G., Reisser, J., 2014. Plastic pollution in the world’s oceans: more than 5 trillion plastic pieces weighing over 250,000 tons afloat at sea. PLoS One 9 (12), e111913.
Erni-Cassola, G., Zadjelovic, V., Gibson, M.I., Christie-Oleza, J.A., 2019. Distribution of plastic polymer types in the marine environment; a meta-analysis. J. Hazard. Mater. 369, 691–698.
Faure, F., Saini, C., Potter, G., Galgani, F., De Alencastro, L.F., Hagmann, P., 2015. An evaluation of surface micro-and mesoplastic pollution in pelagic ecosystems of the Western Mediterranean Sea. Environ. Sci. Pollut. Res. 22 (16), 12190–12197.
Fossi, M.C., Coppola, D., Baini, M., Giannetti, M., Guerranti, C., Marsili, L., Panti, C., de Sabata, E., Clò, S., 2014. Largefilter feeding marine organisms as indicators of mi-croplastic in the pelagic environment: the case studies of the Mediterranean basking shark (Cetorhinus maximus) andfin whale (Balaenoptera physalus). Mar. Environ. Res. 100, 17–24.
Fossi, M.C., Marsili, L., Baini, M., Giannetti, M., Coppola, D., Guerranti, C., Caliani, I., Minutoli, R., Lauriano, G., Finoia, M.G., 2016. Fin whales and microplastics: the Mediterranean Sea and the Sea of Cortez scenarios. Environ. Pollut. 209, 68–78.
Fossi, M.C., Romeo, T., Baini, M., Panti, C., Marsili, L., Campani, T., Canese, S., Galgani, F., Druon, J.-N., Airoldi, S., 2017. Plastic debris occurrence, convergence areas and fin whales feeding ground in the Mediterranean marine protected area Pelagos sanctuary: a modeling approach. Front. Mar. Sci. 4, 167.
Galgani, F., 2014. Distribution, Composition and Abundance of Marine Litter in the Mediterranean and Black Seas. CIESM Workshop Monograph n.
Galgani, F., Leaute, J., Moguedet, P., Souplet, A., Verin, Y., Carpentier, A., Goraguer, H., Latrouite, D., Andral, B., Cadiou, Y., 2000. Litter on the seafloor along European coasts. Mar. Pollut. Bull. 40 (6), 516–527.
Guerrini, F., Mari, L., Casagrandi, R., 2019. Modelling plastics exposure for the marine biota: risk maps forfin whales in the Pelagos Sanctuary (North-Western Mediterranean). Front. Mar. Sci. 6, 299.
Gündoğdu, S., 2017. High level of micro-plastic pollution in the Iskenderun Bay NE Levantine coast of Turkey. Su Ürünleri Dergisi 34 (4), 401–408.
Gündoğdu, S., Çevik, C., 2017. Micro-and mesoplastics in Northeast Levantine coast of Turkey: the preliminary results from surface samples. Mar. Pollut. Bull. 118 (1–2), 341–347.
Güven, O., Gökdağ, K., Jovanović, B., Kıdeyş, A.E., 2017. Microplastic litter composition of the Turkish territorial waters of the Mediterranean Sea, and its occurrence in the gastrointestinal tract offish. Environ. Pollut. 223, 286–294.
ItalianNationalInstituteofStatistics, 2011. Resident population by age, sex and marital status on 1st January 2011. GEO - GEODEMO demography infigures. from.http:// demo.istat.it/index_e.html.
Kukulka, T., Proskurowski, G., Morét-Ferguson, S., Meyer, D.W., Law, K.L., 2012. The effect of wind mixing on the vertical distribution of buoyant plastic debris. Geophys. Res. Lett. 39 (7).
Liubartseva, S., Coppini, G., Lecci, R., Clementi, E., 2018. Tracking plastics in the Mediterranean: 2D Lagrangian model. Mar. Pollut. Bull. 129 (1), 151–162. Mettler-Toledo, 2004. Operating instructions METTLER TOLEDO AG balances. 2020.
from.https://www.mt.com/my/en/home/phased_out_products/others/AG204_ DeltaRange.html.
Moore, C.J., 2008. Synthetic polymers in the marine environment: a rapidly increasing, long-term threat. Environ. Res. 108 (2), 131–139.
Pedrotti, M.L., Petit, S., Elineau, A., Bruzaud, S., Crebassa, J.-C., Dumontet, B., Martí, E., Gorsky, G., Cózar, A., 2016. Changes in thefloating plastic pollution of the Mediterranean Sea in relation to the distance to land. PLoS One 11 (8).
PlasticsEurope, 2018. Plastics– The Facts 2018: An Analysis of European Plastics Production, Demand and Waste Data. Plastics– The Facts. Brussels – Belgium. pp. 39.
Rochman, C.M., Hoh, E., Kurobe, T., Teh, S.J., 2013. Ingested plastic transfers hazardous chemicals tofish and induces hepatic stress. Sci. Rep. 3, 3263.
Ruiz-Orejón, L.F., Sardá, R., Ramis-Pujol, J., 2016. Floating plastic debris in the Central and Western Mediterranean Sea. Mar. Environ. Res. 120, 136–144.
Ruiz-Orejón, L.F., Sardá, R., Ramis-Pujol, J., 2018. Now, you see me: high concentrations offloating plastic debris in the coastal waters of the Balearic Islands (Spain). Mar. Pollut. Bull. 133, 636–646.
Ryan, P.G., 2015. A Brief History of Marine Litter Research. Marine Anthropogenic Litter. Springer, Cham, pp. 1–25.
Suaria, G., Avio, C.G., Mineo, A., Lattin, G.L., Magaldi, M.G., Belmonte, G., Moore, C.J., Regoli, F., Aliani, S., 2016. The Mediterranean Plastic Soup: synthetic polymers in Mediterranean surface waters. Sci. Rep. 6, 37551.
Suaria, G., Aliani, S., Merlino, S., Abbate, M., 2018. The occurrence of paraffin and other petroleum waxes in the marine environment: a review of the current legislative framework and shipping operational practices. Front. Mar. Sci. 5 (94).
van der Hal, N., Ariel, A., Angel, D.L., 2017. Exceptionally high abundances of micro-plastics in the oligotrophic Israeli Mediterranean coastal waters. Mar. Pollut. Bull. 116 (1–2), 151–155.
Van Sebille, E., Wilcox, C., Lebreton, L., Maximenko, N., Hardesty, B.D., Van Franeker, J.A., Eriksen, M., Siegel, D., Galgani, F., Law, K.L., 2015. A global inventory of small floating plastic debris. Environ. Res. Lett. 10 (12), 124006.
Von Moos, N., Burkhardt-Holm, P., Köhler, A., 2012. Uptake and effects of microplastics on cells and tissue of the blue mussel Mytilus edulis L. after an experimental ex-posure. Environ. Sci. Technol. 46 (20), 11327–11335.
Watts, A.J., Urbina, M.A., Corr, S., Lewis, C., Galloway, T.S., 2015. Ingestion of plastic microfibers by the crab Carcinus maenas and its effect on food consumption and energy balance. Environ. Sci. Technol. 49 (24), 14597–14604.
Xanthos, D., Walker, T.R., 2017. International policies to reduce plastic marine pollution from single-use plastics (plastic bags and microbeads): a review. Mar. Pollut. Bull. 118 (1–2), 17–26.