HAL Id: hal-01985021
https://hal.inria.fr/hal-01985021
Preprint submitted on 17 Jan 2019
HAL is a multi-disciplinary open access
archive for the deposit and dissemination of sci-entific research documents, whether they are pub-lished or not. The documents may come from teaching and research institutions in France or abroad, or from public or private research centers.
L’archive ouverte pluridisciplinaire HAL, est destinée au dépôt et à la diffusion de documents scientifiques de niveau recherche, publiés ou non, émanant des établissements d’enseignement et de recherche français ou étrangers, des laboratoires publics ou privés.
Distributed under a Creative Commons Attribution - NonCommercial - NoDerivatives| 4.0 International License
Tiange Lang, Pierre Abadie, Valérie Léger, Thibaut Decourcelle, Jean-Marc
Frigerio, Christian Burban, Catherine Bodenes, Erwan Guichoux, Grégoire Le
Provost, Cécile Robin, et al.
To cite this version:
Tiange Lang, Pierre Abadie, Valérie Léger, Thibaut Decourcelle, Jean-Marc Frigerio, et al.. High-quality SNPs from genic regions highlight introgression patterns among European white oaks (Quercus petraeaandQ. robur).. 2018. �hal-01985021�
1
High-quality SNPs from genic regions highlight introgression patterns among
European white oaks (Quercus petraea and Q. robur).
.
Authors: Tiange Lang1,2,3, Pierre Abadie1,2, Valérie Léger1,2, Thibaut Decourcelle1,2,4, Jean-Marc Frigerio1,2, Christian Burban1,2, Catherine Bodénès1,2, Erwan Guichoux1,2, Grégoire Le Provost1,2, Cécile Robin1,2, Naoki Tani1,2,5, Patrick Léger1,2, Camille Lepoittevin1,2, Veronica A. El Mujtar1,2,6, François Hubert1,2, Josquin Tibbits7, Jorge Paiva1,2,8,9, Alain Franc1,2, Frédéric Raspail1,2, Stéphanie Mariette1,2, Marie-Pierre Reviron1,2, Christophe Plomion1,2, Antoine Kremer1,2, Marie-Laure Desprez-Loustau1,2, Pauline Garnier-Géré1,2,§
Addresses :
1
INRA, UMR 1202 Biodiversity Genes & Communities, F-33610 Cestas, France
2
Univ. Bordeaux, UMR 1202, Biodiversity Genes & Communities, F-33400 Talence, France
3
Big Data Decision Institute, Jinan University, Tianhe, Guangzhou, PR China
4
GEVES, 25 rue Georges Morel, 49071, Beaucouzé, France
5
Japan International Research Center for Agricultural Sciences (JIRCAS), Tsukuba, Ibaraki, Japan
6
Unidad de Genética Ecológica y Mejoramiento Forestal. Instituto Nacional de Tecnología Agropecuaria (INTA) EEA Bariloche, Modesta Victoria 4450 (8400), Bariloche, Río Negro, Argentina
7
Department of Environment and Primary Industries, Biosciences Research Division, Agribio, 5 Ring Road, Bundoora, Victoria, 3086, Australia
8
Instituto de Biologia Experimental e Tecnologica, iBET, Apartado 12, Oeiras 2780-901, Portugal
9
Institute of Plant Genetics, Polish Academy of Sciences, 34 Strzeszynska street, Poznan PL-60-479, Poland
Keywords: SNPs, functional candidate genes, Quercus robur, Q. petraea, Sanger amplicon
resequencing, introgression, species differentiation
§
2 INRA, UMR 1202 Biodiversity Genes & Communities, F- 33610 Cestas, France; Univ. Bordeaux, UMR 1202 Biodiversity Genes & Communities, Bordeaux, F-33400 Talence, France
Fax +33 (0)35385381, email: pauline.garnier-gere@inra.fr Running title: High-quality SNPs for Quercus species
3
Abstract
In the post-genomics era, non-model species like most Fagaceae still lack operational diversity resources for population genomics studies. We completed the analyses of Sanger sequences produced from over 800 gene fragments covering ~530 kb across the genic partition of European oaks in a range-wide sampling of 25 individuals (11 Quercus petraea, 13 Q. robur, one Q. ilex as an outgroup). Regions targeted represented broad functional categories potentially involved in species ecological preferences, and a random set of genes. Using a high-quality dedicated pipeline, we provide a detailed characterization of over 14500 polymorphisms, including ~12500 SNPs -218 being triallelic-, over 1500 insertion-deletions, and ~200 novel di- and tri-nucleotide SSR loci. This catalog also includes various summary statistics within and among species, gene ontology information, and standard formats to assist loci choice for genotyping projects. The distribution of nucleotide diversity and differentiation across genic regions are also described for the first time in those species (mean close to ~0.0049 in Q. petraea and to ~0.0045 in Q. robur across random regions, and mean FST ~0.13
across SNPs). Robust patterns were observed which emphasize a slightly but significantly higher diversity in Q. petraea, across a random gene set and in the abiotic stress functional category, and a heterogeneous landscape of both diversity and differentiation. These patterns are discussed in the context of both species documented introgression history despite strong reproductive barriers. The quality, representativity in terms of species genomic diversity, and usefulness of the resources provided are discussed for possible applications in medium scale landscape ecology projects, and as a reference resource for validation purposes in larger-scale re-sequencing projects. These are preferentially recommended in oaks in contrast to SNP array development, given the large nucleotide variation and low levels of linkage disequilibrium revealed.
Introduction
High-throughput (HT) techniques of the next-generation sequencing (NGS) era and increased genome sequencing efforts in the last decade have greatly improved access to genomic resources in non-model forest tree species, but these have only been applied recently to large-scale ecological and population genomics research (Neale and Kremer 2011, Neale et al. 2013; Plomion et al. 2016, Holliday et al. 2017). One notable exception are studies undertaken in the model genus Populus (e.g. Zhou et al. 2014, Geraldes et al. 2014, Christe et
al. 2016b) that benefited from the first genome sequence completed in 2006 in P. trichocarpa
4 (reviewed in Kremer et al. 2012) with recent development of genomic resources (e.g. Faivre-Rampant et al. 2011; Tarkka et al. 2013; Lesur et al. 2015; Lepoittevin et al. 2015, Bodénès
et al. 2016) set the path to very recent release of genome sequences to the research
community (Quercus lobata, Sork et al. 2016; Q. robur, Plomion et al. 2016, 2018; Q. suber, Ramos et al. 2018; Fagus sylvatica, Mishra et al. 2018), and these provide great prospects for future evolutionary genomics studies (Petit et al. 2013; Parent et al. 2015; Cannon et al. 2018; Lesur et al. 2018).
Recently, building from the European oaks genomic resources (Quercus Portal, htpps://arachne.pierroton.inra.fr, and references therein), natural populations of 4 Quercus species (Q. robur, Q. petraea, Q. pyrenaica, Q. pubescens) were genotyped for ~4000 single-nucleotide polymorphisms (SNPs, from an initial 8K infinium array, Lepoittevin et al. 2015). The data were further analysed (Leroy et al. 2017), with results extending previous knowledge on their likely diversification during glacial periods, as well as their recolonization history across Europe and recent secondary contacts (SC) after the last glacial maximum (Hewitt 2000; Petit et al. 2002; Brewer et al. 2002). Using recent model-based inference allowing for heterogeneity of migration rates (Roux et al. 2014; Tine et al. 2014), Leroy et al. (2017) showed that the most strongly supported scenarios for all species pairs included very recent SC, due to a much better fit of the patterns of large heterogeneity of differentiation observed across SNP loci. These recent SC events have been documented in many patchily distributed hybrid zones where current in situ hybridization can occur among European oak species (e.g. Curtu et al. 2007; Jensen et al. 2009; Lepais and Gerber 2011; Guichoux et al. 2013). The resulting low levels of differentiation among Q. robur and Q. petraea in particular is traditionally linked to a model of contrasted colonization dynamics, where the second-in-succession species (Q. petraea) is colonizing populations already occupied by the earlier pioneering Q. robur (Petit et al. 2003). This model predicts asymmetric introgression towards
Q. petraea (see Currat et al. 2008), as often observed in interspecific gene exchanges (Abbott et al. 2003), and a greater diversity in Q. petraea was documented at SNP loci showing higher
differentiation (Guichoux et al. 2013). The directionality of introgression in oaks was also shown to depend on species relative abundance during mating periods (Lepais et al. 2009, 2011).
Nethertheless, oaks like other hybridizing taxa are known for the integration of their species parental gene pools and strong reproductive isolation barriers (Muir et al. 2000; Muir and Schlötterer 2005; Abadie et al. 2012, Lepais et al. 2013; Ortiz-Barrientos and Baack 2014;
5 Christe et al. 2016a), raising essential questions about the interacting roles of divergent (or other types of) selection, gene flow, and recombination rates variation in natural populations, and their imprints on genomic molecular patterns of variation (e.g. Zhang et al. 2016; Christe
et al. 2016b; Payseur and Rieseberg 2016). These issues will be better addressed with
genome-wide sequence data in many samples (Buerkle et al. 2011), which will be facilitated in oaks by integrating the newly available genome sequence of Quercus robur to chosen HT resequencing methods (Jones and Good 2016; e.g. Zhou and Holliday 2012; Lesur et al. 2018 for the first target sequence capture in oaks).
However, obtaining high quality haplotype-based data required for nucleotide diversity estimation and more powerful population genetics inferences will likely require the development of complex bioinformatics pipelines dedicated to high heterozygosity genomes and solid validation methods for polymorphism detection (e.g. Geraldes et al. 2011; Christe et
al. 2016b). Indeed, very stringent filters are often applied in practice to limit error rates and
avoid false-positives, hence limiting the impact of variable read depth and possible ascertainment bias risks, which altogether significantly decrease the number of informative loci compared to either initial fixed amounts (in genotyping arrays, e.g. Lepoittevin et al. 2015) or potential amounts (in reference genomes, e.g. Pina-Martins et al. 2018 in Quercus species; see also Van Dijk et al. 2014).
Therefore, the objectives of this work were first to provide a detailed characterization of sequence variation in Quercus petraea and Quercus robur. To that end, we validated previous unpublished Sanger sequence data for fragments of targeted gene regions in a panel of individuals sampled across a large part of both species geographic range. Both functional and expressional candidate genes potentially involved in species ecological preferences, phenology and host-pathogen interactions were targeted, as well as a reference set of fragments randomly chosen across the last oak unigene (Lesur et al. 2015). These data were
obtained within the framework of the EVOLTREE network activities
(http://www.evoltree.eu/). Second, we aimed at estimating the distributions of differentiation and nucleotide diversity across these targeted gene regions for the first time in those species, and further test the robustness of comparative diversity patterns observed in the context of both species contrasted dynamics and introgression asymmetry. We discuss the quality, representativity and usefulness of the resources provided for medium scale genotyping landscape ecology projects or as a reference resource for validation purposes in larger-scale resequencing projects.
6
Material and methods Sample collection
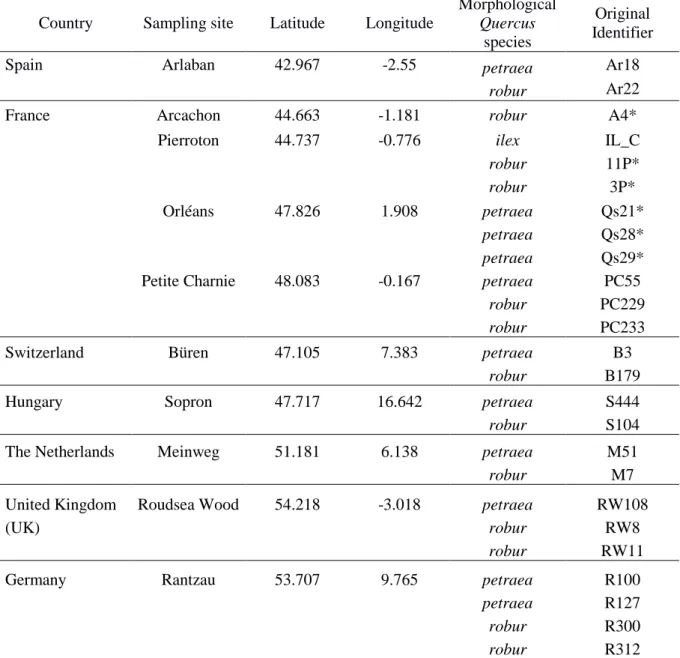
The discovery panel (DiP) included 25 individuals from 11 widespread forest stands with 2 to 4 individuals per location (13 from Q. robur, 11 from Q. petraea, 1 from Q. ilex to serve as outgroup, in Table 1). These stands occur across a large part of both Quercus species natural distributions, spanning ~20° in longitude (~2200 km) and ~11° in latitude (~1250 km) in western and central Europe (Fig. S1, Supporting Information). Individuals were chosen either on the basis of their differing leaf morphology among Q. robur and Q. petraea species (Kremer et al. 2002), or as parents of mapping pedigrees (e.g. Bodénès et al. 2016, see Table 1). Leaves were sampled, stored in silica gel and sent to INRA (Cestas, France) for DNA extraction following Guichoux et al. (2013). DNA quality and concentration were assessed with a Nanodrop spectrophotometer (NanoDrop Technologies, Wilmington, 152 DE, USA) and by separating samples in 1% agarose gels stained with ethidium bromide. Extractions were repeated until we obtained at least 20 micrograms of genomic DNA per sample, which was needed for a few thousands individual PCRs.
Choice of genic regions
Genic regions were chosen from over 103 000 Sanger sequences available in expressed sequence tags (EST) databases at the start of the project. These sequences correspond to 14 cDNA libraries obtained from various tissues and developmental stages (bud, leaf, root and wood-forming tissues), and thus likely to target a large range of expressed genes. Overall, 146 individuals were sampled in 3 different French regions (South-West, East and North-West). We performed the first working assembly for those sequences, with the main aim of avoiding paralog assembly while limiting split contigs with overlapping homolog sequences, the final assembly including 13477 contigs and 74 singletons (Appendices S1 and S2, Fig. S2-A, Supporting information). The libraries used in this assembly have since been named S2-A, B, F to O, and S, and were included in larger transcriptome resources for Quercus species (Ueno
et al. 2010).
In parallel, expressional and functional candidate genes information was compiled for targeting those potentially involved in white oaks‟ local and/or divergent adaptive traits (Fig. S2-B and Table S1, Supporting information). Briefly, model species databases were searched for gene accessions by gene ontology (GO) and metabolic pathways keywords. Those sequences were first Blasted against our oak assembly (Altschul et al. 1990, 1997). Second,
7 the sequences from their best hits were extracted (see filtering criteria in Fig. S2-B, Supporting information) and re-Blasted against the non-redundant protein (NR) database at NCBI. Third, their annotation was compared to those of the initial gene accessions, allowing 95% of hits from the oak assembly to be validated (step 2 in Fig. S2-B, Supporting information). Expressional candidate genes sequences from bud tissues or stress treatment libraries and a random set of ESTs were also directly sampled across the oak assembly generated above (see Table S1, column F, Supporting information). Primers were designed with the OSP software (Hillier and Green 1991) by setting up homogenous melting temperatures constraints and excluding low-complexity propositions. Predicted amplicons were Blasted against each other and onto our assembly to exclude those with potential amplification problems and multiband patterns. They were also checked for their depth and presence of polymorphisms in contigs alignment, yielding finally 2000 amplicons for resequencing (Fig. S2-B, Supporting information).
Data production and polymorphism discovery
All the sequencing work was performed by Beckman Coulter (Agencourt Bioscience Corporation, Beverly, MA, USA) on ABI3730 capillary sequencers (Applied Biosciences) after preparing DNA samples according to the company‟s guidelines. Data quality steps were designed throughout the process in order to maximize the amount and quality of the sequences finally obtained (Fig. 1-A). Forward and reverse sequences were produced for 981 amplicons across 25 individuals (100+881 in steps 2 and 3, Fig. 1-A), and more than 85% of them yielded at least 12 high-quality sequences (Fig. 1-B and column L in Table S1, Supporting information). All amplicon assembly steps, merging, trimming, and filtering/masking based on quality were performed with Bioperl scripts from our SeqQual pipeline, available at https://github.com/garniergere/SeqQual with examples of data and command files. This repository compiles and extends former work dealing with 454 data (Brousseau et al. 2014; El Mujtar et al.2014), providing scripts used here that automatically deal with Sanger haploid or diploid DNA sequences and allow fasta files post-processing in batch (Fig. 1-C). Polymorphism discovery was finally performed on nucleotide data with an error rate below 0.001 (i.e. Phred score above 30, Ewing et al. 1998, and see Appendix S1, Supporting information for more details). Simple sequence repeat (SSR) patterns were further detected or confirmed from consensus sequences using the mreps software (Kolpakov et al. 2003, Fig. 1-D). Various additional steps involving the treatment of insertion-deletion
8 polymorphisms (indels) and heterozygote indels (HI) in particular, allowed missing data from polymorphic diploid sequence to be minimized (see Appendix S1, Supporting information).
Functional annotation
BlastN best hits for our working assembly (orict) original contigs and for the amplified expected fragments (orict-cut) were first retrieved using Lesur et al. (2015)‟ most recent oak assembly (ocv4, see Table S2-C, Supporting information). Consensus of candidate regions originated from both orict and ocv4 (396 and 368 respectively, see Table S2-A, S2-B, and Appendix S1, Supporting information), aiming at retrieving the longest consensus sequences that included the resequenced gene regions, while avoiding to target those with possible chimeric sequences likely different to the regions being successfully resequenced. Functional annotation was then performed via homology transfer using BlastX 2.6.0+ program at NCBI (https://blast.ncbi.nlm.nih.gov/Blast.cgi) with parameters to optimize speed, hits‟ annotation description and GO content (Fig. 1-E and Table-S2, Supporting information). Retrieval of GO terms were performed with Blast2GO (Conesa et al. 2005 free version at
https://www.blast2go.com/blast2go-pro/b2g-register-basic) and validation of targeted annotations with Fisher Exact enrichment tests (Appendix S1, supporting information).
Characterization of diversity and genetic clustering
Using the SNP-stats script for diploid data (see above), simple statistics were computed across different types of polymorphisms (SNPs, indels, SSRs…) including minimum allele frequencies (maf) and heterozygote counts, Chi-square tests probability for Hardy-Weinberg proportions, GST (Nei 1987) and GST’ standardized measure (Hedrick 2005). Complex
polymorphisms (involving HI and/or SSRs) were also further characterized, and data formatted or analyzed using either Arlequin 3.5 (Excoffier and Lischer 2010), SeqQual (e.g. for Arlequin input file with phase unknown, Fig. 1-C), or R scripts. Nucleotide diversity (Nei 1987), based on the average number of pairwise differences between sequences, and its evolutionary variance according to Tajima (1993), were also estimated and compared among species and across candidate genes grouped by broad functional categories (see column F in Table S1, Supporting information), and Weir and Cockerham (1984) FST estimates of
differentiation were computed among species for SNP data along genic regions using analyses of molecular variance (Excoffier 2007).
The initial morphological species samples were compared to the genetic clusters obtained with the STRUCTURE v2.3.3 inference method (Falush et al. 2003) in order to test possible
9 levels of introgression across individuals. We used the admixture model allowing for mixed ancestry and the correlated allele frequencies assumption for closely related populations as recommended defaults, and since they best represent previous knowledge on both species divergence across their range (e.g. Guichoux et al. 2013). Preliminary replicate runs using the same sample of loci produced very low standard deviation across replicates of the data log likelihood given K (ln Pr(X/K), see Fig. S3-A, Supporting information). We thus resampled loci at random for each of 10 replicate datasets in 3 different manners to add genetic stochasticity: 1) one per region, 2) one per 100 bp block, and 3) one per 200 bp block along
genes (see Appendix S1, Supporting information and
https://github.com/garniergere/Reference.Db.SNPs.Quercus/tree/master/STRUCTURE.files
for examples of STRUCTURE files as recommended by Gilbert et al. (2012), along with R scripts for outputs). Statistical independence among loci within each species was verified with Fisher‟s exact tests implemented in Genepop 4.4 (Rousset 2008).
Results
Polymorphisms typology and counts
Among the amplicons tested, 986 were successful, 13 did not produce any data and 23 were excluded because of paralog amplifications (Fig. 1-C and Table S1, Supporting information). Around 25% of the successful amplicons overlapped and were merged, consistently with their original design across contigs. Despite the presence of HI patterns due to SSR or indels, most amplicons were entirely recovered with forward and reverse sequencing. Several (5% of the total) were however kept separate, either because of functional annotation inconsistency, or because amplicon overlap was prevented by the presence of SSRs or putative large introns (see “Final gene region ID” column with -F/-R suffix in Table S1, Supporting information). We finally obtained 852 genic regions covering in total ~529 kilobases (kb), with an average size of 621 bp per region, ranging from 81 to 2009 bp (Table 2, and Appendix S4, Supporting information, for genomic consensus sequences). Compared to the EST-based expected total fragment size of ~ 357 kb, around 187 kb of intron sequence was recovered across 460 resequenced regions (assuming intron presence if an amplicon size was above its expected size by 40 bp). Introns represented ~35% of genic regions in length and ~51% of those including introns.
We observed 14102 polymorphisms in both species across 852 gene regions, 15 of those regions (<2%) being monomorphic (Table 2). This corresponds to 1 polymorphism per ~38 bp, or 1 per ~30 bp when considering the total number of variant positions in both species
10 (17594 bp, Table 2). Remarkably, variant positions involving larger indels, SSRs and mixed complex polymorphism patterns represented ~30% of the total variant positions (Table 2, and see their exhaustive lists with various statistics in Table S3 and S4, Supporting information). We observed 12478 SNPs (88.5% of all polymorphisms), 1 SNP per 42 bp, and 218 triallelic SNPs (~1.75% of SNPs) were confirmed by visual examination of chromatograms. Considering only one species, 1 variant position per ~48 bp, 1 polymorphism per ~60 bp, and 1 SNP per ~68 bp were observed on average. Among indels, 1213 (8.6% of all polymorphisms) were single base, 309 ranged from 2 to 10 bp, and 102 had sizes above 10 bp which were mostly shared among species (Table 2). In this range-wide sample, there were 4334 singletons among all single base polymorphisms and 506 of them were indels. Overall, indels were present in 69% of gene regions and non-single base ones across ~30% of them. Excluding homopolymers (see Appendix S1, Supporting information), we detected 201 SSRs occurring on 163 gene regions by considering a minimum repeat numbers of 4 and a mismatch rate among repeats below 10% (Table 2, Table S1 and Table S5, Supporting information), and 55% (111) were polymorphic in our sample of individuals (Table 2). Among them, 89 (44%) had dinucleotide repeats and 65 (32%) trinucleotide repeats. The SSRs with the lowest number of repeats (<5) had a majority (59%) of repeat sizes between 4 and 7, the rest being trinucleotides (Table S5, Supporting information).
Given the PCR conditions for sequence acquisition and their high similarity a priori, homologous sequence data were obtained for one individual of the outgroup Quercus ilex across 37% of the gene regions (~197 kb, 397 sequences, 676 heterozygous sites in Table 2, Table S1 column Q, and see Appendix S5, Supporting information, for Q. ilex genomic sequences).
Annotations and GO term distributions
BlastX matches with E-values below 10-30 were found for ~97% (738/764) of the contig consensus, only 11 sequences (1.4%) having hits with E-values above 10-10 that were all among the reference random sample (see BlastX criteria in Table S2, Supporting information). The most represented species among the best hits with informative annotations were Prunus persica (111), Theobroma cacao (91), Morus notabilis (57) and Populus
trichocarpa (45) (Appendix S6-A, Supporting information), which probably illustrates both
the close phylogenetic relationships among Quercus and Prunus genera, consistently with results obtained on the larger ocv4 assembly (Lesur et al. 2015), and the quality and availability of P. persica genome annotation (Verde et al. 2013, 2017).
11 Between 1 to 30 GO terms could be assigned to 761 sequences, with EC codes and InterProScan identifiers for 343 and 733 of them respectively (Fig. 1, and Table S2, Supporting information). The most relevant GO terms were then retained using the Blast2GO “annotation rule” (Conesa et al. 2005) that applies filters from the Direct Acyclic Graph (DAG) at different levels (Fig. S4-A- to-F, Supporting information). At biological level (BP) 3, apart from general terms involving “metabolic processes”, a large number of sequences (between ~100 and ~150) were mapped to “response to...” either “...stress”, “...abiotic stimulus” or ”...chemical”, and also to categories linked to developmental processes (Fig. S4-D, Supporting information). Enrichment tests also revealed a significant increase at both BP levels 2 and 3 for the following GO categories: “response to stress” or “external stimulus” for
bud and biotic gene lists, “response to abiotic stimulus” for the bud list, and “immune” and
“biotic stimulus” responses for the biotic list (see Fig. 2-B to 2-D compared to Fig. 2-A, and Fig. S5, Supporting information). Most of these exact tests (>80%) were still significant when selecting genes attributed exclusively to one particular list, which adds to the relevance of our gene lists in targeting particular functional categories.
Species assignment and introgressed individuals
In both species, the proportion of significant association tests among the loci used for clustering (> 2 million within each species) was generally one order of magnitude below the type-I error rates at 5% or 1%. This indicates a very low background LD within species at their range levels, consistently with the underlying model assumptions used in STRUCTURE.
Based on both ln Pr(X/K) and K statistics and as expected, the optimal number of genetic clusters inferred was 2, whatever the number of polymorphisms and type of sampling (Fig. 3, Fig. S3 and S6, Supporting information).
Most individuals (20) clearly belonged to either cluster with a mean probability of cluster assignment above 0.9 , which was not significantly different from 1, based on mean values of 90% Bayesian credible intervals (BCI) bounds across replicates, and for different types of sampling or SNP numbers (Fig. 3 and Fig. S6, Supporting information). Two individuals from Roudsea Wood in UK, the most northerly forest stand of this study, were significantly introgressed, each from a different cluster, with mean probabilities within 0.125 and 0.875. These values can be considered as typical for back-crosses and later-generation hybrids (Guichoux et al. 2013), suggesting a mixed ancestry with the other species a small number of generations in the past. In the initial morphological Q. petraea group, two individuals were clearly of recent mixed ancestry: one from the easternmost forest stand of Sopron (S444), and
12 another one (Qs28) from central France, considered previously to be a Q. petraea parental genotype in two oak mapping pedigrees (Bodénès et al. 2012, 2016; Lepoittevin et al. 2015). However, Qs28 shows here a clear F1 hybrid pattern, given its probability values close to 0.5 and its BCI maximum upper and minimum lower bound values of 0.30 and 0.61 respectively across runs (Fig. 3 and Fig. S6-A to S6-J, Supporting information). Testing 3 or 4 possible clusters showed the same ancestry patterns for the introgressed individuals with 2 main clusters and similar Q-values (data not shown), which does not support alternative hypotheses of introgression from different species in those individuals.
Large heterogeneity of diversity and differentiation across genes
Nucleotide diversity was estimated in each parental species after excluding the 4 most introgressed individuals from each initial morphological group (see above). We then checked how the remaining samples represented species‟ diversity. Starting with one individual, we observe a dramatic drop in the mean proportion of new variant positions brought by each new individual in any species (Mpn) as a function of the initial sample size, followed by a subsequent stabilization (Fig. 4-A, and see Fig. S7-B, Supporting information). Indeed, Mpn was only around 11% when going from 4 to 5 individuals in both species, and stabilized below 5% after 8 individuals in Q. robur (Fig. 4-A). We thus decided to retain 726 gene regions with at least 8 gametes per species (listed in column L in Table S1, Supporting information). The larger Q. robur sample after excluding the most introgressed individuals (24 versus 16 gametes in Q. petraea ) only exhibited slightly higher polymorphism counts than in Q. petraea overall (Table 3). Also, 48% and 52% of the polymorphisms observed were exclusive to Q. petraea and Q. robur respectively in our panel, the rest being shared among species (Table 3). Among exclusive polymorphisms, 46% and 44% were singletons in
Q. petraea and Q. robur respectively, suggesting that they might be either rare in both
species, or more polymorphic in local populations from which few individuals were sampled across the species wider ranges. Overall and within both species, we observed a large variation in number of segregating sites per gene size (Fig. S7-A, Supporting information). The mean nucleotide diversity estimates () across genic regions when considering all polymorphisms were 0.00447 and 0.00425 in Q. petraea and Q. robur respectively, with up to a 10-fold variation among polymorphic genes overall and in different functional categories (Fig. 4-B and Table 3). When including SNPs only, mean decreased overall by more than 10% (Table 3, and see column D in Table S4, Supporting information). The large variation among genes is also illustrated by the absence of significant differences between mean
13 diversity among functional categories within species, in most comparisons using non-parametric Wilcoxon rank sum tests (Wrs) with similar number of genes. Two notable exceptions were observed when considering all polymorphisms: the biotic stress category (358 genes) had on average a lower in Q. petraea than in the random gene list (211 genes,
Wrs Pr<0.042), and the mean of the reproductive phenology category was significantly lower in both species than that of the Bud phenology category (Wrs Pr<0.040 and Pr<0.013 in
Q. petraea and Q. robur respectively, considering exclusive categories from Table S2,
Supporting information). Genes with estimates above 0.02 were found across most categories, whether considering all polymorphisms (Fig. 4-B) or SNPs only. The 8 genic regions showing the highest values in both species were annotated for example as disease resistance, transcription factor or membrane transport proteins, half of them being from the original random list.
Mean comparison tests between species across all gene regions were not significant (Table 3, Wrs Pr>0.15 for all polymorphisms or SNPs only), nor were they across different categories and between gene pairs, using a 95% confidence interval based on Tajima‟s evolutionary variance for (Tajima 1983) while assuming underlying Gaussian distributions. Indeed for the same genic regions, many examples can be found of higher estimates in one species or the other. However, comparing diversity estimates across the exact same positions and performing Wilcoxon paired ranked tests (Wpr) across all genes, there was a significant pattern of a slightly higher diversity in Q. petraea (see Table 3 and Fig. 4-B), whether considering all polymorphisms (Wpr Pr<0.028) or SNPs only (Wpr Pr<0.036). This pattern remained significant across the 211 genes chosen randomly (Wpr Pr<0.037, all polymorphisms), even when excluding the 5% or 10% of genes having the highest values, but it was not robust to considering the other 509 genic regions chosen in functional categories, either together or separately in the different categories (Fig. 4-B), except for the
Abiotic stress category.
We also observed a very large variation for FST estimates across gene regions and functional
categories, which covered the full range of possible values [0,1], with mean values of ~0.13 whether considering all polymorphisms or SNPs only (Fig. 4-C, and Fig. 4-D for the random genic regions and a representative example of one category). The very few segregating sites with FST values at 1 had either missing individuals‟ or strands, possibly caused by
polymorphisms within primer regions. Among the sites sequenced for the full sample of gametes, the 20 highest FST values ranged from 0.6 to 0.9 and belonged to 10 genic regions,
14 many of which also showed null or very low FST values within 100 bp. This large variation in
differentiation was observed between very close variant sites in many genes, suggesting very high recombination rates at genome-wide and range-wide scales, and consistently with the observed very low LD estimates (see above). Additionally, a large variance is expected around FST estimates due to the relatively low sample size in both species, in particular for
bi-allelic loci (Weir and Hill 2002; Buerkle et al. 2011; e.g. Eveno et al. 2008).
Discussion
In the NGS era, non-model tree species such as many Fagaceae still lag behind model species for easy access to sequence polymorphism data (but see Gugger et al. 2016 for Quercus
lobata). These data are needed for larger scale studies addressing the many diversity issues
raised by their combined economic, ecological and conservation interests (Cavender-Bares 2016; Fetter et al. 2017; Holliday et al. 2017). However, recent achievements and data availability from the Q. robur genome sequence project (Plomion et al. 2018) opens a large range of applications in many related temperate and tropical Fagaceae species due to their conserved synteny (Cannon et al. 2018). In this context, we discuss below the representativity of our data in terms of species genomic diversity as well as the robust patterns observed across genes, and further illustrate their past and future usefulness for Quercus species.
Genic resources content, quality, and representativity
We provide a high-quality polymorphism catalog based on Sanger resequencing data for more than 800 gene regions covering ~530 kb, using a discovery panel (DiP) from mixed Q. robur and Q. petraea populations located across a large part of their geographic range. This catalog details functional annotations, previous published information, allele types, frequencies and various summary statistics within and across species, which can assist in choosing novel polymorphic sites (SNPs, SSRs, indels…) for genotyping studies (Tables S1 to S5,
Supporting information, see also
https://github.com/garniergere/Reference.Db.SNPs.Quercus). Among genomic SSRs, more than 90% are new (17 already detected in Durand et al. 2010; 3 in Guichoux et al. 2011), so they constitute an easy source of potentially polymorphic markers in those white oak species.
This catalog corrects and largely extends the SNP list at
https://arachne.pierroton.inra.fr/QuercusPortal (see “Quercus petraea / robur” field) which was previously used to document a SNP diversity surrogate for both Quercus species in the oak genome first public release (Plomion et al. 2016). Standard formats for high-density genotyping arrays and primer information are also provided, making these resources readily
15 operational for medium scale molecular ecology studies while avoiding the burden of bioinformatics work needed for SNP development.
Thanks to a high quality dedicated pipeline, we could perform a quasi-exhaustive characterization of polymorphism types in our DiP and across part of the genic partition of these Quercus species (see Fig. 1). Although base call error rates below 1/1000 were used (as originally developed for Sanger sequencing), most variant sites were located in regions with lower error rates (below 1/10000) so that true singletons could be identified. At the genotypic level, a Sanger genotyping error rate below 1% was previously estimated using a preliminary subset of around 1200 SNPs from this catalog (~5800 data points, Lepoittevin et al. 2015). This rate can be considered as an upper bound for the present study, given all additional validation and error correction steps performed. Although little used now with the advent of NGS methods, Sanger data have served for genome sequencing projects in tree species before 2010 (Neale et al. 2017), and have been instrumental in combination to NGS for BAC clones sequencing, which helped ensuring assembly long-distance contiguity in large genomes such as oaks (Faivre-Rampant et al. 2011, Plomion et al. 2016). Sanger sequencing has often provided reference high-quality data to estimate false discovery or error rates, and validate putative SNPs in larger scale projects (e.g. Geraldes et al. 2011 in Populus trichocarpa; Sonah et al. 2013 in Soybean; Cao et al. 2014 in Prunus persica).
Finding an optimal balance between the number of samples and that of loci is critical when aiming to provide accurate estimates of diversity or differentiation in population genetics studies. Given the increasing availability of markers in non-model species (usually SNPs), it has been shown by simulation (Willing et al. 2012, Hivert et al. 2018) and empirical data (Nazareno et al. 2017) that sample sizes as small as 4 to 6 individuals can be sufficient to infer differentiation when a large number of bi-allelic loci (> 1000) are being used. A broad-scale geographic sampling is however required if the aim is to better infer genetic structure and complex demographic scenarios involving recolonization and range shifts due to past glacial cycles, such as those assumed for many European species (Lascoux and Petit 2010, Keller et al. 2010, Jeffries et al. 2016, Sousa et al. 2014). Our sampling design is likely to have targeted a large part of both species overall diversity and differentiation across the resequenced genic regions. This is first suggested by the small proportion of additional polymorphisms once an initial sample of 8 gametes was included for each species (~10% and decreasing as sample size increases, Fig. 4-A and 7-A). Considering the DiP within each species, each individual brings on average ~166 new variants (~1% of the total). Second, the
16 large variance observed across gene nucleotide diversity estimates (see Table 3) is mostly due to stochastic evolutionary factors rather than to sampling effects so unlikely to be impacted by sample sizes over 10 gametes (Tajima 1983). Also, sampling sites are located in regions which include 4 out of the 5 main cpDNA lineages along white oaks recolonization routes (Petit et al. 2002), so only the less frequent D lineage from South-western Spain might not be represented in our DiP. Therefore, if new populations were being sampled within the geographical range considered, they would likely include many of the alleles here observed within species. Indeed, older and more recent reports showed a low genetic structure and high gene flow among distant populations within each species, and a much larger overall differentiation component than the local one (Bodénès et al. 1997; Mariette et al. 2002; Petit
et al. 2003; Muir and Schlötterer 2005; Derory et al. 2010; Guichoux et al. 2013; Gerber et al.
2014).
We further tested the frequency spectrum representativity of our DiP by comparing genotypes for a subset of 530 SNPs (sanSNP) to those obtained using the Illumina infinium array technology (illuSNP) for ~70 individuals from Southern France local populations (Lepoittevin
et al. 2015, using their Table S3). The illuSNP excluded SNPs showing compressed clusters
(i.e. potential paralogs) and those showing a high number of inconsistencies with control genotypes, as recommended by the authors. For SNPs exclusive to one species in sanSNP, more than 68% of illuSNP showed either the same pattern or one where the alternative allele was at a frequency below 5% in the other species. Less than 8% of those SNPs were common in both species in illuSNP. Similarly, for singletons in sanSNP, more than two-third showed very low to low frequency (<10%) in illuSNP, and only 11% in Q. petraea and 9% in Q.
robur showed a maf above 0.25. This confirmed the singletons reality in our DiP, and also
that some may represent more frequent polymorphisms in local populations. The correlations among maf in both datasets were high and significant (0.66 and 0.68 respectively for Q.
petraea and Q. robur, both Pr< 0.0001). These results suggest a small risk of SNP
ascertainment bias if the new resources were to be used in populations within the geographic distribution surveyed, in contrast to panels with much less individuals (see Lepoittevin et al. 2015 for a discussion on the consequences of such bias in Quercus species).
Overall, we obtained sequence data for 0.072% (~530 kb) of the haploid genome of Q. robur (size of ~740 Mb in Kremer et al. 2007). We also targeted ~3% of the 25808 gene models described in the oak genome sequencing project (www.oakgenome.fr), and around 1% of the gene space in length. Interestingly, both randomly chosen genic regions and those covering
17 different functional categories have been mapped across all linkage groups (columns F and X in Table S1, Supporting information). Due to the absence of observed background LD, their diversity patterns can be considered independent. The genes studied represent a large number of categories, as illustrated by very similar distributions for level 2 GO terms to those obtained with the larger ocv4 assembly (Lesur et al. 2015, comparing their Figure 2 to Fig. 4-A to 4-C, Supporting information).
Diversity magnitude and heterogeneity highlight species integrity and introgression patterns
Using a detailed polymorphism typology, we characterized for the first time in two oak species a high proportion of variant positions (30%) that included 1 bp to medium-sized indels and sequence repeats, compared to the more common and commonly reported SNP loci (Table 2). The proportions of indels observed (11.5% of all polymorphisms) is in the range of results available in model tree species (e.g. 13.8% across the genome in Prunus avium, Shirasawa et al. 2017; 19% in Prunus persica, Cao et al. 2014; a minimum of 1.4% in
Populus trichocarpa, Evans et al. 2014). Although less abundant than SNPs they represent an
important component of nucleotide variation, often have high functional impacts when locating within coding sequences and have been proposed as an easy source of markers for natural populations studies (Väli et al. 2008). Larger-sized indels are also likely to be relatively frequent in intergenic regions of the Quercus genome and have been linked to transposable elements (TE, see the BAC clones overlapping regions analyses in Plomion et al. 2016). Similarly, large indels and copy number variation linked to TE activity were identified as an important component of variation among hybridizing Populus species (Pinosio et al. 2017). Here when considering variant positions involved in complex polymorphisms, we observed 1 variant position per 48 bp on average within species (resp. 1 per 30 bp in both), compared to the 1 SNP per 68 bp statistic (resp. 1 SNP per 42 bp across both species). Also, some of the SNPs observed were located within complex polymorphic regions that would have been classically filtered out, and nucleotide diversity () estimates were higher by 12% when including all polymorphisms (from 0.0038 to 0.0044 if averaging across both species and all genes, Table 3). These nucleotide diversity estimates are provided for the first time in
Q. petraea and Q. robur across a large number genic regions (> 800), compared to previous
candidate genes studies across much smaller numbers (< 10) of gene fragments (Kremer et al. 2012 in Q. petraea; e.g. Homolka et al. 2013). Our estimates are consistent with those obtained from genome-wide data and range-wide panels in angiosperm tree species, available mostly from the model genus Populus (e.g. P. trichocarpa: 1 SNP per 52 bp and ~0.003
18 across genic regions, Zhou and Holliday 2012, Zhou et al. 2014, Evans et al. 2014, Wang et
al. 2016; P. tremula: ~0.008, P. tremuloides:~0.009 across genic regions, Wang et al. 2016; ~0.0026 to 0.0045 in a panel including wild Prunus persica accessions, Cao et al. 2014). These diversity levels are also within the range estimated for the long-term perennial outcrosser category in Chen et al. (2017, see Fig. 1-D with a mean value of silent close to ~0.005) and can be considered relatively high in the plant kingdom if excluding annual outcrosser estimates or intermediate otherwise. In oaks as in many other tree species with similar life history traits, these levels would be consistent with their longevity, large variance in reproductive success and recolonization or introgression histories, which could have maintained deleterious loads of various origins (Zhang et al. 2016, Chen et al. 2017, Christe
et al. 2016b)
Comparing the nucleotide diversity distributions and examining the range of differentiation across genic regions in our Dip reveal several robust patterns that altogether illustrate historical introgression patterns among both Quercus species, which have long been considered as iconic examples of species exhibiting high levels of gene flow (e.g: Petit et al. 2003; Arnold 2006), despite more recent evidence of strong reproductive barriers (Abadie et
al. 2012). What has been referred to as “strong species integration” seems nevertheless clearer
in our Dip for Q. robur than for Q. petraea, according to genetic clustering inference without any a priori. Three individuals (27%) considered as typical morphological Q. petraea adults (Kremer et al 2002) showed significant levels of introgression (Fig. 3). In contrast, only one
Q. robur based on morphology was introgressed to a level matching the least introgressed Q. petraea individual. Discussing species delimitation, Guichoux et al. (2013) also showed more
robustness in assigning morphological Q. robur individuals to their genetic cluster, illustrating an asymmetry in their introgression levels. We note that among our Dip individuals, Qs28, one parent from two mapping pedigrees (Bodénès et al. 2016) is a clear F1 hybrid among both species (Fig. 3), making those pedigrees two back-crosses instead of one cross within species and one between species.
Moreover, after excluding the four most introgressed individuals, nucleotide diversity in Q.
petraea was significantly higher (by ~5% on average) than in Q. robur. This effect is small,
detectable only with Wilcoxon paired ranked tests, mostly across the same ~200 regions sampled randomly and in the Abiotic stress category, despite the very large diversity variance across regions, and robust to excluding the highest diversity values. We also sequentially removed the three individuals with the lowest Q-values from the Q. petraea cluster (Fig. 3),
19 since they could still harbor residual heterozygosity due to recent back-crossing events and generate the pattern observed. Remarkably, the same significant patterns of higher diversity in
Q. petraea were observed. Therefore, with 8 to 10 gametes in Q. petraea instead of 8 to 24
gametes in Q. robur, and with twice less natural stands sampled, the nucleotide diversity in Q.
petraea was still slightly and significantly higher than in Q. robur (Pr<0.011 and Pr<0.026,
using all polymorphisms or SNPs only respectively). Although range-wide population structure within species could differentially affect both species global diversity across our
Dip, published results show that these are very small (~1% across SNPs) and similar
(Guichoux et al. 2013). The main hypotheses developed so far to explain this difference in species diversity pattern relate to their disparities in life-history strategies for colonizing new stands and associated predictions (Petit et al. 2003, Guichoux et al. 2013). The colonization dynamics model and patterns observed also assumes very similar effective population sizes in both species, which is a reasonable assumption due to their shared past history and the strong introgression impact at the genomic level. However, given increasing and recent evidence of pervasive effects of different types of selection across genic regions with HT data (e.g. Zhang
et al. 2016; Christe et al. 2016b in Populus; Chen et al 2017 for long-term perennials),
alternative (and non-exclusive) hypotheses worth considering are ones of a higher genome-wide impact of selective constraints in Q. robur (Gillespie 2000; Hahn 2008; Cutter and Payseur 2013; Kern and Hahn 2018; e.g. Grivet et al. 2017). Since Q. robur is the most pioneering species, it has likely been submitted to very strong environmental pressures at the time of stand establishment. Selection might be efficient given oak tree reproductive capacities across a large number of genes involved in abiotic and biotic responses. This would be consistent with significantly lower levels of He in Q. robur for genes that were specifically enriched for abiotic stress GO terms (Guichoux et al. 2013, see their Table S5). Redoing here the same tests across a larger number of independent SNPs (> 1000), whether comparing Nei‟s unbiaised locus diversity (He) or the mean He within regions among species, Q. petraea systematically showed the same trend of a slightly higher diversity overall, and significantly so only for the Abiotic stress category (Pr<0.01) and for a similar outlier SNP category (FST
>0.4, mean He>0.15, Pr<0.001) than in Guichoux et al. (2013). In summary, the absence of the same pattern in any other functional categories might suggest that these are too broad in terms of corresponding biological pathways, hence mixing possible selection signals of opposite effects among species, while we still detect an overall effect due to linked selection on a random set of genes, and on genes involved in abiotic stress. More analyses comparing the nucleotide diversity patterns at genes involved in both species relevant biosynthesis
20 pathways for ecological preferences (e.g. Porth et al. 2005; Le Provost et al. 2012, 2016) are clearly needed in replicated populations, for example to estimate the distribution and direction of selection effects and putative fitness impact across polymorphic sites (Stoletzki and EyreWalker 2011), or to study the interplay between different types of selection and variation in local recombination rates on both diversity and differentiation patterns (Payseur and Rieseberg 2016).
A large proportion of shared polymorphic sites (~50% in any species) highlights the close proximity of species at genomic level, consistently with a low mean differentiation across polymorphic sites (FST~0.13, Fig. 4-C), and despite the very large heterogeneity observed
across differentiation estimates. This has now been classically interpreted (and modeled) as reflecting a strong variance in migration and introgression rates, in oaks in particular (Leroy et
al. 2017), with islands of differentiation assumed to represent regions resistant to
introgression. However, interpretations of such patterns remain controversial and multiple processes might be involved and worth exploring further in oaks, such as the effects of heterogeneous selection (both positive and background) at linked loci (Cruickshank and Hahn 2014; Wolf and Ellegren 2017). These effects could be particularly visible in low-recombination regions (Ortiz-Barrientos et al. 2016), and would further interact with the mutational and recombination landscapes during the course of speciation (Ortiz-Barrientos and James 2017) and during their complex demographic history.
Applications and usefulness as reference data
During this project, several studies valued part of these resources, hence illustrating their usefulness. For example, good quality homologous sequences were also obtained for ~50 % of the gene fragments in one individual of Quercus ilex. This species is more distant to both
Q. petraea and Q. robur, belonging to a different section, so these data guided the choice of
nuclear genes for better inferring phylogenetic relationships across 108 oak species (Hubert et
al. 2014). Bioinformatics tools and candidate genes annotated during the project were also
useful to similar genes and SNP discovery approach in Quercus or more distant Fagaceae species (Rellstab et al. 2016, Lalagüe et al. 2014 in Fagus sylvatica, El Mujtar et al. 2014 in
Nothofagus species). Given the low ascertainment bias and good conversion rate expected
within the range surveyed, those genomic resources would be directly applicable to landscape genomics studies at various spatial scales (reviewed in Fetter et al. 2017) in both Quercus species. Indeed, easy filtering on SNP statistics provided in the catalog would allow distinguishing among different classes of SNPs (e.g. exclusive to each species, common and
21 shared by both, linked to particular GO functional categories), or delimiting and tracing species in parentage analyses and conservation studies (e.g. Guichoux et al. 2013; Blanc-Jolivet et al. 2015), or improving estimates of lifetime reproductive success and aiming to understand how demographic history and ecological drivers of selection affect spatial patterns of diversity or isolating barriers (Andrew et al. 2013; e.g. Geraldes et al. 2014). This type of spatial studies are rare in the target species, usually included a small number of SSR markers, and all suggested complexity in geographical patterns of genetic variation and importance of the ecological context (e.g Neophytou et al. 2010; Lagache et al. 2014; Klein et al. 2017, Beatty et al. 2016 for local or regional studies; Muir and Schlötterer 2005; Gerber et al. 2014, Porth et al. 2016 for range-wide studies). Their power and scope would likely be greatly improved by using medium-scale genotyping dataset including a few thousands SNPs such as those described in our study.
The robust patterns described above of differentiation heterogeneity and consistent differences in diversity magnitude among species call for more studies at both spatial and genomic scales for unraveling these species evolutionary history, in particular regarding the timing, tempo, dynamics and genetic basis of divergence and introgression. Practically in oaks, genome complexity reduction methods such as RAD-seq and similar approaches (e.g. Elshire et al. 2011) might be fairly limiting for the research questions mentioned above (Arnold et al. 2013; Henning et al. 2014; Zhou and Holliday 2012), especially given the large variance in nucleotide diversity and low overall differentiation characterized here. We therefore do not recommend the development of a very large SNP array in oaks since it is likely to be very costly for a minimal return, especially given the very large and range-wide panel that would be needed to significantly limit ascertainment bias (see Lepoittevin et al. 2015). Also the very high SNP density required for targeting of functional variants given low overall levels of LD (indicating potentially high recombination rates), would be technically constrained when controlling for genotyping error rates (shown previously to be high). Indeed, these rates would probably be stronger for high diversity, complex, duplicate or multiple copy genic regions (observed in this study Table S1, supporting information, and shown recently to have evolutionary impact on the Q. robur genome structure, Plomion et al. 2018), preventing them even to be targeted. In contrast, targeted sequence capture (TSC) strategies for resequencing (Jones and Good 2016), although still uncommon in forest tree species evolutionary studies, might be most useful and efficient since they can be oriented towards recovering long genomic fragments and thus allow more powerful site frequency
22 spectrum and haplotype-based inferences to be pursued (e.g. Zhou et al. 2014; Wang et al. 2016), at the same time avoiding most of the above technical issues. TSC approaches will surely be encouraged and tailored to specific evolutionary research questions in oaks in the next decade, given the new Q. robur genome sequence availability (Plomion et al. 2018; Lesur et al. 2018 for the first TSC in oaks). However, the bioinformatics pipelines needed for validating haplotype-based or quality data for population genetics inferences also need constant reassessment according to research questions and chosen technology.
We thus propose, in addition to direct applications to landscape genetics (detailed above) and transferability to other Quercus species (see Chen et al. 2016, and primer information in Table S1, Supporting information), that the high-quality data characterized in this study serve as a reference for such validation purposes. They could not only help for adjusting parameters of the chosen pipelines for data outputs, but also allow estimating genotyping error rates for SNP and more complex classes of variants, either from general patterns comparisons (e.g maf distribution from Tables S3, S4 Supporting information) or using the same control individuals maintained in common garden that could be included in larger-scale studies. Such a reference catalog of SNPs and other types of polymorphisms within gene fragments could also be very useful for solid cross-validation of variants identification, allele frequency and other derived summary statistics in alternative strategies such as Pool-Seq, which allow increasing genomic coverage while sampling cost-effectively by pooling individuals (Schlötterer et al. 2014). Indeed, the drawback of these approaches, despite dedicated software (PoPoolation2, Kofler
et al. 2011) is that they can give strongly biaised estimates, or ones that do not consider
evolutionary sampling (Hivert et al. 2018). Therefore, they require further validation methods which usually value previously developed high-quality and lower-scale data (e.g. Pool-Seq
versus Sanger and Rad-Seq in Christe et al. 2016b; Illumina GA2 versus Sanger in Cao et al.
2014; EUChip60K versus deep-whole genome resequencing in Silva-Junior et al. 2015). Finally such a reference dataset would help optimizing the amount of available data from either TSC or whole-genome resequencing experiments in future research challenges.
Data Accessibility
Original assembly used for selecting contigs is in Appendix S2 (Supporting information). For Sanger trace files (with data on at least 2 individuals), see the Dryad repository (doi:10.5061/dryad.h380d51). Consensus sequences are respectively in Supporting information appendices S1 (used to design primers), S5 (used for functional annotation), and S6 (genomic sequences obtained). Tables S1 and S2 correct and extend and the oak Candidate
23
Genes Database of the Quercus Portal (
www.evoltree.eu/index.php/e-recources/databases/candidate-genes). SNPs, indels and SSRs catalogs and positions within genomic consensus sequences, and ready-to-use format for genotyping essays are provided in Tables S3 to S5 (Supporting information). SNP data correct and largely expand part of the SNP database of the Quercus Portal (www.evoltree.eu/index.php/snp-db/, “Quercus petraea /
robur” field).
Bioperl scripts from the SeqQual pipeline are given at
https://github.com/garniergere/SeqQual, example of parameter files and scripts for
STRUCTURE analyses and parsing MREPS software are given at
https://github.com/garniergere/Reference.Db.SNPs.Quercus
Acknowledgments
The authors thank Alexis Ducousso, Jean-Marc Louvet, Guy Roussel, Pablo Goicoecha, Hervé le Bouler, Félix Gugerli, Csaba Matyas, Sandor Bordacs, Hans P. Koelewijn, Joukje Buiteveld, Stephen Cavers, Bernd Degen and Jutta Buschbom for choosing trees and providing dried leaves of individuals from various Intensive Study Populations of previous European projects populations. We are grateful to H. Lalagüe, G. Vendramin, I. Scotti, and L. Brousseau for testing earlier scripts of SeqQual and to I. Lesur for help in using the ocv4 oak resources. The sequencing work was funded by the EVOLTREE network of Excellence (EU contract n°016322). TL post-doc fellowship was funded by the ANR TRANSBIODIV (06-BDIV-003-04) and LINKTREE (contract n°2008-966). TD salary was funded by the ANR REALTIME (N°59000256). Computing facilities of the Mésocentre de calcul Intensif Aquitain des Universités de Bordeaux, de Pau et des Pays de l‟Adour are thanked for providing computer time for this study. We also thank Rémy Petit for funding part of TL fellowship and support in developing SeqQual tools. PA received a Ph.D. grant (2009-2011) from the « Ministère de l‟Education Nationale, de l‟Enseignement Supérieur et de la Recherche » of France, and additional funding from EVOLTREE.
References
Abadie P, Roussel G, Dencausse B, et al. (2012) Strength, diversity and plasticity of postmating reproductive barriers between two hybridizing oak species (Quercus robur L. and
24 Abbott RJ, James JK, Milne RI, Gillies ACM (2003) Plant introductions, hybridization and gene flow. Philosophical Transactions of the Royal Society of London B: Biological Sciences,
358, 1123–1132.
Altschul SF, Gish W, Miller W, Myers EW, Lipman DJ (1990) Basic local alignment search tool. Journal of Molecular Biology, 215, 403–410.
Altschul SF, Madden TL, Schaffer AA, Zhang J, Zhang Z, Miller W, Lipman DJ (1997) Gapped BLAST and PSI-BLAST: a new generation of protein database search programs.
Nucleic Acids Research, 25, 3389-3402.
Andrew RL, Bernatchez L, Bonin A et al. (2013) A road map for molecular ecology.
Molecular Ecology, 22, 2605–2626.
Arnold ML (2006) Evolution through genetic exchange. Oxford University Press, Oxford. Beatty GE, Montgommery WI, Spaans F, Tosh DG, Provan J (2016) Pure species in a continuum of genetic and morphological variation: sympatric oaks at the edge of their range.
Annals of Botany, 117, 541-549.
Blanc-Jolivet C, Liesebach M (2015) Tracing the origin and species identity of Quercus robur and Quercus petraea in Europe: a review. Silvae Genetica 64(4), 182–193.Bodénès C, Labbe T, Pradère S, Kremer A (1997) General vs. local differentiation between two closely related white oak species. Molecular Ecology, 6: 713-724.
Bodénès C, Chancerel E, Ehrenmann F, Kremer A, Plomion C (2016) High-density linkage mapping and distribution of segregation distorsion regions in the oak genome. DNA Research,
23, 115-124.
Bodénès C, Chancerel E, Gailing O, et al. (2012) Comparative mapping in the Fagaceae and beyond with EST-SSRs. BMC Plant Biology, 12, 153.
Bodénès C, Chancerel E, Murat F, et al. (2012) Comparative mapping in the Fagaceae and beyond using EST-SSRs. BMC Plant Biology, 12, 153.
Branca A, Paape TD, Zhou P, et al. (2011) Whole-genome nucleotide diversity, recombination, and linkage disequilibrium in the model legume Medicago truncatula. Proc.
Natl. Acad. Sci. USA, 108, E864–E870.
Brewer S, Cheddadi R, De Beaulieu JL, Reille M, Data contributors (2002) The spread of deciduous Quercus throughout Europe since the last glacial period. Forest Ecology and
Management, 156, 27–48.
Brousseau L, Tinaut A, Duret C, et al. (2014) High-throughput transcriptome sequencing and preliminary functional analysis in four neotropical tree species. BMC Genomics, 15, 238.
25 Buerkle CA, Gompert Z, Parchman TL (2011) The n=1 constraint in population genomics.
Molecular Ecology, 20, 1575–1581.
Cannon CH, Brendel O, Deng M et al. (2018) Gaining a global perspective on Fagaceae genomic diversification and adaptation. New Phytologist, 218, 894-897.
Cao K, Zheng Z, Wang L et al. (2014) Comparative population genomics reveals the domestication history of the peach, Prunus persica, and human influences on perennial fruit crops. Genome Biology, 15, 415.
Casasoli M, Derory J, Morera-Dutrey C, et al. (2006) Comparison of QTLs for adaptive traits between oak and chestnut based on an EST consensus map. Genetics, 172, 533–546.
Cavender-Bares J (2016) Diversity, distributions, and ecosystem services of the North-American oaks. International oaks, 27, 37-48.
Chen J, Glémin S, Lascoux M (2017) Genetic diversity and the efficacy of purifying selection across plant and animal species. Molecular Biology and Evolution, 34, 1417–1428.
Chen J, Zeng Y-F, Liao W-J et al. (2016) A novel set of single-copy nuclear gene markers in white oak and implications for species delimitation. Tree Genetics & Genomes, 13, 50.
Christe C, Stolting KN, Bresadola L, et al. (2016a) Selection against recombinant hybrids maintains reproductive isolation in hybridizing Populus species despite F1 fertility and recurrent gene flow. Molecular Ecology, 25, 2482–2498.
Christe C, Stölting KN, Paris M, et al. (2016b) Adaptive evolution and segregating load contribute to the genomic landscape of divergence in two tree species connected by episodic gene flow. Molecular Ecology, 26, 59-76.
Conesa A, Götz S, Garcia-Gomez JM, et al. (2005) Blast2GO: a universal tool for annotation, visualization and analysis in functional genomics research. Bioinformatics, 21(18), 3674– 3676.
Cruickshank TE, Hahn MW (2014) Reanalysis suggests that genomic islands of speciation are due to reduced diversity, not reduced gene flow. Molecular Ecology, 23, 3133–3157.
Currat M, Ruedi M, Petit RJ, Excoffier L (2008) The hidden side of invasions: massive introgression by local genes. Evolution, 62, 1908–1920.
Curtu AL, Gailing O, Finkeldey R (2007) Evidence for hybridization and introgression within a species-rich oak (Quercus spp.) community. BMC Evolutionary Biology, 7, 218.
Cutter AD, Payseur BA (2013) Genomic signatures of selection at linked sites: unifying the disparity among species. Nature Reviews Genetics, 14, 262–274.