HAL Id: hal-01791639
https://hal.archives-ouvertes.fr/hal-01791639
Submitted on 15 Apr 2019
HAL is a multi-disciplinary open access
archive for the deposit and dissemination of
sci-entific research documents, whether they are
pub-lished or not. The documents may come from
teaching and research institutions in France or
abroad, or from public or private research centers.
L’archive ouverte pluridisciplinaire HAL, est
destinée au dépôt et à la diffusion de documents
scientifiques de niveau recherche, publiés ou non,
émanant des établissements d’enseignement et de
recherche français ou étrangers, des laboratoires
publics ou privés.
Nicolino-Brunet, Pascal Alexandre Thomas, Laurent Papazian, Francoise
Dignat-George, Martine Reynaud-Gaubert
To cite this version:
Benjamin Coiffard, Matthieu Pelardy, Anderson D. Loundou, Corine Nicolino-Brunet, Pascal
Alexan-dre Thomas, et al.. Effect of Immunosuppression on Target Blood Immune Cells Within 1 Year After
Lung Transplantation: Influence of Age on T Lymphocytes. Annals of Transplantation, Springer
Verlag (Germany), 2018, 23, pp.11-24. �10.12659/AOT.906372�. �hal-01791639�
Accepted: 2017.09.11 Published: 2018.01.05
Effect of Immunosuppression on Target
Blood Immune Cells Within 1 Year After
Lung Transplantation: Influence of Age on
T Lymphocytes
ABCDEF 1,2
Benjamin Coiffard
AB 3Matthieu Pelardy
C 4
Anderson D. Loundou
ABD 3Corine Nicolino-Brunet
DE 5
Pascal Alexandre Thomas
DE 2,6Laurent Papazian
DE 3,7
Françoise Dignat-George
ABDEF 1,2Martine Reynaud-Gaubert
Corresponding Author: Benjamin Coiffard, e-mail: bcoiffard.aphm@gmail.com Source of support: Departmental sources
Background: Lymphocytes are targeted by immunosuppressive therapy in solid organ transplantation and they influence al-lograft outcome.
Material/Methods: Peripheral blood lymphocyte subsets (PBLS) determined by flow cytometry during the first year post-transplant from patients who underwent a first lung transplantation in a French University Hospital between December 2011 and July 2013 were retrospectively analyzed according to recipient characteristics and allograft outcome.
Results: Fifty-seven recipients were enrolled and 890 PBLS were collected. T lymphocytes and NK cells were rapidly de-creased, below normal range, from the first postoperative days. B cells decreased more gradually, remaining within normal range, with the lowest level reached after day 100. In multivariate analysis, greater T lymphope-nia was found in older recipients (–414 [–709 to –119] cells/µL, p=0.007). According to the outcome, multivar-iate analysis evidenced lower levels of lymphocytes when bacterial and viral infection occurred (–177 [–310 to –44] cells/µL, p=0.009 and (–601 [–984 to –218] cells/µL, p=0.002, respectively), higher CD8+ T lymphocytes with BOS (+324 [+94 to +553] cells/µL, p=0.006), and higher leukocytes with restrictive allograft syndrome (+3770 [+418 to +7122] cells/µL, p=0.028).
Conclusions: Aging is associated in our cohort with more severe T lymphopenia after induction therapy for lung transplanta-tion. The analysis of leukocytes and PBLS is associated with specific profile according to the allograft outcome.
MeSH Keywords: Aging • Graft Rejection • Lung Transplantation • Lymphocyte Subsets • Opportunistic Infections Full-text PDF: https://www.annalsoftransplantation.com/abstract/index/idArt/906372 Authors’ Contribution: Study Design A Data Collection B Statistical Analysis C Data Interpretation D Manuscript Preparation E Literature Search F Funds Collection G
1 Department of Respiratory Medicine and Lung Transplantation, Hosital Nord, Marseille, France
2 URMITE CNRS IRD UMR 6236, Aix-Marseille University, Marseille, France 3 Laboratory of Hematology and Vascular Biology, Hospital La Conception,
Marseille, France
4 Department of Public Health, Aix-Marseille University, Marseille, France 5 Department of Thoracic Surgery, Hospital Nord, Marseille, France 6 Respiratory Intensive Care Unit, Hospital Nord, Marseille, France 7 VRCM, UMR-S1076 INSERM, Aix-Marseille University, Marseille, France
Background
Despite recent advances in management of immunosuppressive regimens after solid organ transplantation, with a specific focus on T lymphocytes as a target cell of immunosuppressive ther-apy [1], there is little data on analysis of peripheral blood lym-phocyte subsets (PBLS) in such context and particularly in lung transplantation (LTx). PBLS are easily assessed at the bedside to evaluate the immune status. The balance between over- and un-der-immunosuppression, with the dual risk of the occurrence of opportunistic infection on one side, and that of allograft rejec-tion on the other, is sometimes difficult to achieve, with inter-variability from one patient to another. Thus, PBLS might be a valuable biomarker to appreciate the individual level of induced immunodeficiency, but to date there are no guidelines for such monitoring. In our practice, PBLS analysis generally looks at the distribution of the T lymphocytes (CD4+ and CD8+), B lympho-cytes, and NK cells. In solid organ transplantation, the focus has been on CD4+ T cell count as a marker of the immunosup-pression level, permitting the detection of recipients at risk of subsequent opportunistic infections (OI) [2,3]. A strong associ-ation has recently been demonstrated between nadir CD4+ T cell count <200 cells/µl and subsequent cumulative incidence of viral infections in a series of LTx [4]. Other blood lymphocyte subsets have been neglected in the monitoring of transplant-ed solid organs. Regarding NK cells, some studies suggest the association between high levels of NK cells and/or NK cell acti-vation and acute rejection (AR) and/or subsequent chronic lung allograft dysfunction (CLAD) [5,6]. In parallel, other authors have shown that NK cell depletion was associated with cytomegalo-virus (CMV) infection in a lung transplant cohort [7]. However, this data is supported by little case evidence. Regarding B cells, there is no relevant data about the quantitative kinetics in LTx, but interest is growing, especially through the aspect of donor-specific antibodies production [8–10].
Finally, patient characteristics (e.g., age, sex, and underlying dis-ease) known to impact survival after LTx are also very important factors affecting immune responses, susceptibility to infections, and response to vaccination [11,12]. Thus, the objectives of our study were to evaluate the influence of immunosuppressive reg-imen on the kinetics of all blood lymphocyte subsets measured in our center within the first year after lung transplantation ac-cording to recipient characteristics, and to assess the link be-tween PBLS count and the allograft outcome (OI and AR/CLAD).
Material and Methods
Study population
All consecutive adult patients who underwent a first LTx be-tween December 2011 and July 2013 at the Lung Transplant
Center of Marseille (Aix-Marseille University, France) with at least 1-year follow-up in our center were enrolled in this ret-rospective study. Patients who underwent redo LTx or who died before 1 year were excluded from the analysis. Written informed consent was obtained from all patients prior to LTx with authorization to use all the medical data recorded through their conventional LTx monitoring.
Study design
All PBLS samples monitoring, including PBLS performed before LTx (up to 3 months before LTx) and those throughout the fol-low-up until 1 year post-LTx were retrospectively collected. In our clinical practice, PBLS are routinely assessed in monitor-ing, once a week during the first stay of hospitalization and at each outpatient visit (at least monthly in the first year). For each PBLS monitoring, data on concomitant OI (bacterial, vi-ral, fungal, CMV reactivation) and immunological events (pres-ence of donor-specific antibodies (DSA) class I or II, AR and CLAD) were recorded. All data were extracted from our digi-tized institutional database.
Immune status assessment and lymphocyte subsets
Leukocyte and lymphocyte counts were obtained from hema-tological laboratory reports (ADVIA hematology analyzer, Bayer, Leverkusen, Germany). Lymphocyte subpopulation counts were characterized by flow cytometry as follow: in the total lym-phocytes gate (CD45intermediate, side scatterlow), we
subsequent-ly separated into T cells (CD3+CD19–), B cells (CD3–CD19+), and
NK cells (CD16/CD56+), and in the T cells gate, helper T cells
(CD4+CD8–) and cytotoxic T cells (CD4–CD8+) (Supplementary
Figure 1). Phenotyping was performed from whole blood (50 µL). Tubes were prepared with the COULTER® TQ-Prep
sys-tem (Beckman Coulter, Marseille, France), which included a red blood lyse. Whole blood was stained with 10 μL of each anti-body (Beckman Coulter) for 15 min, including anti-CD45 FITC (fluorescein), clone B3821F4A; anti-CD3-PC5 (phycoerythrin-cyanin 5), clone UCHT1; anti-CD4-RD1 (rhodamine), clone T4; anti-CD8-ECD (phycoerythrin-Texas Red), clone T8; anti-CD19-ECD, clone J4-119; anti-CD16-PE (phycoerythrin), clone 3G8 and anti-CD56-RD1, clone N901. Determination of PBLS was performed with a Navios flow cytometer (Beckman Coulter), and data were analyzed directly on the acquisition software. The normal reference values (lower threshold) of cell counts used in the study arises from anterior published data of healthy adult cohorts: leukocyte=4000 cell/µL, lymphocytes=1350 cell/µL, T cells=814 cell/µL, CD4+ T cells=388 cell/µL, CD8+ T cells=171 cell/µL, CD4+/CD8+ ratio=1.4, B cells=72 cell/µL, NK cells=60 cell/µL [13,14].
Immunosuppressive and anti-infectious prophylaxis regimens
In the study period, all recipients received a standardized im-munosuppressive regimen based on published data [15–17] and in accordance with our institutional protocol. Induction thera-py consisted of intravenous administration of 1.5 mg/kg/day rabbit anti-thymocyte globulins (ATG) (Institut Pasteur Mérieux, Lyon, France) given for the first 3 postoperative days, associ-ated with high-dose methylprednisolone (6 mg/kg/d on day 1, 2 mg/kg/d on day 2 and day 3, and 1 mg/kg/d thereafter); in-travenous cyclosporine was administered immediately after LTx (to obtain a steady-state serum concentration between 300 and 400 ng/ml) and was switched by oral tacrolimus as soon as pos-sible (to maintain trough blood levels between 12 and 15 ng/ml during the first 3 months and around 10–12 ng/ml thereafter). Standard triple maintenance immunosuppressive regimen con-sisted of tacrolimus, mycophenolate mofetil, and steroids (pred-nisone) tapered to 0.25 mg/kg/day over the first 3 months and stopped, when possible, at around 12 months after surgery. Postoperatively, transplant recipients received a prophylactic antibiotic treatment according to their preoperative and/or concomitant infectious status for at least 14 days. Seropositive CMV recipients received prophylactic IV ganciclovir or oral val-ganciclovir when available for the first 2 postoperative weeks. Higher-risk CMV-mismatched recipients (D+/R-) were treated for the first 3 months.
Allograft complications
Opportunistic infections were defined by the combination of a systemic inflammatory response syndrome, presence of clini-cal symptoms of infection, and requirement of anti-infectious treatment. Specifically, bacterial infections were defined as any pulmonary, extra-pulmonary, or blood clinically suspect-ed infections (with or without microbiological identification). Viral infections were defined by the presence of clinical respi-ratory symptoms and viral DNA in sputum, bronchial aspira-tion, and/or broncho-alveolar lavage samples, determined us-ing quantitative real-time polymerase chain reaction (PCR) for myxovirus influenzae, respiratory syncytial virus, metapneumo-virus, or rhinovirus. CMV reactivation was defined by a posi-tive blood PCR assay (>500 copies/mL) associated with pp65 antigenemia (at least 1 cell per 200 000). All recipients were screened weekly for CMV reactivation for the first 3 months, monthly thereafter, and when clinically suspected. Fungal in-fections were defined as localized or invasive bronchopulmo-nary filamentous fungi infections.
Acute rejection (AR) was characterized by histological abnor-malities on trans-bronchial biopsies, according to the interna-tional standardized criteria [18]. Episodes of AR were treated
with intravenous methylprednisolone (5 mg/kg/d for 3 con-secutive days) and then rapidly reduced.
CLAD were defined according to the standardized diagnosis cri-teria and the new classification system, separating the 2 phe-notypes [19,20]: 1. Bronchiolitis obliterans syndrome (BOS) was supported by a sustained decline (2 measurements at least 3 weeks apart) in FEV1 of ³20% from the recipient’s best post-transplant values, associated with obstructive syndrome (based on FEV1/FVC ratio <0.7). As recommended, recipients who ex-perienced the diagnosis of BOS were treated earlier with daily 250 mg azithromycin [19–21]. 2. Restrictive allograft syndrome (RAS) was defined as persistent decline (2 measurements at least 3 weeks apart) in FVC and total lung capacity accompa-nied by a decline in FEV1 of >20%, while the FEV1/FVC ratio remains normal or increases above the normal range.
Statistical analysis
Primary lung disease, sex, and age groups (2 groups separat-ed by the mseparat-edian for age) were first evaluatseparat-ed as potential factors influencing PBLS kinetics. Then, associations between PBLS counts and allograft outcome at each time point were as-sessed to detect specific immune profile according to the out-come. In this first part, the analysis was performed with the linear mixed model. A linear mixed model is a statistical mod-el containing both fixed effects and random effects. The recip-ient individuals were considered as random effects to assumed that repeated measures from the same subject are not inde-pendent of one another. The model assumes that intercepts and slopes of different subjects may vary randomly depend-ing on the subject. A difference (beta) between groups with confidence interval is thus obtained, which represents a glob-al estimation of the difference between groups over the study period (the first year in our study) integrating the dependen-cy of the repeated measures in the same individual. We used an unstructured covariance as the default strategy for analyz-ing these longitudinal data, which assumes a nonspecific cor-relation among measurements. Analysis was performed only on post-transplant PBLS. Multivariate analysis was performed for variables with univariate p-values <0.2.
The linear dependence between 2 continuous variables was assessed using the Pearson’s correlation test. The ROC curves analysis of repeated measures was performed using R soft-ware (v.3.1.2) with the repeatedMeasuresROC function de-signed by Taylor Andrew; area under the curve (AUC) boot-strap confidence interval based on 100 bootboot-strap replicates were calculated with the package «boot». Figures were creat-ed using R software with the package «ggplot2» (Bioconductor software suite). Due to personalized monitoring, each PBLS count was performed at random times. Thus, kinetics of ab-solute PBLS counts were graphically represented by the loess
method (local polynomial regression fitting) to obtain curves which represent the smoothed mean with confidence inter-val over time. The other statistical analyses were undertaken using IBM SPSS Statistics version 17 (IBM SPSS Inc., Chicago, Illinois, USA). For all tests, the statistical significance was de-fined as p value <0.05.
Results
Patient characteristics
Sixty-nine consecutive LTx procedures were performed during the study period in our center. Twelve recipients were excluded from analysis. A total of 57 LTx were enrolled in the study: 14 cases of cystic fibroses, 23 cases of pulmonary fibroses, and
20 cases of emphysema. The median age was 48 [38–56] years (Table 1). In this cohort, a total of 890 PBLS monitorings were performed before transplant and within the first year post-transplantation, with a median of 19 [14–23] PBLS per patient.
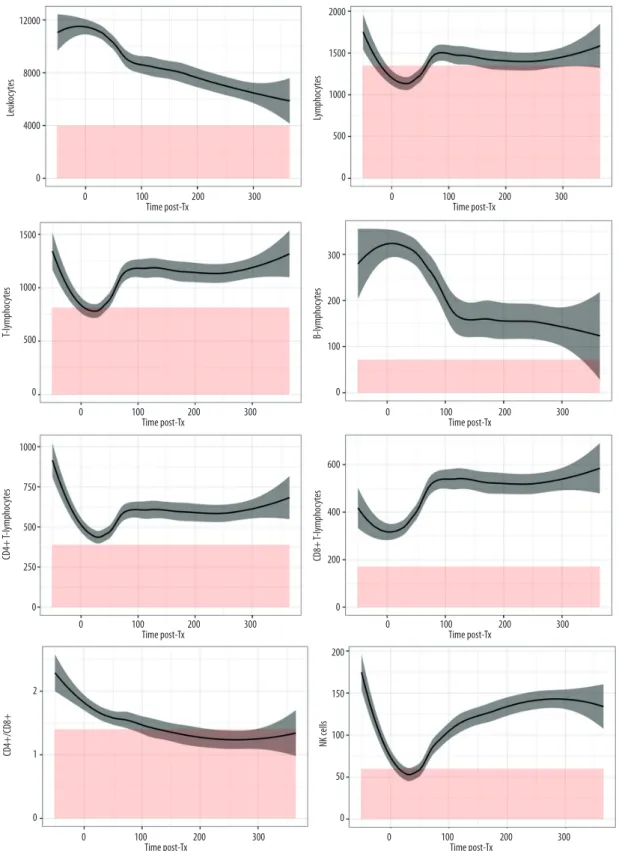
Kinetics of leukocytes and lymphocyte subsets
Kinetics of total leukocytes and lymphocyte subsets of the whole cohort are graphically represented in Figure 1. After an initial increase in the immediate postoperative phase, leuko-cytes kinetics demonstrated a slow and constant decrease un-til day 365. Compared to baseline values, we observed a de-crease below normal range in total lymphocytes, T lymphocytes (CD4+ and CD8+), and NK cells from day 3 to day 30. After this initial decline, T lymphocytes and NK cells increased steadi-ly to reach a plateau at around 100 days, returning to above
Characteristics Median [IQR] or n (%) Lung transplant recipients (n) 57 (100) Age at transplantation (year) 48 [38–56]
Men/Women 31 (54.4)/26 (45.6) Disease Cystic fibrosis 14 (24.6) Emphysema 20 (35.1) COPD 15 (26.3) A1AD 5 (8.8) Pulmonary fibrosis 23 (40.3) Idiopathic 15 (26.3) Scleroderma 3 (5.3) GvH 1 (1.7) LCDD 1 (1.7) Sarcoidosis 1 (1.7) Sjogren 1 (1.7) RP 1 (1.7) CMV status D–/R– 20 (35.1) D–/R+ 13 (22.8) D+/R+ 18 (31.6) D+/R– 6 (10.5)
Table 1. Patient characteristics. Results are expressed as median [interquartile] or number, n (%). For DSA, allograft dysfunction, and opportunistic infections, results represent the number of recipients with at least 1 event within the first year.
Characteristics Median [IQR] or n (%) Type of LTx Single 6 (10.5) Double 51 (89.5) PGD 16 (28.1) Stage 2 [2–3] DSA class I 14 (24.6) DSA class II 18 (31.6) Allograft dysfunction AR 17 (29.8) RAS 2 (3.5) BOS 5 (8.8) Opportunistic infections Bacterial 50 (87.7) Viral 8 (14.0) Fungal 8 (14.0) CMV reactivation 26 (45.6)
COPD – chronic obstructive pulmonary disease;
A1AD – alpha-1 antitrypsin disease; GvH – graft versus host disease after bone graft; LCDD – light-chain deposition disease; RP – rheumatoid polyarthritis; D – donor; R – recipients; LTx – lung transplantation; CMV – cytomegalovirus; PGD – primary graft dysfunction; PBLS – peripheral blood lymphocyte subsets; DSA – donor-specific antibodies; AR – acute rejection; RAS – restrictive allograft syndrome; BOS – bronchiolitis obliterans syndrome.
12000 8000 4000 0 0 100 Time post-Tx200 300 Leuk oc ytes 2000 1500 1000 500 0 0 100 Time post-Tx200 300 Lympho cy te s 1500 1000 500 0 0 100 Time post-Tx200 300 T-lympho cy te s 300 200 100 0 0 100 Time post-Tx 200 300 B-lymphoc ytes 1000 750 500 250 0 0 100 Time post-Tx200 300 0 100 Time post-Tx 200 300 CD4+ T-lymphoc ytes 600 400 200 0 0 100 Time post-Tx 200 300 CD8+ T-lymphoc ytes 2 1 0 CD4+/CD8 + 200 150 100 50 0 0 100 Time post-Tx 200 300 NK cells
Figure 1. Kinetics of peripheral blood lymphocyte subsets (PBLS) over the first year post-transplantation. Y-axis=cell counts in cells/µL and X-axis=time post-transplant in days. Curves represent the smoothed mean with confidence interval. Values before zero represent the pooled counts realized within 3 months before LTx. Red color represents area below inferior normal thresholds from healthy controls.
standard value. CD4+ T lymphocytes and NK cells did not reach their baseline values, whereas CD8+ T lymphocytes exceed-ed baseline by more than 100 cell/µL. B cells decreasexceed-ed more gradually, with the lowest level reached after 100 days, con-stantly above normal range. CD4/CD8 ratio decreased grad-ually to almost reach equality between populations from the 200th day and then stabilized.
Kinetics according to recipient characteristics
The analysis of patient characteristics as factors influencing PBLS kinetics revealed in the univariate analysis a more severe T cell depletion: (1) in patients affected with previous emphy-sema (–359 [–713 to –5] cell/µL, p=0.047) and pulmonary fi-brosis (–404 [–745 to –62] cell/µL, p=0.021) as compared to those with cystic fibrosis; (2) in males (–305 [–572 to –37] cell/µL, p=0.03) as compared to females; and (3) in recipients older than median age (–348 [–533 to –163] cell/µL, p<0.001) compared to younger recipients. Multivariate analysis found a significantly more severe T lymphopenia in older recipients (–414 [–709 to –119] cell/µL, p=0.01) as compared to young-er recipients and in pulmonary fibrosis compared to cystic fi-brosis (–354 [–700 to –8] cell/µL, p=0.045) (Table 2).
Kinetics according to the age
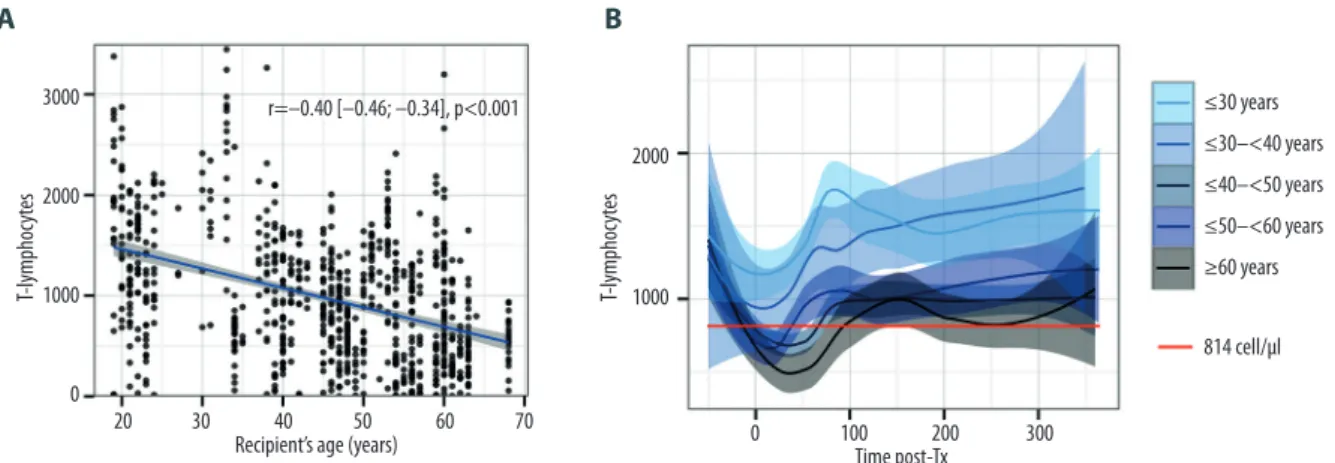
Pearson’s test revealed a negative correlation between age and T lymphocytes in the overall PBLS set (Pearson’s coeffi-cient r=–0.40 [–0.46 to –0.34], p<0.001). The analysis by de-cades revealed that this effect worsened with increasing age, and only recipients older than 40 years crossed the lower nor-mal range (Figure 2).
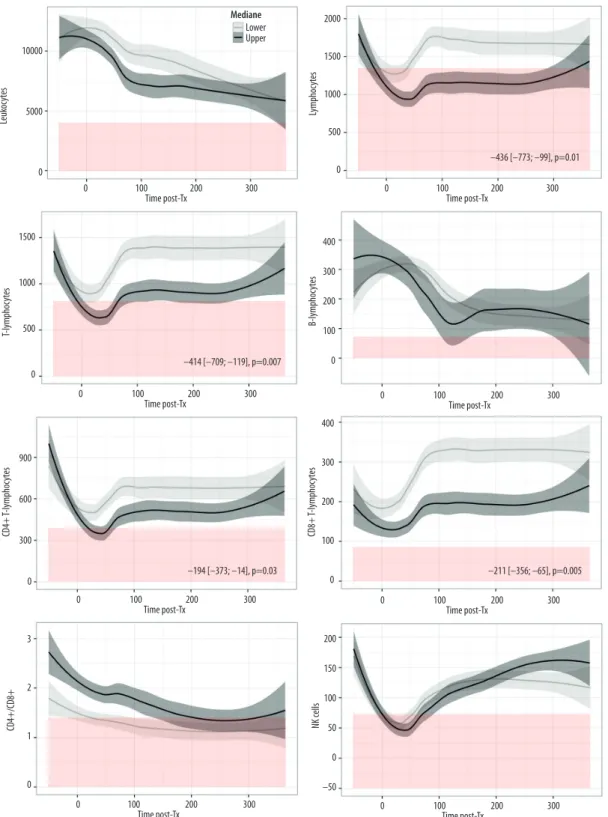
Analysis of CD4+ T lymphocytes kinetics according to recip-ient age revealed that older patrecip-ients (who have lower CD4+ estimated at –194 [–373 to –14] cell/µL, p=0.03 within first year post-LTx) crossed the line of the lower normal value (388 cell/µL) in the early postoperative phase around day 30, where-as younger recipients remained in normal range (Figure 3). Despite significantly lower CD8+ T lymphocytes (–211 [–356 to –65] cell/µL, p=0.005), older recipients remained in normal range for this subpopulation. Finally, total lymphocytes, prob-ably through the influence of T cells, were lower in older re-cipients (–436 [–773 to –99] cell/µL, p=0.01) and constantly below normal range (1350 cell/µL) until day 300. There was no relevant difference by age for the other subpopulations (Table 2, Figure 3).
Allograft outcome
Over the 839 PBLS samples obtained during the first year post-transplantation, 228 (27.2%) were performed in a context of bacterial, 15 (1.8%) in viral, 13 (1.5%) in fungal infections, 82
(9.8%) in CMV blood reactivation, 42 (5.0%) during episodes of AR, 18 (2.1%) in occurrence of BOS, and 19 (2.3%) in RAS. For some patients, there were repeated measures of PBLS for the same complication but this effect was integrated in the analysis by the linear mixed model. There were 176 (21.0%) PBLS with missing data on CMV reactivations, not systemati-cally realized at each PBLS monitoring.
The description of bacterial infections reported in Supplementary Table 1 revealed that the lungs are the most frequent site of infection (81%) and that most bacterial infections occurred within 90 days post-transplant. Resistant bacteria are mostly implicated in the early postoperative period (within 60 days) and correspond to hospital-acquired infections, while other bacteria are community-acquired infection or tardive coloni-zation such as Pseudomonas aeruginosa.
Univariate and multivariate analyses showed a strong associ-ation between lymphopenia and concomitant bacterial (–177 [–310 to –44] cell/µL, p=0.009) and viral (–601 [–984 to –218] cell/µL, p=0.002) infections. Except for NK cells, this associa-tion was observed in all lymphocyte subpopulaassocia-tions, T cells (CD4+ and CD8+), and B cells. Regarding fungal infections, we demonstrated higher CD4+ T lymphocytes (+412 [+235 to +590] cell/µL, p<0.001). BOS was associated with higher levels of CD8+ T lymphocytes (+324 [+94 to +553] cell/µL, p=0.006) and RAS with higher total leukocytes (+3770 [+418 to +7122] cell/µL, p=0.028). RAS was also associated with lower level of NK cells (–60 [–115 to –5] cell/µL, p=0.034). CMV reactiva-tions, acute rejecreactiva-tions, and presence of class I or class II do-nor-specific antibodies were not correlated with specific PBLS profile (Table 3).
Based on the association between lymphopenia and infection (bacterial and viral), we evaluated the diagnostic performance of PBLS (T and B lymphocytes) by ROC curves as markers of global infection (bacterial and viral). The analysis revealed the best performance with CD4+ T cells: AUC=0.77 [0.70 to 0.84], Se=75.2%, Sp=68.8%, PPV=47.1%, and NPV=88.2% for a best threshold at 432 cell/µL (Figure 4) (data not shown for the other subpopulations).
Discussion
The present study provides detailed and complementary in-formation on the kinetics of lymphocyte subsets in peripher-al blood after LTx and their associations with patient charac-teristics and allograft outcome.
Kinetics of PBLS after LTx distinguished 2 consecutive phas-es in relationship with the immunosupprphas-essive therapy. In the very early postoperative phase, there was not only a strong
Univariate analysis Multivariate analysis
Disease CF (Reference) COPD PF p Value COPD PF p Value
Estimated difference Estimated difference Estimated difference Estimated difference
[95% CI] [95% CI] [95% CI] [95% CI]
Leukocytes 0 1045 [–1262; 3351] 93 [–2108; 2295] 0.56 Lymphocytes 0 –424 [–756; –92] –454 [–773; –136] 0.01 –276 [–679; 126] –410 [–805; –15] 0.12 T-Cells 0 –359 [–713; –5] –404 [–745; –62] 0.05 –137 [–489; 216] –354 [–700; –8] 0.12 CD4+ T-Cells 0 –100 [–311; 111] –194 [–397; 10] 0.17 20 [–195; 236] –116 [–327; 95] 0.37 CD8 T-Cells 0 –237 [–410; –63] –175 [–342; –8] 0.03 –128 [–302; 46] –201 [–372; –31] 0.07 B-Cells 0 –19 [–183; 144] –36 [–130; 130] 0.99 NK-Cells 0 0 [–29; 28] 4 [–23; 31] 0.93
Sex Women (Reference) Men p Value Men p Value
Estimated difference Estimated difference [95% CI] [95% CI] Leukocytes 0 –420 [–1670; 1670] 0.82 Lymphocytes 0 –313 [–617; 10] 0.04 –267 [–589; 56] 0.10 T-Cells 0 –305 [–572; –37] 0.03 –190 [–472; 92] 0.18 CD4+ T-Cells 0 –216 [–369; –63] 0.006 –124 [–296; –48] 0.15 CD8 T-Cells 0 –81 [–22; 57] 0.24 B-Cells 0 44 [–79; 167] 0.47 NK-Cells 0 –10 [–31; 11] 0.35 Age £ Median
(Reference) > Median p Value > Median p Value
Estimated difference Estimated difference [95% CI] [95% CI] Leukocytes 0 –1417 [–2581; –253] 0.02 952 [–1337; 3240] 0.41 Lymphocytes 0 –385 [–601; –170] <0.001 –436 [–773; –99] 0.01 T-Cells 0 –348 [–533; –163] <0.001 –414 [–709; –119] 0.007 CD4+ T-Cells 0 –136 [–253; –19] 0.02 –194 [–373; –14] 0.03 CD8 T-Cells 0 –179 [–268; –90] <0.001 –211 [–356; –65] 0.005 B-Cells 0 22 [–62; 107] 0.60 NK-Cells 0 4 [–16; 24] 0.70
Table 2. PBLS counts according to recipient characteristics. The results (expressed in cells/µL) represent the estimated difference [95% CI] in PBLS counts within the first year according to primary lung disease, sex, and age group. The statistical analysis was performed with the linear mixed model as described in Methods.
T cell depletion, as expected with the induction therapy with ATG [22,23], but also a decrease in NK cell counts. The im-pact of ATG on NK cells has already been reported in kidney transplantation [24,25]. However, this effect could also be at-tributed to corticosteroids, which are known to inhibit func-tions and proliferation of NK cells [26–29]. In this early post-operative phase, both T lymphocyte and NK cell counts are the lowest in follow-up and below normal range compared to healthy controls, confirming the high risk of OI during this period. The effect of induction therapy disappears by around day 30. The induction therapy does not influence B cells that are depressed later.
The consecutive phase depends on maintenance immunosup-pressive therapy (calcineurin inhibitor and antimetabolites) that depresses all PBLS by their anti-lymphoproliferative ef-fect, which seems to be fully effective by around day 100, and thereafter have a quite stable effect over time. It is notewor-thy, however, that NK cells and CD4+ T lymphocytes never turn in this phase to baseline ptransplant values, which re-flects a constant immunosuppression over time.
Kinetics of PBLS was then evaluated according to recipient char-acteristics, and in multivariate analysis revealed significantly lower T lymphocyte counts among the oldest patients within the first year. This effect is demonstrated mainly in the ear-ly postoperative phase after lung transplant and then seems to disappear, which more strongly suggests induction therapy than standard maintenance regimen. We also noted that only older recipients (especially more than 40 years old) cross the line of the lower normal value (814 cell/µL) in the postoper-ative phase at around day 30, conferring to them a potential higher risk of OI. This observation in T lymphocytes may be
related to immune senescence. The concept of immune senes-cence in transplantation has recently been strongly suspect-ed by the observation of higher infectious and cancer risks, with lower incidence of acute rejection in older transplant-ed patients [30,31]. More generally, the aging of the immune system is well described and results in altered inflammation and response to vaccination [32]. It is also known that the senescence especially alters T cell functions [33], which may explain why in our study the influence of age was only ob-served in this population. The influence of induction therapy on immune senescence has recently been described in kidney transplantation upon observing lower levels of hematopoiet-ic progenitor cells, lower T cell-relative telomere length, and telomerase activity at 1 year post-transplant in ATG-treated patients as compared with those receiving anti-CD25 mono-clonal antibodies [34]. Indeed, hematopoietic progenitor cells defect could explain a slower T cell reconstitution in older re-cipients after target induction therapy. Thus, it would be in-teresting to evaluate the effectiveness and impact of adapt-ing immunosuppression accordadapt-ing to age, as recently proposed by Krenzien et al. [30].
Finally, we evaluated the associations between PBLS and con-sequent graft outcomes (OI and rejection); 25% of PBLS per-formed within the first year were realized in the context of OI
versus 5% in the context of AR, which reflects the strong
im-munosuppression during this period.
Regarding OI, as expected, T and B lymphopenia was associ-ated both with bacterial and viral infections. These findings are well known in infectious diseases and have also been de-scribed many times in the kidney transplant literature [2,3]. In our study, CD4+ T cells were the best diagnostic marker of
3000
2000
1000
0
20 30 40
Recipient’s age (years)50 60 70 0 100Time post-Tx200
≤30 years ≤30–<40 years ≤40–<50 years ≤50–<60 years ≥60 years 814 cell/µl 300 r=–0.40 [–0.46; –0.34], p<0.001 T-lympho cy te s 2000 1000 T-lympho cy te s
A
B
Figure 2. T lymphocytes according to the age. (A) Scatterplot and fitted linear regression (blue line) with confidence interval (grey fill). Pearson correlation test, r=coefficient of correlation. (B) Kinetics of T lymphocytes over the first year post-transplantation according to age in decades. Y-axis= cell counts in cell/µL and X-axis=time post-transplant in days. Curves represent the smoothed mean with confidence interval. Values before zero represent the pooled counts realized within 3 months before LTx. Red line represents the inferior normal threshold from healthy controls.
10000 5000 0 0 100 Time post-Tx200 Mediane 300 Lower Upper Leuk oc ytes 2000 1500 1000 500 0 0 100 Time post-Tx –436 [–773; –99], p=0.01 –414 [–709; –119], p=0.007 –194 [–373; –14], p=0.03 –211 [–356; –65], p=0.005 200 300 Lympho cy te s 1500 1000 500 0 0 100 Time post-Tx200 300 T-lympho cy te s 400 300 200 100 0 0 100 Time post-Tx200 300 B-lymphoc ytes 900 600 300 0 0 100 Time post-Tx200 300 0 100 Time post-Tx200 300 CD4+ T-lymphoc ytes 400 300 200 100 0 0 100 Time post-Tx200 300 CD8+ T-lymphoc ytes 3 2 1 0 CD4+/CD8 + 200 150 100 50 0 –50 0 100 Time post-Tx 200 300 NK cells
Figure 3. Kinetics of peripheral blood lymphocyte subsets (PBLS) over the first year post-transplantation according to age groups (median). Y-axis=cell counts in cells/µL and X-axis=time post-transplant in days. Grey curves=recipients £ median age (48 years old). Black curves= recipients > median age. Curves represent the smoothed mean with confidence interval. Values before zero represent the pooled counts performed within 3 months before LTx. Red color represents the area below inferior normal thresholds from healthy controls. Analysis by linear mixed model: beta estimation of cell counts differences with confidence interval and p value.
Univariate
analysis Multivariate analysis Univariate analysis Multivariate analysis Univariate analysis Multivariate analysis Estimated
difference Valuep Estimated difference Valuep Estimated difference Valuep Estimated difference Valuep Estimated difference Valuep Estimated difference Valuep
[95% CI] [95% CI] [95% CI] [95% CI] [95% CI] [95% CI]
Bacterial infection Viral infection Fungal infection
Leukocytes 461 [–234; 1156] 0.19 –206 [–1004; 593] 0.61 887 [–1478; 3251] 0.46 1675 [–814; 4164] 0.19 –316 [–2650; 2017] 0.79 Lymphocytes –190 [–284; –97] <0.001 –177 [–310; –44] 0.009 –324 [–646; –2] 0.048 –601 [–984; –218] 0.002 216 [–139; 571] 0.23 T-Cells –176 [–255; –98] <0.001 –137 [–246; –28] 0.014 –264 [–533; 6] 0.055 –471 [–784; –159] 0.003 205 [–92; 503] 0.17 604 [282; 926] <0.001 CD4+ T-Cells –107 [–157; –58] <0.001 –80 [–140; –19] 0.01 –140 [–309; 30] 0.11 –237 [–410; –65] 0.007 162 [–26; 349] 0.09 412 [235; 590] <0.001 CD8 T-Cells [–96; –28]–62 <0.001 [–109; –1]–55 0.044 [–246; –12]–129 0.03 [–368; –60]–214 0.007 [–71; –186]57 0.38 B-Cells –34 [–60; –9] 0.008 –46 [–85; –8] 0.017 –83 [–171; 4] 0.06 –144 [–251; –37] 0.009 –14 [–110; 81] 0.77 NK-Cells –107 [–23; 1] 0.08 –9 [–26; 7] 0.27 1 [–40; 42] 0.95 21 [–25; 6] 0.37
CMV replication DSA class I DSA class II
Leukocytes –923 [–1946; 102] 0.08 –218 [–1178; 742] 0.65 55 [–1424; 1534] 0.94 –174 [–1475; 1128] 0.79 Lymphocytes –104 [–228; 21] 0.10 –92 [–250; 66] 0.25 –111 [–310; –89] 0.28 –114 [–287; 60] 0.20 –25 [–214; 163] 0.79 T-Cells –84 [–188; 20] 0.11 –81 [–210; –49] 0.22 126 [–95; 347] 0.26 –75 [–220; 70] 0.31 CD4+ T-Cells –57 [–117; 2] 0.06 –61 [–132;11] 0.10 –62 [–167; 42] 0.24 –47 [–138; 44] 0.31 CD8 T-Cells –30 [–78; 19] 0.23 –237 [–410; –63] 0.26 –38 [–100; –25] 0.24 B-Cells [–11; 65]27 0.16 [–25; 64]19 0.39 [–92; 15]–38 0.16 [–64; 88]12 0.76 [–87; 5]–41 0.08 [–68; 35]–16 0.53 NK-Cells –4 [–19; 11] 0.61 12 [–14; 38] 0.37 4 [–19; 27] 0.73
Acute rejection BOS RAS
Leukocytes 900 [–476; 2276] 0.20 –379 [–2027; 1268] 0.65 –1053 [–4171; 2064] 0.51 3712 [304; 7120] 0.03 3770 [418; 7122] 0.028 Lymphocytes –113 [–302; 76] 0.24 149 [–328; 625] 0.54 –254 [–809; 301] 0.37 T-Cells –117 [–276; 41] 0.15 –185 [–412; 42] 0.11 128 [–272; 528] 0.53 –175 [–642; 291] 0.46 CD4+ T-Cells [–174; 25]–74 0.14 [–233; 18]–107 0.09 [–261; 237]–12 0.92 [–379; 198]–90 0.54 CD8 T-Cells –46 [–115; 23] 0.19 –67 [–179; 45] 0.24 146 [–35; 327] 0.11 324 [94; 553] 0.006 –75 [–290; 141] 0.49 B-Cells –11 [–62; 40] 0.67 179 [37; 322] 0.013 92 [–97; 281] 0.34 –49 [–224; 126] 0.58 NK-Cells [–25; 23]1 0.94 [–29; 76]23 0.38 [–98; 17]–40 0.17 [–115; –5]–60 0.034
CMV – cytomegalovirus; DSA – donor-specific antibodies; AR – acute rejection; RAS – restrictive allograft syndrome; BOS – bronchiolitis obliterans syndrome; CI – confidence interval.
Table 3. PBLS counts according to outcome. The results (expressed in cells/µL) represent the estimated difference [95% CI] in PBLS counts performed within the first year according to the concomitant presence of an infectious and/or immunological complication. The statistical analysis was performed with the linear mixed model as described in Methods.
global infection, with a best threshold evaluated at 432 cell/µL. Thus, CD4+ T cells, as used in HIV for the prevention of OI [35], could be an interesting biomarker of infection. More recently, immune function monitoring using adenosine triphosphate lym-phocytes production was also revealed as being an interesting blood marker of infection after lung transplantation [36,37]. We did not demonstrate any association between PBLS and CMV reactivation, whereas Calarota et al. previously demon-strated a strong association with CD4+ T lymphopenia [4]. Missing data for CMV (19.8% of PBLS) probably underpow-ered this analysis.
Class I or class II donor-specific antibodies and acute rejection were not associated with specific PBLS profile in our study. This suggests that standard lymphocytes subsets (T, B, and NK cells) are not specific enough to show an association with these risks. Some authors demonstrated a link between ac-tivated T lymphocytes that were marked for HLA-DR (type II MHC) and acute rejection in kidney transplantation, suggest-ing that a more specific marker of immune response must be found [38–41].
Regarding CLAD, the expected low incidence within the first postoperative year (2% of PBLS, 2 RAS and 5 BOS over the 57 recipients included) does not allow a strong conclusion. Nonetheless, multivariate analysis revealed high levels of CD8+ T lymphocytes in BOS and high levels of leukocytes in RAS. These results are consistent with the recent lung trans-plantation literature. Indeed, there is now strong evidence that adaptive T cell responses play a key role in chronic lung al-lograft rejection, especially in obliterative bronchiolitis [42,43].
However, the correlation between high CD8+ T lymphocytes and BOS is almost exclusively described in animals, and partic-ularly in murine heterotopic allogeneic airway transplant mod-els that showed the implication of CD8+ T cells in the role of airway allograft rejection [44–49]. More specifically, PD-1 and histone deacetylase 2 involved in immune tolerance of CD8+ T cells was recently demonstrated as being link to lung graft survival [50,51].
The association between RAS and high leukocyte count is also interesting. Leukocytes kinetics are probably indirectly relat-ed to neutrophil blood cell population (not evaluatrelat-ed in our study), since neutrophils represent more than half of the to-tal numeration. The mechanisms involved are not clear, but in-creased neutrophils in broncho-alveolar lavage fluid from recip-ients with RAS was recently described by Verleden et al. [52], who demonstrated that neutrophils might be involved in the pathophysiology of this CLAD.
Our study has some limitations. Its monocentric nature makes generalizations difficult but allowed us to have a homoge-neous group. All patients received the same immunosuppres-sive treatment, which is standard in lung transplantation. These results should be confirmed prospectively and assessed in a larger, multicenter cohort.
Conclusions
Our study demonstrated that aging is associated with more severe T lymphopenia after induction therapy for lung trans-plantation. This effect could be related to immune senescence, which was until now was only indirectly suspected based on the fact that older patients developed more opportunistic in-fections and cancer, and had less rejection in solid organ trans-plantation [30]. It would be thus interesting to evaluate the ef-fect of a strategy of age-adapted immunosuppression on the allograft outcome in a proper prospective randomized trial. In the new era of individualized therapy in modern medicine, immunosuppression protocols should probably be more indi-vidualized according to the individual recipient characteristics and immune status. Lee et al. recently proposed to guiding the introduction of immunosuppression in liver transplantation based on the preoperative levels of CD8+ T lymphocytes [53]. Furthermore, we found an interesting association between PBLS and allograft outcomes such as CD8+ T cells with BOS and leu-kocytes with RAS, which is consistent with the recent litera-ture on lung transplantation. These results reinforce the idea that PBLS monitoring is an interesting tool to use in evaluat-ing the risk-benefit balance of immunosuppression and could be a useful biomarker of specific allograft outcome.
1.0 0.8 0.6 0.4 0.2 0.0 0.0 0.2 0.4 1-Specificity AUC=0.77 [0.70; 0.84] 0.6 0.8 1.0 Sensibilit y
Figure 4. ROC curves of CD4+ T cell counts realized within the first year for diagnosis of infection (bacterial and viral). AUC: area under the curve.
Supplementary Figure 1. Peripheral blood lymphocyte subsets (PBLS) count by flow cytometry. Cells in the lymphocyte gate were subsequently separated into T cells (CD3+), B cells (CD19+), and NK cells (CD16CD56+). Cells in the T cell gate were
separated into helper T cells (CD4+) and cytotoxic T cells (CD8+).
1,0 M 800 K 600 K 400 K 200 K 0 Lymphocytes NK cells CD4 T cells B cells CD8 100 101 102 103 CD45 104 105 106 100 101 102 103 CD16/56 104 105 106 100 101 102 103 CD19 104 105 106 100 101 102 103 CD8 104 105 106 Side scatter 106 105 104 103 102 101 100 CD3 106 105 104 103 102 101 100 CD4 106 105 104 103 102 101 100 CD3
Supplementary Files
References:
1. Scheffert JL, Raza K: Immunosuppression in lung transplantation. J Thorac Dis, 2014; 6: 1039–53
2. Calarota SA, Zelini P, De Silvestri A et al: Kinetics of T-lymphocyte subsets and posttransplant opportunistic infections in heart and kidney transplant recipients. Transplantation, 2012; 93: 112–19
3. Fernández-Ruiz M, López-Medrano F, Allende LM et al: Kinetics of periph-eral blood lymphocyte subpopulations predicts the occurrence of opportu-nistic infection after kidney transplantation. Transpl Int, 2014; 27: 674–85 4. Calarota SA, Chiesa A, Silvestri AD: T-lymphocyte subsets in lung transplant
recipients: association between nadir CD4 T-cell count and viral infections after transplantation. J Clin Virol, 2015; 69: 110–16
5. Meehan AC, Sullivan LC, Mifsud NA et al: Natural killer cell activation in the lung allograft early posttransplantation. Transplantation, 2010; 89: 756–63 6. Fildes JE, Yonan N, Tunstall K et al: Natural killer cells in peripheral blood
and lung tissue are associated with chronic rejection after lung transplan-tation. J Heart Lung Transplant, 2008; 27: 203–7
Causal agent PBLS, n (%) Time Site PBLS, n (%) Time
Total 839 839
Bacterial Infections
228 (100) 228 (100)
Staphylococcus aureus 43 (19) 38 [25–103] Lung 183 (81) 75 [30–185]
Streptococcus pneumoniae 7 (3) 185 [70–220] Urinary tract 13 (6) 64 [42–245]
Enterococcus (faecalis,
faecium) 4 (2) 49 [45–55] Bacteriemia 12 (5) 57 [44–85]
Neisseria flavescens 1 (0.5) 26 [26–26] Intestin 2 (1) 89 [76–103]
GPB (Bacillus,
Corynebacterium) 5 (2) 121 [42–284] Others 16 (7) 122 [15–230]
Enterobacteria, group I 7 (3) 121 [24–291] Enterobacteria, group II 21 (9) 72 [37–111] Enterobacteria, group III 26 (11) 58 [29–152]
Other GNB-S 5 (2) 124 [120–129] Other GNB-R 21 (9) 55 [22–72] Pseudomonas aeruginosa 69 (30) 121 [38–206] Not found 19 (8) 176 [98–261] Viral infections 15 (100) Myxovirus influenzae 3 (20) 125 [87–128]
Respiratory syncytial virus 6 (40) 280 [185–289]
Rhinovirus 3 (20) 61 [59–69]
Human simplex virus 3 (20) 67 [63–70]
Supplementary Table 1. Description of pathogens and clinical sites implicated in reported infections (bacteria and viruses) isolated in recipients. Description concerns only PBLS realized after lung transplant (n=839/890).
GPB – gram-positive bacilli; GNB-S – gram-negative bacilli sensitive to third-generation cephalosporin; GNB-R – gram-negative bacilli resistant to third- generation cephalosporin.
7. Fildes JE, Walker AH, Williams SG et al: CMV infection is associated with the depletion but lack of activation of peripheral blood natural killer cells in a lung transplant cohort. Transpl Immunol, 2008; 19: 235–37 8. Dijke EI, Platt JL, Blair P et al: B cells in transplantation. J Heart Lung
Transplant, 2016; 35: 704–10
9. San Segundo D, Ballesteros MA, Mons R et al: Study of B-cell subpopula-tions in lung transplant recipients with posttransplant infection. Transplant Proc, 2012; 44: 2676–78
10. Levine DJ, Glanville AR, Aboyoun C et al: Antibody-mediated rejection of the lung: A consensus report of the International Society for Heart and Lung Transplantation. J Heart Lung Transplant, 2016; 35(4): 397–406 11. Yusen RD, Edwards LB, Kucheryavaya AY et al: The registry of the International
Society for Heart and Lung Transplantation: Thirty-first adult lung and heart-lung transplant report--2014; focus theme: retransplantation. J Heart Lung Transplant, 2014; 33: 1009–24
12. Giefing-Kröll C, Berger P, Lepperdinger G, Grubeck-Loebenstein B: How sex and age affect immune responses, susceptibility to infections, and response to vaccination. Aging Cell, 2015; 14: 309–21
13. Troussard X, Vol S, Cornet E et al: Full blood count normal reference values for adults in France. J Clin Pathol, 2014; 67: 341–44
14. Comans-Bitter WM, de Groot R, van den Beemd R et al: Immunophenotyping of blood lymphocytes in childhood. Reference values for lymphocyte sub-populations. J Pediatr, 1997; 130: 388–93
15. Hachem RR, Edwards LB, Yusen RD et al: The impact of induction on sur-vival after lung transplantation: An analysis of the International Society for Heart and Lung Transplantation Registry. Clin Transplant, 2008; 22: 603–8 16. Hachem RR, Yusen RD, Chakinala MM et al: A randomized controlled trial
of tacrolimus versus cyclosporine after lung transplantation. J Heart Lung Transplant, 2007; 26: 1012–18
17. McNeil K, Glanville AR, Wahlers T et al: Comparison of mycophenolate mofetil and azathioprine for prevention of bronchiolitis obliterans syndrome in de
novo lung transplant recipients. Transplantation, 2006; 81: 998–1003
18. Stewart S, Fishbein MC, Snell GI et al: Revision of the 1996 working for-mulation for the standardization of nomenclature in the diagnosis of lung rejection. J Heart Lung Transplant, 2007; 26: 1229–42
19. Meyer KC, Raghu G, Verleden GM et al: An international ISHLT/ATS/ERS clinical practice guideline: diagnosis and management of bronchiolitis ob-literans syndrome. ISHLT/ATS/ERS BOS Task Force Committee. Eur Respir J, 2014; 44: 1479–503
20. Verleden GM, Raghu G, Meyer KC et al: A new classification system for chron-ic lung allograft dysfunction. J Heart Lung Transplant, 2014; 33: 127–33 21. Gottlieb J, Szangolies J, Koehnlein T et al: Long-term azithromycin for
bron-chiolitis obliterans syndrome after lung transplantation. Transplantation, 2008; 85: 36–41
22. Buszko M, Cardini B, Oberhuber R et al: Differential depletion of total T cells and regulatory T cells and prolonged allotransplant survival in CD3e humanized mice treated with polyclonal anti human thymocyte globulin. PlosOne, 2017; 12: e0173088
23. Büchler M, Longuet H, Lemoine R et al: Pharmacokinetic and pharmacody-namic studies of two different rabbit antithymocyte globulin dosing regi-mens: Results of a randomized trial. Transpl Immunol, 2013; 28: 120–26 24. Vacher-Coponat H, Brunet C, Moal V et al: Tacrolimus/mycophenolate mofetil
improved natural killer lymphocyte reconstitution one year after kidney transplant by reference to cyclosporine/azathioprine. Transplantation, 2006; 82: 558–66
25. Kho MM, Bouvy AP, Cadogan M et al: The effect of low and ultra-low dos-ages Thymoglobulin on peripheral T, B and NK cells in kidney transplant recipients. Transpl Immunol, 2012; 26: 186–90
26. Migliorati G, Pagliacci C, Moraca R et al: Glucocorticoid-induced apoptosis of natural killer cells and cytotoxic T lymphocytes. Pharmacol Res, 1992; 26(Suppl. 2): 26–27
27. Liu B, Li Z, Mahesh SP et al: Glucocorticoid-induced tumor necrosis fac-tor recepfac-tor negatively regulates activation of human primary natural kill-er (NK) cells by blocking prolifkill-erative signals and increasing NK cell apop-tosis. J Bioch Chem, 2008; 283: 8202–10
28. Chen S, Ndhlovu LC, Takahashi T et al: Co-inhibitory roles for glucocorti-coid-induced TNF receptor in CD1d-dependent natural killer T cells. Eur J Immunol, 2008; 38: 2229–40
29. Moustaki A, Argyropoulos KV, Baxevanis CN et al: Effect of the simultane-ous administration of glucocorticoids and IL-15 on human NK cell pheno-type, proliferation and function. Cancer Immunol Immunother, 2011; 60: 1683–95
30. Krenzien F, ElKhal A, Quante M et al: A Rationale for age-adapted immuno-suppression in organ transplantation. Transplantation, 2015; 99: 2258–68 31. Seyda M, Quante M, Uehara H et al: Immunosenescence in renal trans-plantation: A changing balance of innate and adaptive immunity. Curr Opin Organ Transplant, 2015; 20: 417–23
32. Pinti M, Appay V, Campisi J et al: Aging of the immune system: Focus on inflammation and vaccination. Eur J Immunol, 2016; 46: 2286–301
33. Akbar AN, Henson SM, Lanna A: Senescence of T lymphocytes: Implications for enhancing human immunity. Trends Immunol, 2016; 37: 866–76 34. Crepin T, Carron C, Roubiou C et al: ATG-induced accelerated immune
senes-cence: Clinical implications in renal transplant recipients. Am J Transplant, 2015; 15: 1028–38.
35. Masur H, Kaplan JE, Holmes KK; U.S. Public Health Service; Infectious Diseases Society of America: Guidelines for preventing opportunistic in-fections among HIV-infected persons – 2002. Recommendations of the U.S. Public Health Service and the Infectious Diseases Society of America. Ann Intern Med, 2002; 137: 435–78
36. Takahashi M, Ohsumi A, Ohata K et al: Immune function monitoring in lung transplantation using adenosine triphosphate production: Time trends and relationship to postoperative infection. Surg Today, 2017; 47: 762–69 37. Piloni D, Magni S, Oggionni T et al: Clinical utility of CD4+ function
assess-ment (ViraCor-IBT ImmuKnow test) in lung recipients. Transpl Immunol, 2016; 37: 35–39
38. Van Es A, Baldwin WM, Oljans PJ et al: Expression of HLA-DR on T lympho-cytes following renal transplantation, and association with graft-rejection episodes and cytomegalovirus infection. Transplantation, 1984; 37: 65–69 39. Zegleń S, Łaszewska A, Wojarski J et al: Lymphocyte subtypes CD3+, CD19+, CD16+CD56+, CD4+, CD8+, and CD3+HLA-DR+ in peripheral blood obtained from patients after thoracic organ transplantation. Transplant Proc, 2011; 43: 3055–57
40. Schaier M, Seissler N, Becker LE et al: The extent of HLA-DR expression on HLA-DR(+) Tregs allows the identification of patients with clinically rele-vant borderline rejection. Transpl Int, 2013; 26: 290–99
41. Kisielewicz A, Schaier M, Schmitt E et al: A distinct subset of HLA-DR+-regulatory T cells is involved in the induction of preterm labor during preg-nancy and in the induction of organ rejection after transplantation. Clin Immunol, 2010; 137: 209–20
42. Belperio JA, Weigt SS, Fishbein MC, Lynch JP 3rd: Chronic lung allograft re-jection: Mechanisms and therapy. Proc Am Thorac Soc, 2009; 6: 108–21 43. Hsiao HM, Scozzi D, Gauthier JM, Kreisel D: Mechanisms of graft rejection
after lung transplantation. Curr Opin Organ Transplant, 2017; 22: 29–35 44. West EE, Lavoie TL, Orens JB et al: Pluripotent allospecific CD8+ effector T
cells traffic to lung in murine obliterative airway disease. Am J Respir Cell Mol Biol, 2006; 34: 108–18
45. Wu Q, Gardiner GJ, Berry E et al: ICOS-expressing lymphocytes promote res-olution of CD8-mediated lung injury in a mouse model of lung rejection. PLoS One, 2013; 8: e72955
46. Richards DM, Dalheimer SL, Hertz MI, Mueller DL: Trachea allograft class I molecules directly activate and retain CD8+ T cells that cause obliterative airways disease. J Immunol, 2003; 171: 6919–28
47. Higuchi T, Maruyama T, Jaramillo A, Mohanakumar T: Induction of oblitera-tive airway disease in murine tracheal allografts by CD8+ CTLs recognizing a single minor histocompatibility antigen. J Immunol, 2005; 174: 1871–78 48. Higuchi T, Jaramillo A, Kaleem Z et al: Different kinetics of obliterative air-way disease development in heterotopic murine tracheal allografts induced by CD4+ and CD8+ T cells. Transplantation, 2002; 74: 646–51
49. Hodge G, Hodge S, Yeo A et al: BOS is Associated with increased cyto-toxic pro-inflammatory CD8 T, NKT-like and NK cells in the small airways. Transplantation, 2016 [Epub ahead of print].
50. Takahashi T, Hsiao HM, Tanaka S, et al. PD-1 expression on CD8+ T cells regulates their differentiation within lung allografts and is critical for tol-erance induction. Am J Transplant, 2017 [Epub ahead of print]. 51. Hodge G, Hodge S, Holmes-Liew CL et al: Histone deacetylase 2 is decreased
in peripheral blood pro-inflammatory CD8+ T and NKT-like lymphocytes fol-lowing lung transplant. Respirology, 2017; 22: 394–400
52. Verleden SE, Ruttens D, Vos R et al: Differential cytokine, chemokine and growth factor expression in phenotypes of chronic lung allograft dysfunc-tion. Transplantation, 2015; 99: 86–93
53. Lee CF, Wang YC, Cheng CH et al: Application of CD8+ cells count as a guide of immunosuppressive regimen introduction for very sick patients under-going liver transplantation. Transplant Proc, 2016; 48: 3356–61
![Table 1. Patient characteristics. Results are expressed as median [interquartile] or number, n (%)](https://thumb-eu.123doks.com/thumbv2/123doknet/13693994.432707/5.850.432.773.193.639/table-patient-characteristics-results-expressed-median-interquartile-number.webp)

![Table 3. PBLS counts according to outcome. The results (expressed in cells/µL) represent the estimated difference [95% CI] in PBLS counts performed within the first year according to the concomitant presence of an infectious and/or immunological complic](https://thumb-eu.123doks.com/thumbv2/123doknet/13693994.432707/11.850.80.775.212.1062/according-expressed-represent-estimated-difference-concomitant-infectious-immunological.webp)

