HAL Id: hal-00737172
https://hal.archives-ouvertes.fr/hal-00737172
Submitted on 20 Jun 2017
HAL is a multi-disciplinary open access
archive for the deposit and dissemination of
sci-entific research documents, whether they are
pub-lished or not. The documents may come from
teaching and research institutions in France or
abroad, or from public or private research centers.
L’archive ouverte pluridisciplinaire HAL, est
destinée au dépôt et à la diffusion de documents
scientifiques de niveau recherche, publiés ou non,
émanant des établissements d’enseignement et de
recherche français ou étrangers, des laboratoires
publics ou privés.
Distributed under a Creative Commons Attribution| 4.0 International License
networks for the French market
Konrad Walczyk, Annie Gravey
To cite this version:
Konrad Walczyk, Annie Gravey. Techno-economic comparison of next-generation access networks for
the French market. 18th European Conference on Information and Communications Technologies
(EU-NICE), Aug 2012, Budapest, Hungary. pp.136-147, �10.1007/978-3-642-32808-4_13�. �hal-00737172�
access networks for the French market
Konrad Walczyk1 ⋆ and Annie Gravey21 Aalborg University , Denmark,
konrad.walczyk@gmail.com
2 Institut Mines Telecom, Telecom Bretagne, UMR CNRS 6074 IRISA
Universite Europeenne de Bretagne, France annie.gravey@telecom-bretagne.eu
Abstract. The present paper compares, from a techno-economic point of view, two currently available access network solutions (Digital Sub-scriber Line and Passive Optical Network). It also considers Long-Reach Optical Access, which augments the span of the access network. All potential solutions are evaluated on the basis of Payback Period, Net Present Value and Internal Rate of Return. The market is segmented in different areas depending on their respective households density, and various business models are considered, in order to assess the impact of public funding. The French market is shown to be the most demanding in Europe, due to its low broadband access tariffs. The paper shows that, unless the take up rate for optical access significantly increases beyond its actual value, the profitability of deploying optical access for the network operators is low.
Keywords: DSL, FTTH, GPON, Access network, Metro network, Techno-economic analysis
1
Introduction
Over the next years the global bandwidth demand will increase significantly. Residential customers are spending more time online. They are uploading and sharing photos, or watching videos. The latter (e.g. HD and 3D TV) will in-evitably be the most bandwidth consuming service in the future [1, 2]. The Digi-tal Agenda of European Commission targets delivering sufficient bandwidth that will fulfill future network requirements. Its main goal is to ensure the delivery of 30 Mbps broadband connections for all of EC citizens and 100 Mbps for at least 50% of EC households by 2020 [3].
Each country differs in terms of existing copper infrastructure, current broad-band deployments, penetration rate, regulatory framework and geographical dis-tribution of households. It is well known for example that optical access is cur-rently prevalent in Japan, whereas optical access take-up rate in EC households
⋆This work was done while Konrad Walczyk was doing a master’s internship at
passed by FTTH/B access is less than 20% [1]. This is why it is unrealistic to expect a “one size fits all” type of technical solution that would be valid for all EC countries. The present study is focused on France, which can be considered as a rather extreme case due both to the good quality of its existing copper infrastructure and to the fierce competition between Internet Access Providers (IAP) that results in very low monthly broadband access rates.
Since investments required to deploy optical access infrastructures are huge [4], and can apparently not be met easily in the near future, it is important to identify what are the most profitable deployment strategies, and assess the re-spective influence of various factors such as selected technology, take-up rate and geographical data. The present study used simple techno-economic tools in order to assess various deployment strategies. The comparison of all the technologies and associated business models have been performed on the basis of three main metrics: Discounted Payback Period (DPP) i.e. the time required to recover the cost of an investment using a discounted cash flow, Net Present Value (NPV) i.e. the value of an investment in a particular year taking under consideration expected revenues minus the size of initial investments, Internal Rate of Return (IRR) i.e. the discount rate which makes the NPV equal zero.
The outline of the paper is as follows: Section 2 provides a brief review of existing works and points out how the present paper builds upon these works. Section 3 describes how costs are associated to each technology. Section 4 outlines the various techno-economic factors influencing the profitability of optical broad-band access deployment and concludes by describing the quantitative parame-ters considered in the following techno-economic calculations. Section 5 assesses the respective profitability of Digital Subscriber Line (DSL) and Passive Opti-cal Network (PON) deployments. Section 6 compares various options regarding the deployment of optical access and Section 7 applies the developed techno-economical methodology to the practical case of optical deployment strategies in Brittany (which is a mostly rural French region). Section 8 concludes the paper.
2
Related Works
Techno-economic studies are used to assess the profitability of various network architectures under different conditions. A general framework for this type of studies is e.g. described in [5]. Many such studies have been published, which usually compare several variants of a given technology as e.g. [4], which compares several optical access network architectures, or [6], which compares a traditional PON based solution with a Long Reach Optical Access (LROA). The above studies compare the rollout cost of each solution for various household densities. It is also important to consider operational costs since a solution, which could initially be expensive to rollout, could present lower operational costs. This is well detailed in [7].
This paper is an extension of the literature mentioned above. What differ-entiates it from the previous works is the comparison of both copper (DSL)
and fiber (GPON) infrastructure in the same environment. A similar analysis, but for different parameters (different technologies, different geographical area) is outlined in [7]. In particular, we wish to answer the following question: “Is is profitable to rollout Fibre Access when another operator is still proposing DSL?” Another extension of the present paper is the techno-economic analysis of public funding influence on the private actors’ business models. Lastly, we applied the developped analysis to a well identified geographical area, which is a mix of rural and suburban zones, and assessed the cost of various deployment policies.
3
Costs Associated to Technologies
The present paper considers three different technologies: Digital Subscriber Line (DSL), which is a copper based solution and two optical solutions, Gigabit PON (GPON) and LROA.
DSL is an access technology based on copper lines. It provides broadband connections to the customers by bringing the Central Office (CO) that hosts the DSL Access Multiplexor (DSLAM) as close to users as possible, since the band-width delivered by a subscriber line sharply decreases as the distance between the DSLAM and the household increases.
PON are classified as “passive” since there are no “active” (i.e. electrically powered) equipment between the user’s gateway and the CO. In these archi-tectures, the CO are unchanged and passive optical access replace DSL access. LROA is an alternate architecture which builds upon the relative insensivity of optical technologies to distance by positioning the CO further from the house-holds, thus allowing to concentrate more users per CO, and limiting the number of CO. LROA impacts both access and metro networks. GPON and LROA are less sensitive than DSL to the distance between the household and the CO. However, they require building a new access network (instead of using existing copper lines), in order to bring the optical fiber to (or very close to) the house-hold. The considered LROA solution is based on a SARDANA project [8], which aims at increasing the performance of Fiber-to-the-Home access network solu-tion. According to [8], the main benefits of SARDANA are: fewer COs (reduction in OpEx), 100 km signal range (over three times more than currently available PONs), 32 times more bandwidth (WDM with up to 32 - 10 Gbps wavelengths), up to 1,024 subscribers per fibre ring.
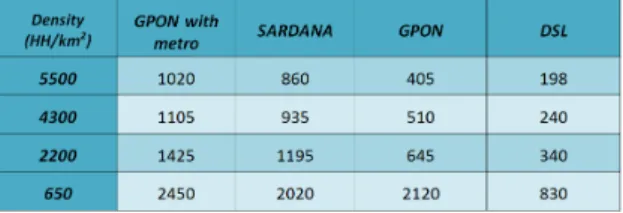
The type of geographical area obviously has an impact on the deployment cost: both the span of the network to deploy for optical solutions and the number of active nodes to operate for DSL solutions depend on the household density of the considered area. In other words, the less dense the area, the more expensive it is to connect a household. Four different household densities are considered: dense urban area with 5500 HH/km2(households per square kilometer) , urban
area with 4300 HH/km2, suburban area with 2200 HH/km2 , rural area with
650 HH/km2.
When performing the techno-economic analysis, different methodologies for calculating the deployment costs should be used for different technologies. In
the present paper, these methodologies can be divided into two groups - pure access networks (DSL and GPON) and metro with access networks (GPON with metro and SARDANA). Capital Expenditures (CAPEX) costs relevant to the DSL (process of moving DSLAMs closer to the user) and GPON technology are divided into feeder cabling and active equipment costs. Active equipment costs per customer associated with GPON consist in dedicated GPON port in OLT (divided by 16, assuming a 1:16 splitting ratio) and ONT cost. In literature [11], it is proved that for the urban area, the outside plan (OSP) costs for GPON network are similar to those associated with active equipment, therefore the final deployment cost of GPON network is fixed at the double cost of the active equipment. The methodology for calculating CAPEX costs for both GPON with metro and SARDANA are similar. CAPEX costs for both GPON with Metro ring and SARDANA are derived from [6]. Other data are based on the data given in [9, 10]. Table 1 recaps CAPEX values for the considered technologies and household densities. According to data given in [12] and [7], the Operational Expenses (OPEX) costs are 13% and 11% for GPON and SARDANA respectively, and 45% for DSL.
Table 1.CAPEX per passed household versus household density
4
Factors Influencing Profitability
This Section addresses separately all the major factors that can affect the prof-itability of a broadband access deployment strategy.
4.1 Public Funding
As mentioned in Section 3, the investment costs depend on the type of consid-ered geographical area. In particular, investment costs are higher and revenues lower in less densely populated areas than in urban areas. This type of deploy-ment is often presented as being simply impossible as private funding by the IAP would not be sufficient. On the other hand, local authorities consider the impact of broadband deployment on future socio-economic development for the covered area. The main motivations behind public investments are stimulating local economy and market competition while improving citizens’ quality of life and making an area more attractive for companies. The Open Access Network
(OAN) model provides multiple opportunities for both end users and local service providers [2]. End users, as a result, have a variety of choices between different services offered for a diversity of prices. Service providers on the other hand can compete as equals on the market. In Europe, local authorities are responsible for a very large part of FTTH networks deployments as shown in Table 2. With 55.7% of all projects as of December 2009 municipalities and power utilities are the most active players, especially in areas where there is no private initiative [2]. Their role is to compensate the lack of interest from the operators in less at-tractive (in terms of business) regions. The impact of public funding is assessed in Sections 6 and 7.
Table 2.Actors involved in FTTH/B rollouts across Europe, as of December 2009 [2]
4.2 Tariffs and Revenue per User
IAPs usually charge a monthly fee for broadband access which may differ de-pending on technology (DSL vs Cable vs FTTx), or offered bandwidth. An alternate way of comparing tariffs consists in considering the tariffs per (downstream) Mbps. A comparison between different European cases (in most cases -incumbent operators offers) was made to give an overview on already available optical access offers. The results are presented in Table 3, which show that the lowest monthly tariffs (both for the offer and per Mbit/s) for the optical access are present on the French market.
The fact that optical access is cheapest in France is due to the fierce competi-tion between the four IAP on the French market (France Telecom, SFR, Free and Numericable), where the simple model of a single monthly charge is prevalent, almost irrespective of supported bandwidth and technology. This makes France the most difficult environment to build a viable business plan for the deploy-ment of new networks, as the revenue per user is the lowest in the EC. In the following, the profitability of various scenarios shall be assessed using Average Revenue Per User (ARPU) values based on the French market tariffs: 30 Euro for optical access (100 Mbps downstream /50 Mbps upstream) and 28 euro for DSL (26 Mbps downstream /3 Mbps upstream).
Table 3.Residential Optical Access Offers in Europe [14–22]
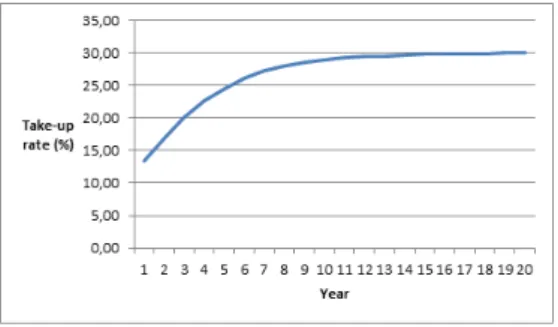
4.3 Take-up Rate
The take-up rate for a given technology offered to a given population is the proportion of the population that subscribes to this offer. Take-up rates were calculated with the Gompertz adoption model. The situation with a maximum of 30% take-up is illustrated in Fig.1. The take-up rate has a huge impact on the profitability of a given broadband access technology. It is highly dependent on whether the considered scenario is “greenfield” (meaning that the considered offer is the first broadband access offer made in the area) or not (a competitor is already present with its own offer). It is well known that greenfield scenarios are more favorable since all potential customers waiting for broadband access are likely to subscribe, whereas competing scenarios are less favorable since the new offer has to be significantly “better” either in terms of tariffs or in terms of delivered performance.
5
DSL vs GPON
We assume here that two companies are competing on the market. One of them is deploying DSL, and the other is deploying GPON; there is no public funding. Table 4 assesses the profitability of both proposals by comparing their payback periods, their NPV and IRR, where the cash margin on retail services is the ARPU decreased by the OPEX. As expected, the denser is the area, the more profitable is the offer. Moreover, DSL is more profitable than GPON, with a sig-nificantly shorter payback period. Lastly neither DSL nor GPON are profitable in rural areas, even after 20 years of operation.
Table 4. Techno-economic comparison of DSL and GPON deployments. The greyed cells in the Table correspond to unprofitable scenarios
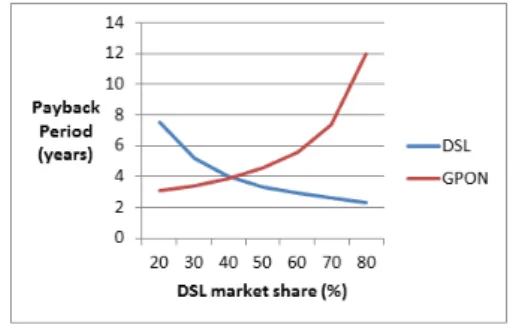
The above results do not argue in favour of optical access, and seem to pre-clude a rapid migration towards optical access. Actually, this is in line with the current low proportion of optical access in the EC. In order to better understand in which conditions optical access would be at least as profitable as DSL access, we then assumed that, in a very dense area (typical of major cities), the whole market (100% of the population) has an access to the broadband connection (DSL or GPON). The variable in this situation is adoption of DSL technology (changing from 20-80% with 10% step). The rest of the market (adoption chang-ing from 80-20% with 10% step) is taken by the GPON. The results are presented in Fig.2 where we can see that the payback period is equal for both situations when the adoption rates are (approximately) 40% for DSL and 60% for GPON. Such a situation is obviously not the current one as the take-up rate for FTTx in 2011 is less than 20% in Europe. What could change this situation?
One obvious factor would be the emergence of new, attractive, bandwidth hungry services that could not be supported by the current DSL technologies. These services have yet to be identified, although the penetration of advanced
Fig. 2. DSL and GPON comparison of the payback period in the function of DSL market share
video services such as 3D and multi-screen services are likely candidates. The increase in upstream traffic could also lead to increasing the optical access take-up rate since the major DSL technology is ADSL, which offers an take-upstream bandwidth significantly smaller than downstream bandwidth. Likely candidates are residential cloud computing services (such as in-cloud storage, or workplace synchronization), which shall indeed require more upstream bandwidth. Another factor would be the deployment of optical access in areas where no broadband access is currently available. However, in France, those areas are the rural areas where the CAPEX is the highest, and profitability the lowest as Table 4 shows. Increasing the ARPU would indeed augment profitability; however, increasing monthly fees for optical access while DSL access would remain as cheap as it is nowadays in France is unrealistic since it would likely still decrease the take-up rate of optical access. The other means for increasing profitability would be to reduce CAPEX either thanks to public funding, or by cooperation between operators, which would thus share infrastructure costs (but would still have to compete in the market). The impact of both ARPU increase and public funding are further addressed in Section 7.
6
Optical Access
We now focus on selecting the most profitable technology for optical broadband access. Different technologies, different business models with different house-holds densities are compared. Since LROA is not simply an access technology, it is compared with a “METRO&GPON” solution where GPON is deployed on optical metro rings on which CO are attached. Whereas [6] only addressed cost analysis, the present work attempts to assess the impact of the selected busi-ness model. The three busibusi-ness models under consideration are: (a) the network is deployed without public money (fully private initiative), (b) the OSP infras-tructure (feeder cabling) is publicly funded (e.g. by a local municipality) while the private actor builds only the “last drop”, (c) Subsidies, covering 50% of the whole network deployment cost are granted.
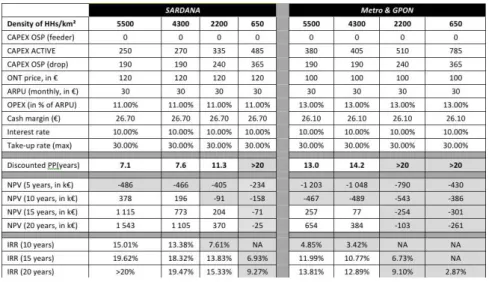
Table 5.Techno-economic comparison Optical access solutions (SARDANA vs Metro-GPON) in the case where the OSP infrastructure is publicly funded. The greyed cells correspond to unprofitable scenarios
The results for a type (b) business model are presented in Table 5. The overall CAPEX was divided into three different costs, due to the strategy of two-step building (in the first step only feeder cabling is deployed and the households are connected in the second step). The lifetime of passive equipment was set to 20 years. Active equipment is replaced every 10 years in Central Office and every 5 years at user end. This study shows that LROA is significantly more profitable than GPON access, even in the favorable case when the OSP infrastructure is publicly funded.
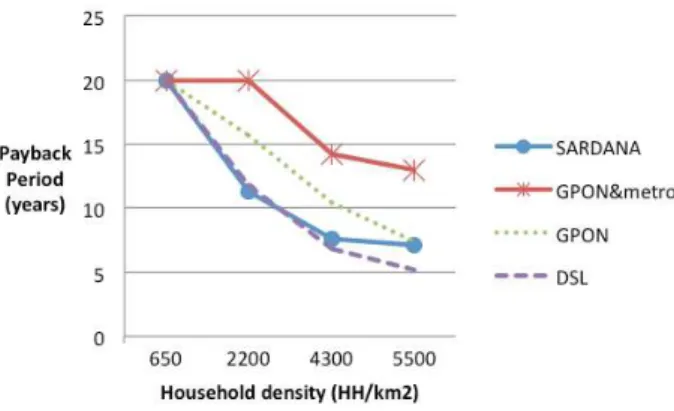
In order to better assess the impact of household density on profitability, a comparison of payback period for different technologies as a function of house-holds density is presented in Fig.3. This comparison is made assuming a green-field case: there is no broadband access offer in the area and the respective profitability of 4 technical solutions are compared.
Fig.3 confirms that there is a significant influence of the geographical data on the investment payback period. Urban areas present a much more cost-effective business case; in particular, in the rural area, no technical solution is profitable in less than 20 years. Moreover, DSL is profitable in 10 years or less in all other cases, and is consistently cheaper than all other solutions, except SARDANA, which is as profitable as DSL in the suburban area.
7
Analysis of GPON deployment in Brittany
This Section reports an assessment of the profitability of GPON access in the largest cities of Brittany: Rennes, Brest, Quimper, Lorient, Vannes, Saint-Malo, Saint-Brieuc, Lanester, Lannion, Fougeres, Concarnneau and 12 others (with an
Fig. 3.Payback periods for different technologies in the function of household density
average population of 15,000). Although the largest towns can be considered as urban or suburban areas, most of them are in rural areas.
To compare the influence of the two different factors - geographical and ARPU, three different options were considered:
– Option I : all the cities were included, ARPU was fixed at 30 euro,
– Option II : all the cities , except those in rural areas, were included, and ARPU was fixed at 30 euro,
– Option III : all the cities , except those in rural areas, were included, and ARPU was fixed at 35 euro.
Table 6.Comparison of different GPON deployment solutions in Brittany
The results are presented in Table 6 and prove that geographical data has a significant influence on the investment profitability. The cities in the rural areas are characterized by a low density of households, therefore they increase the overall cost of the project; on the other hand, they represent roughly 40% of the considered population. Deploying optical access in all cities, including those in
rural areas is not profitable, even after 20 years, which shows that public funding is in that case almost mandatory, as long as the take up rate is 30% or less. On the other hand, the study shows that proposing optical access in urban, or even suburban areas is profitable, and that a small increase of ARPU significantly limits the payback period results.
8
Conclusion
Calculations for deploying a new optical access network by a telecom company were made for the French telecommunications market. Different markets are characterized by different factors. The most important input data utilized for the calculations that will differ for other countries is most of all ARPU and take-up rates. Those factors are critical for the investment, therefore different markets can offer different business opportunities.
The results obtained in the present study and shown in Table 4 and Table 5 show, that for suburban (2200 HH/km2) and rural (650 HH/km2) areas, the
payback periods are longer than 10 or even 20 years, whereas, according to [13], 8-10 years is a reasonable payback period for fixed networks. However, when cooperation between private and public actor (Public Private Partnership) is established, the results show that it is possible to build a viable business plan, even for the particularly demanding French market.
We have also shown that Optical Access is unlikely to overcome DSL in dense areas unless new bandwidth hungry applications have to be supported. In particular we have shown that the payback period is equal for both DSL and GPON when the adoption rates are (approximately) 40% for DSL and 60% for GPON, which is currently not the case.
We have also shown that a cutting-edge technology such as LROA that pro-poses to merge the access network with part of the metro network is significantly more profitable than the straightforward replacement of copper based DSL ac-cess with optical acac-cess such as GPON, at least in the urban and suburban areas.
Lastly, it seems that the deployment of broadband access in rural areas using fixed network technology such as DSL or GPON is only profitable for IAP if public funding partly covers the costs.
References
1. SARDANA and the bandwidth boom, Tellabs Insight, p. 3, Q1 2011.
2. FTTx 2001 - Market Trends, Facts and Figures, IDATE, Montpellier Cedex 5, France, 2011.
3. European Commission Information society - Digital Agenda for Europe,, [Available Online]. [Accessed 2 December 2011].
4. Ioannis Tomkos, Techno-economic comparison of next generation optical access network architectures, 50th FITCE Congress (FITCE), August 31 2011-September 3 2011.
5. M. Kantor, K. Wajda, B. Lannoo, K. Casier, S. Verbrugge, M. Pickavet, L. Wosin-ska, J. Chen, A. Mitcsenkov General framework for techno-economic analysis of next generation access networks published in 12th International Conference on Transparent Optical Networks (ICTON 2010), Munich, Germany, 27 June - 01 July 2010, pp. Mo.C4.2
6. Sotiria Chatzi, Jose A. Lazaro, Josep Prat, Ioannis Tomkos, Techno-economic com-parison of current and next generation long reach optical access networks 9th Con-ference on Telecommunications Internet and Media Techno Economics (CTTE), 2010 , pp.1-6, 7-9 June 2010.
7. Koen Casier Techno-Economic Evaluation of a Next Generation Access Network Deployment in a Competitive Setting,PhD Thesis, University of Ghent, Defended on October 8th 2009.
8. J. Prat, J. Segarra, V. Sales. J.A. Lazaro, P. Chanclou, P. Soila, S. Spirou, A. Teixeira, G.M. Tosi-Beleffi, I. Tomkos, SARDANA: an all-optical access-metro WDM/TDM-PON, 49th FITCE Congress (FITCE), September 3 2010.
9. Cost analysis for DSL Networks, [Online]. Available:
http://www.ictregulationtoolkit.org/en/PracticeNote.aspx?id=2899. [Accessed 11 3 2012].
10. Prof. Dr. Steffen Hoernig, Stephan Jay, Dr. Karl-Heinz Neumann, Prof. Dr. Martin Peitz, Dr. Thomas Plckebaum, Prof. Dr. Ingo Vogelsang, The universal connectivity revolution, WIK-Consult, Bad Honnef, December 2010.
11. Bart Lannoo, Kun Wang, Claus Popp Larsen, Anders Gavler, Mikhail Popov, Dominique Chiaroni, ALPHA reference model for techno-economics in access net-works, in FTTH Conference, Milan, February 2011.
12. Steve Klein, 10 Steps to Improve FTTH OPEX, in FTTH Conference and Expo, 2009.
13. T. Rokkas, D. Katsianis, D. Varoutas, Techno-economic Evaluation of FTTC/VDSL and FTTH rollout scenarios: Discounted Cash Flows and Real Op-tion EvaluaOp-tion, IEEE, September 2010.
14. Belgacom Private offer, Belgacom, [Online]. Available: http://www.belgacom.be. [Accessed 30 December 2011].
15. Skift hastighed, TDC, [Online]. Available: http://privat.tdc.dk. [Accessed 30 De-cember 2011].
16. Unsere schnellste DSL-Verbindung, Deutsche Telecom, [Online]. Available: http://www.telekom.de. [Accessed 30 December 2011].
17. Telecom Italia Fibra: 100 Mega da 45,38 euro al mese, [Online]. Available: http://www.tomshw.it/cont/news/telecom-italia-fibra-100-mega-da-45-38-euro-al-mese/34492/1.html. [Accessed 30 December 2011].
18. Fiber Power 120 Mb Internet, UPC, [Online]. Available: http://www.upc.nl/internet/120-mb-internet/. [Accessed 30 December 2011]. 19. Acerca de la Fibra, Movistar, [Online]. Available: http://www.movistar.es.
[Ac-cessed 30 December 2011].
20. Privat Bredband, TeliaSonera, [Online]. Available:
http://www.telia.se/privat/bredband/. [Accessed 30 December 2011].
21. Up to 100Mb broadband, Virgine media, [Online]. Available: http://shop.virginmedia.com/broadband/up-to-100mb.html. [Accessed 30 Decem-ber 2011].
22. les offres internet ADSL et Fibre optique d’Orange, Orange, [Online]. Avail-able: http://abonnez-vous.orange.fr/residentiel/accueil/accueil.aspx?idb=1. [Ac-cessed 30 December 2011].
![Table 2. Actors involved in FTTH/B rollouts across Europe, as of December 2009 [2]](https://thumb-eu.123doks.com/thumbv2/123doknet/12477175.338307/6.892.302.617.413.583/table-actors-involved-ftth-b-rollouts-europe-december.webp)