HAL Id: hal-01664909
https://hal.archives-ouvertes.fr/hal-01664909
Submitted on 15 Dec 2017
HAL is a multi-disciplinary open access
archive for the deposit and dissemination of
sci-entific research documents, whether they are
pub-lished or not. The documents may come from
teaching and research institutions in France or
abroad, or from public or private research centers.
L’archive ouverte pluridisciplinaire HAL, est
destinée au dépôt et à la diffusion de documents
scientifiques de niveau recherche, publiés ou non,
émanant des établissements d’enseignement et de
recherche français ou étrangers, des laboratoires
publics ou privés.
stoichiometry of particulate matter in the naturally iron
fertilized region of Kerguelen in the Southern Ocean
M. Lasbleiz, Karine Leblanc, S. Blain, J. Ras, Veronique Cornet, S. Hélias
Nunige, Bernard Queguiner
To cite this version:
M. Lasbleiz, Karine Leblanc, S. Blain, J. Ras, Veronique Cornet, et al.. Pigments, elemental
compo-sition (C, N, P, and Si), and stoichiometry of particulate matter in the naturally iron fertilized region
of Kerguelen in the Southern Ocean. Biogeosciences, European Geosciences Union, 2014, 11 (20),
pp.5931-5955. �10.5194/bg-11-5931-2014�. �hal-01664909�
www.biogeosciences.net/11/5931/2014/ doi:10.5194/bg-11-5931-2014
© Author(s) 2014. CC Attribution 3.0 License.
Pigments, elemental composition (C, N, P, and Si), and
stoichiometry of particulate matter in the naturally iron fertilized
region of Kerguelen in the Southern Ocean
M. Lasbleiz1, K. Leblanc1, S. Blain2,3, J. Ras4,5, V. Cornet-Barthaux1, S. Hélias Nunige1, and B. Quéguiner1
1Aix-Marseille Université, Université de Toulon, CNRS/INSU, IRD, MIO, UM 110, 13288, Marseille, CEDEX 09, France 2Sorbonne Universités, UPMC Univ Paris 06, UMR 7621, Laboratoire d’Océanographie Microbienne, Observatoire
Océanologique, 66650 Banyuls-sur-mer, France
3CNRS, UMR 7621, Laboratoire d’Océanographie Microbienne, Observatoire Océanologique,
66650 Banyuls-sur-mer, France
4Laboratoire d’Océanographie de Villefranche, UMR7093, CNRS, 06230 Villefranche-sur-Mer, France 5Université Pierre et Marie Curie (Paris-6), Unité Mixte de Recherche 7093, Laboratoire d’Océanographie de
Villefranche-sur-Mer, 06230, Villefranche-sur-Mer, France
Correspondence to: M. Lasbleiz (marine.lasbleiz@univ-amu.fr)
Received: 20 May 2014 – Published in Biogeosciences Discuss.: 5 June 2014
Revised: 8 September 2014 – Accepted: 10 September 2014 – Published: 30 October 2014
Abstract. The particulate matter distribution and phyto-plankton community structure of the iron-fertilized Ker-guelen region were investigated in early austral spring (October–November 2011) during the KEOPS2 cruise. The iron-fertilized region was characterized by a com-plex mesoscale circulation resulting in a patchy distribu-tion of particulate matter. Integrated concentradistribu-tions over 200 m ranged from 72.2 to 317.7 mg m−2for chlorophyll a 314 to 744 mmol m−2 for biogenic silica (BSi), 1106 to 2268 mmol m−2 for particulate organic carbon, 215 to 436 mmol m−2 for particulate organic nitrogen, and 29.3 to 39.0 mmol m−2 for particulate organic phosphorus. Three distinct high biomass areas were identified: the coastal wa-ters of Kerguelen Islands, the easternmost part of the study area in the polar front zone, and the southeastern Kergue-len Plateau. As expected from previous artificial and natural iron-fertilization experiments, the iron-fertilized areas were characterized by the development of large diatoms revealed by BSi size–fractionation and high performance liquid chro-matography (HPLC) pigment signatures, whereas the iron-limited reference area was associated with a low biomass dominated by a mixed (nanoflagellates and diatoms) phy-toplankton assemblage. A major difference from most pre-vious artificial iron fertilization studies was the observation
of much higher Si : C, Si : N, and Si : P ratios (0.31 ± 0.16, 1.6 ± 0.7 and 20.5 ± 7.9, respectively) in the iron-fertilized areas compared to the iron-limited reference station (0.13, 1.1, and 5.8, respectively). A second difference is the patchy response of the elemental composition of phytoplankton communities to large scale natural iron fertilization. Com-parison to the previous KEOPS1 cruise also allowed to ad-dress the seasonal dynamics of phytoplankton bloom over the southeastern plateau. From particulate organic carbon (POC), particulate organic nitrogen (PON), and BSi evolu-tions, we showed that the elemental composition of the par-ticulate matter also varies at the seasonal scale. This temporal evolution followed changes of the phytoplankton community structure as well as major changes in the nutrient stocks pro-gressively leading to silicic acid exhaustion at the end of the productive season.
Our observations suggest that the specific response of phy-toplankton communities under natural iron fertilization is much more diverse than what has been regularly observed in artificial iron fertilization experiments and that the elemen-tal composition of the bulk particulate matter reflects phyto-plankton taxonomic structure rather than being a direct con-sequence of iron availability.
1 Introduction
Considered to be the largest high-nutrient-low-chlorophyll (HNLC) region in the world, the Southern Ocean is charac-terized by low phytoplankton productivity despite nutrient-rich waters (Martin et al., 1991; Sarmiento et al., 2004). The “Iron Hypothesis” is now largely acknowledged to explain this paradox. Martin et al. (1991) estimated that new pro-duction could be enhanced about 30-fold under iron-replete conditions and could thus stimulate the export of carbon (C) to the deep ocean by fixing atmospheric CO2. This
hypoth-esis motivated several artificial iron (Fe) enrichment experi-ments in different HNLC areas all over the world (Boyd et al., 1999; Takeda, 1998; de Baar et al., 2005; Boyd, 2007; Smetacek et al., 2012). All of these studies confirmed that ad-dition of Fe-stimulated phytoplankton growth, but only one of them postulated an enhanced C sequestration on the sea floor (Smetacek et al., 2012). This could result from experi-mental artifacts, and especially from the shorter duration of experiments compared to that of vertical export processes.
To overcome those experimental constraints, the concept of “natural fertilization laboratory” was coined by Blain et al. (2007). The objective was to investigate the response of ecosystem functioning and biogeochemical cycles in a nat-urally iron-fertilized system by comparison with a nearby typical HNLC environment. In the early 2000s, five projects addressed this concept in different regions of the Southern Ocean: the KErguelen Ocean and Plateau compared Study (KEOPS1) (Blain et al., 2007), the CROZet natural iron bloom and EXport experiment (CROZEX) (Pollard et al., 2009), the Blue Water Zone (BWZ) program (Zhou et al., 2010, 2013), the Discovery 2010 cruises (Tarling et al., 2012), and the Dynamic Light on Fe limitation (DynaLiFe) project (Arrigo and Alderkamp, 2012). Each of these stud-ies focused on recurrent seasonal blooming regions charac-terized by large bathymetric discontinuities (such as ridges, islands and/or submarine plateaus) and strong hydrodynamic forcings (especially geostrophic fronts), which together in-teract and generate natural iron inputs to surface waters. The natural iron enrichment experiments consistently ver-ified an enhanced efficiency of C export within the natu-rally Fe-fertilized systems which was approximately 3 times higher than in the surrounding Fe-limited areas (Morris and Charette, 2013). However, some gaps still persist regarding the understanding of the factors controlling the dynamics of phytoplankton blooms in naturally Fe-fertilized systems of the Southern Ocean.
Previous studies in the literature have documented the in-fluence of iron on both the structure and the elemental ratios of phytoplankton communities. The phytoplankton commu-nity structure is known to directly impact the fate of carbon through sinking rates depending on various factors such as cell size, ballast minerals, transparent exopolymers (TEP), or (re)packaging in zooplankton fecal pellets (Margalef, 1965; Falkowski et al., 2003; Legendre and Le Fèvre, 1989;
Arm-strong et al., 2009). Artificial and natural iron-fertilization experiments evidenced the preferential development of large diatoms (> 20 µm) under iron-replete conditions (Hutchins and Bruland, 1998; Takeda, 1998; Hare et al., 2005; Armand et al., 2008; Timmermans et al., 2008). In a recent review pa-per, Quéguiner (2013) proposed a conceptual general scheme for phytoplankton development in naturally Fe-fertilized sys-tems where phytoplankton are separated into two groups oc-cupying different niches in the water column according to their adaptation to limiting proximal factors (iron, silicic acid, and light) and their resistance to grazing by micro- and mesozooplankton. Diatoms are responsible for more than 40 % of the global oceanic primary production (Nelson et al., 1995). Large diatoms favor the export and sequestration of carbon (Nelson et al., 1995; Buesseler, 1998). Diatom growth can be controlled by silicic acid (H4SiO4)availability, an
essential nutrient for the formation of diatom frustules. To-gether Fe and H4SiO4could be co-limiting (Dugdale et al.,
1995) and could directly alter the stoichiometry of biogenic matter by influencing the uptake rates of major elements. Both artificial and natural iron-fertilization experiments re-ported higher Si : C, Si : N and Si : P ratios under Fe-stress compared to Fe-replete conditions (Hutchins and Bruland, 1998; Franck et al., 2000; Moore et al., 2007). Thus, Fe lim-itation seemed to promote the development of more heavily silicified diatoms by strongly enhancing the Si compared to C and N uptake rates (de Baar et al., 1997; Firme et al., 2003). However, some exceptions were soon documented. For ex-ample, Hutchins and Bruland (1998) observed that Fe could sometimes limit phytoplankton growth without changing the Si : C and Si : N ratios. The control of phytoplankton elemen-tal ratios in response to iron availability therefore remains poorly understood, which clearly calls for new observations. During the first KEOPS cruise (KEOPS1), conducted in January–February 2005, the impact of iron on H4SiO4 and
nitrate (NO−3)utilization by diatoms was investigated in the southeastern part of the naturally iron-fertilized Kerguelen Plateau (Mosseri et al., 2008; Timmermans et al., 2008). In this area, an annual bloom of diatoms depleting dissolved inorganic carbon (DIC) in surface waters (Jouandet et al., 2008) is sustained by continuous iron inputs at the surface thanks to the enhanced vertical inputs of iron-rich deep wa-ters from the plateau (Blain et al., 2007; Park et al., 2008a). Unexpectedly, Mosseri et al. (2008) reported moderate dif-ferences in elemental ratios (Si : C : N) of the particulate mat-ter between Fe-fertilized wamat-ters and HNLC wamat-ters. This ob-servation was attributed to the combined effects of the pres-ence of an already decaying diatom bloom over the plateau, and the presence of heavily silicified diatoms in HNLC wa-ters. H4SiO4: DIC and H4SiO4: NO−3 elemental uptake
ra-tios of the natural diatom community of the plateau were close to 0.13 and 1, respectively, as expected for diatoms growing in nutrient-replete conditions (Hutchins and Bru-land, 1998; Takeda, 1998). However, the high NO−3 concen-trations in surface waters compared to H4SiO4 depletion at
the end of the bloom suggested a strong decoupling between the seasonal consumption of these two nutrients. According to Mosseri et al. (2008), this could be due to differential remineralization between Si and N and by the capacity of diatoms to grow preferentially on ammonium, thereby pre-venting the complete utilization of the winter NO−3 stock. In the context of the “silicic acid leakage hypothesis” of Mat-sumoto et al. (2002), this unexpected decoupling between H4SiO4 and NO−3 consumptions, if extended over the
en-tire permanently open ocean zone (POOZ) of the Southern Ocean, could have large implications at global scale in the control of low latitude productivity and phytoplankton as-semblages (Sarmiento et al., 2004). Moreover, understand-ing this decouplunderstand-ing is of critical importance to assess the ef-ficiency of Fe fertilization in terms of DIC uptake at regional and global scales.
In order to follow up on KEOPS1 observations, the sec-ond KEOPS cruise (KEOPS2) was csec-onducted in the naturally iron-fertilized region of Kerguelen Plateau (KP) during aus-tral spring (October–November) 2011. Focused east of the Kerguelen Islands (KI), the study investigated the biogeo-chemical cycles and phytoplankton community structures in contrasted environments differently impacted by iron avail-ability and mesoscale activity. In this paper, we examine the particulate matter distribution in relation to the phytoplank-ton community structure in these contrasted environments. By combining KEOPS1 data corresponding to the late stage of the bloom, the temporal evolution of phytoplankton com-munity over the KP will be documented during the entire blooming period. The aim is to assess the seasonal degree of coupling between C, N, P, and Si cycles to better understand the seasonal dynamics of phytoplankton blooms in naturally Fe-fertilized region. The use of lithogenic silica as a proxy for lithogenic matter is discussed to track potential sources of Fe in the KP region.
2 Method
2.1 Sampling strategy
The KEOPS2 cruise was conducted in austral spring from 10 October to 20 November 2011 aboard the R/V Marion
Dufresne (TAAF/IPEV). This research project was focused
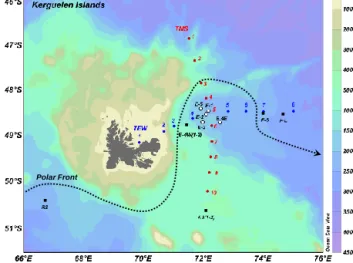
east of the KP which is characterized by the passage of the polar front (PF), as illustrated in Fig. 1. The KP region is sur-rounded by the Antarctic Circumpolar Current (ACC) whose main branch circulates to the north of the plateau (Park et al., 2008b). A southern branch of the ACC circulates to the south of Kerguelen Islands to further join a branch of the Fawn Trough Current (FTC). The FTC has a main northeast direction, but a minor branch splits away northwestward to rejoin the eastern side of the KP (Park et al., 2008b). These particular hydrographic features generate contrasted environ-ments which are differently impacted by iron availability and
Figure 1 Polar Front
Figure 1. Location of the sampling stations. Transects from North
to South (TNS) and from west to the east (TEW) are indicated in red and blue, respectively. The blank filled circles correspond to a time-series of a recirculation system (1, 2, 3, 4E, and E-5). The stations F-L and F-S are located in the eastern bloom in the polar front zone. A3 and E-4W are the reference southeastern guelen Plateau bloom and the reference eastern flank of the Ker-guelen Plateau, respectively. Both were visited twice (1–2). R2 is the HNLC reference station. The dotted line represents the approx-imate location of the southern branch of the polar front.
mesoscale activity. Among these contrasted environments, KEOPS2 focused on the northeastern Kerguelen bloom (E stations), the eastern bloom (F-L and F-S stations) in the po-lar front zone (PFZ), and the southeastern KP bloom (A3 sta-tion). The latter was visited twice (1 in October and A3-2 in November) at a reference station that had been already studied during the KEOPS1 cruise. For comparison, the sta-tion R2 was considered to be representative of the HNLC off-plateau area. A temporal evolution study of the northeast-ern Kerguelen bloom was led on the complex recirculation system located in a stationary meander of the PF. This site (referred as stations E including 1, 2, 3, 4E and E-5) was visited five times in the course of the cruise. Across this complex system, two transects were sampled to get a de-tailed description of the biogeochemical parameters of the eastern Kerguelen area. The first transect, oriented south to north (TNS), was sampled from 21 to 23 October; the second transect, oriented west to east (TEW), was sampled from 31 October to 2 November.
Seawater samples were collected using a Seabird SBE 911-plus CTD unit mounted on a 24 12 L bottles rosette. A total of 30 different stations were sampled for analysis of par-ticulate (biogenic and lithogenic) silica, parpar-ticulate organic matter (carbon, nitrogen, and phosphorus) and biomarker pigments. Sampling was performed at 6 to 24 depths over the water column and covered a wide range of bottom depths from 84 to 2786 m above and off the plateau, respectively.
2.2 Biogenic and lithogenic silica stocks
For particulate silica analyses, size fractionation was per-fomed by filtering 2 L seawater onto stacked 0.8 and 20 µm Nucleopore® polycarbonate filters simultaneously. Samples were folded into four sections and stored in Eppendorf vials, dried overnight at 60◦C before being closed and stored at room temperature. Biogenic silica (BSi) and lithogenic sil-ica (LSi) were measured following the triple extraction pro-cedure described by Ragueneau et al. (2005). Dried filters were digested two times at 95◦C for 45 mn with an analy-sis of both Si and Al concentrations at each step. In order to correct BSi for LSi contamination, particulate aluminum was measured in parallel by the Lumogallion fluorescence method of Hydes and Liss (1976) adapted by Howard et al. (1986). After the double alkaline digestion, a third extrac-tion in 2.9 mol L−1hydrofluoric acid was performed on dried filters during 48 h. Blank values were 1.0 ± 0.2 nmol L−1for BSi, 16 ± 7 nmol L−1 for LSi and 24 ± 9 nmol L−1 for par-ticulate Al. This implied detection limits, defined by the sum of the average blank value plus 3 times the standard devia-tion of the blanks: of 1.6, 37 and 51 nmol L−1for BSi , LSi, and particulate Al, respectively. For some samples, Al con-centrations analyzed after the second NaOH extraction were inferior to the detection limit. These samples were also char-acterized by the lowest LSi concentrations. The correction of the lithogenic interference is only valid considering that Al content of diatom frustules is negligible as compared to that of LSi (Schlüter and Rickert, 1998). According to Rague-neau et al. (2005), in the case of low LSi concentrations, as in open ocean waters, the interference of diatom Al may overes-timate LSi concentrations. For these reasons, we decided not to apply the Al correction for samples with Al concentrations below the quantification limit, defined by the sum of the av-erage blank value plus 10 times the standard deviation of the blanks (114 nmol L−1). This concerns especially off-plateau stations far from the influence of Kerguelen Islands.
2.3 Particulate organic carbon (POC), nitrogen (PON), and phosphorus (POP)
For POC and PON measurements, 1 L seawater samples were collected. For POP measurements 0.5 L seawater sam-ples were collected. Samsam-ples were filtered onboard on 25 mm Whatman GF/F filters (precombusted at 450◦C) and stored in precombusted glass vials. Filters were dried sev-eral days at 60◦C, then sealed with an aluminium cap
and stored at room temperature. In order to remove inor-ganic carbon, POC/PON filters were acidified with fum-ing HCl. Finally, POC and PON concentrations were de-termined using the combustion method of Strickland and Parsons (1972) on an EA 2400 CHN Analyzer. POP fil-ters were digested following the wet oxidation method de-scribed by Pujo-Pay and Raimbault (1994). Extracts were clarified through 0.2 µm Nucleopore® polycarbonate filters
before being analyzed on a 3-SEAL autoanalyzer. Blanks were 1.27 ± 0.26 µmol L−1 for POC, 0.06 ± 0.02 µmol L−1
for PON and 0.011 ± 0.005 µmol L−1 for POP. The
detec-tion limits, defined as above, were 2.05 and 0.12 µmol L−1 for POC and PON and 0.026 µmol L−1for POP. Most sam-ples collected below 100 m showed POC concentrations in-ferior to the quantification limit (3.87 µmol L−1). To com-pare integrated concentrations of particulate matter over the same depth (200 m), we decided to estimate these low POC concentrations as the minimum detectable concentra-tion (2.05 µmol L−1). This approximation seems reasonable considering that PON and POP standing stocks were mostly concentrated in the upper 100 m.
2.4 Pigment measurements
For pigment analyses, seawater samples were filtered through 25 mm Whatman GF/F filters. The filtered volumes varied from 1 to 2.2 L according to the charge in parti-cles. Filters were then placed in cryotubes and stored in liquid nitrogen. In the laboratory, pigments were extracted and analyzed following the procedure of Van Heukelem and Thomas (2001), modified by Ras et al. (2008). Fil-ters were extracted in 3 mL methanol (100 %) for 2 h at
−20◦C. The extracts were then vacuum-filtered onto What-man GF/F filters. Within 24 h of extraction, extracts were an-alyzed by high-performance liquid chromatography (HPLC) with a complete Agilent Technologies 1200 series system. Separation of pigments was performed by means of a re-versed phase C8 Zorbax Eclipse XDB column (3 × 150 mm; 3.5 µm particle size). Concentrations were calculated from the peak area obtained by diode array detection at 450 nm for carotenoids, chlorophylls c and b, 667 nm for chloro-phyll a and derived pigments and 770 nm for bacteriochloro-phyll a. An internal standard correction (vitamin E acetate, sigma) and external calibration standards (provided by DHI Water and Environment in Denmark) were applied for cal-culations of pigment concentrations. This method enabled detection of 25 pigments with low detection limits (vary-ing from 0.1 ng L−1 for chlorophyll b to 0.4 ng L−1 for chlorophyll a and alloxanthin, considering a filtered vol-ume of 1 L of seawater). Following the methods of Claus-tre (1994) and Vidussi et al. (2001) modified by Uitz et al. (2006), seven diagnostic pigments were used as biomark-ers of specific phytoplankton taxa to assess the contribution of three pigment-based size classes (micro-, nano-, and pi-cophytoplankton) to the total phytoplankton biomass. The seven pigments are fucoxanthin (Fuco), peridinin (Peri), al-loxanthin (Allo), 190-butanoyloxyfucoxanthin (190BF), 190 -hexanoyloxyfucoxanthin (190HF), zeaxanthin (Zea), and to-tal chlorophyll b (TChl b). Microphytoplankton (> 20 µm) is associated with Fuco and Peri pigments. Nanophytoplank-ton (2–20 µm) is associated with Allo, 190BF and 190HF pig-ments. Picophytoplankton (< 2 µm) is associated with Zea and TChl b pigments.
Figure 2. Oce a n Da ta V ie w Longitude ( E) Longitude ( E) 350 300 250 200 150 100 50 100 90 80 70 60 50 40 100 80 60 40 20 0 100 80 60 40 20 0 66 E 68 E 70 E 72 E 74 E 76 E 66 E 68 E 70 E 72 E 74 E 76 E La ti tud e ( S) 47 S 48 S 49 S 50 S 51 S La ti tud e ( S) 47 S 48 S 49 S 50 S 51 S % mg m-2 % % 6 R2 A3-1 TNS 1 2 3 4 5 6 7 8 9 10 TEW 2 1 3 5 7 8 4 E-2 F -S F-L Polar Front a) Chlorophyll a 6 R2 A3-1 TNS 1 2 3 4 5 6 7 8 9 10 TEW 2 1 3 5 7 8 4 E-2 F -S F-L Polar Front b) Microphytoplankton 6 R2 A3-1 TNS 1 2 3 4 5 6 7 8 9 10 TEW 2 1 3 5 7 8 4 E-2 F-S F-L Polar Front c) Nanophytoplankton 6 R2 A3-1 TNS 1 2 3 4 5 6 7 8 9 10 TEW 2 1 3 5 7 8 4 E-2 F-S F-L Polar Front d) Picophytoplankton
Figure 2. Distribution of depth-integrated total chlorophyll a (a) and contribution of micro- (b), nano- (c), picophytoplankton (d)
commu-nities to total biomass. Vertical integrations were made from the surface to 200 m except for the coastal stations TEW-1 and TEW-2 where data were integrated down to 70 m. The TNS transect (comprising station A3-1) was sampled from 20 to 23 October, while the TEW tran-sect (comprising station E-2) was sampled between 31 October and 2 November. Station R2 was sampled between the two trantran-sects on 25 October, while stations F were sampled after the two transects, on 6 November (F-L), and 8 November (F-S). The dashed line represents the polar front trajectory.
3 Results
3.1 Phytoplankton pigments: biomass and community composition
3.1.1 Spatial variability over the study area
The study area was characterized by a heterogeneous distri-bution of vertically integrated chlorophyll a concentrations (chlorophyll a, in Fig. 2a). It is important to keep in mind that this overview of the study area was also influenced by the rapid temporal evolution of the phytoplankton blooms. The TNS transect and station A3-1 were sampled at the start of the bloom, 10 days before sampling the TEW transect in-cluding stations F-L and F-S. Satellite images (d’Ovidio et al., 2012) revealed that during the TEW transect, the bloom was rapidly developing with a large spatial heterogeneity.
The lowest integrated chlorophyll a concentrations were found at the off-plateau stations R2 (39.0 mg m−2)and TNS-1 (52.TNS-1 mg m−2). Maximum concentrations were observed at TEW-7 (223.0 mg m−2)and F-L (353.8 mg m−2), evidenc-ing a very high phytoplankton biomass in the PFZ. The po-lar front clearly isolated these very high chlorophyll a wa-ters from comparatively lower chlorophyll a southern wawa-ters (ranging from 100.0 to 187.7 mg m−2).
In the same way, the study area was characterized by a het-erogeneous distribution of phytoplankton communities as re-vealed by pigment biomarkers (Fig. 2b, c and d). The phyto-plankton community was mainly dominated by microphyto-plankton (representing on average 83 % of total chlorophyll a biomass) all over the study area. The microphytoplankton contribution was however clearly lower at stations R2 and TNS-1 (47 and 39 % of total chlorophyll a biomass, re-spectively) due to a higher proportion of nanophytoplankton (39 and 41 % of total chlorophyll a biomass, respectively). Stations TNS-1 and TNS-2 also departed from this general trend by exhibiting a higher picophytoplankton contribution (∼ 20 % of total chlorophyll a biomass) as compared to the other stations (< 10 % of total chlorophyll a biomass).
Chlorophyll a : Fuco ratios (2.3 ± 0.4; data not shown) were within the typical range of values (1.1 to 2.3) for di-atoms (Wright and Jeffrey, 1987; Tester et al., 1995; Ediger et al., 2001) except for the off-plateau stations R2 and TNS-1, where higher ratios (4.3 ± 0.8) were found. Fucoxanthin is the dominant biomarker for diatoms but is also found in some prymnesiophytes (e.g., Phaeocystis sp.), chrysophytes (e.g., silicoflagellates such as Dictyocha sp.) and dinoflagel-lates. The very low concentrations in 190BF, 190HF and
peri-dinin at all stations (ranging from 0.8 to 9.7, 1.9 to 12.8 and 0.4 to 3.2 mg m−2, respectively) compared to fucoxanthin
Figure 3. D ep th (m) 0 50 100 150 200 D ep th (m) 0 50 100 150 200 C hl a (mg. m -3) Fu co xan thin (mg. m -3) 3.0 2.0 1.5 0.5 0 1.0 2.5 Latitude ( S)
Ocean Data View
47 S 48 S 49 S 50 S 6 4 2 0 5 3 1
Figure 3. Vertical distribution of total chlorophyll a (chl a) and
fucoxanthin concentrations along the TNS transect. The dashed line represents the approximate location of the southern branch of the polar front (PF).
(20.9 to 160.2 mg m−2)clearly evidence the dominance of
diatoms over the other classes of phytoplankton all over the study area, except at R2 and TNS-1. At these stations, chlorophyll a : 190BF (12.0 ± 1.4) and chlorophyll a : 190HF (4.4 ± 0.1) ratios were the lowest of the study area, reflecting the higher contribution of nanoflagellates to the phytoplank-ton community (data not shown).
3.1.2 Vertical distributions along transects TNS and TEW
The vertical distribution of chlorophyll a along transects TNS and TEW are presented in Figs. 3 and 4, respectively. For both transects, the higher concentrations (> 0.5 mg m−3)
were restricted to the upper 150 m and were clearly domi-nated by microphytoplankton communities.
At the beginning of the bloom, chlorophyll a concentra-tions ranged from 0.5 to 1.5 mg m−3 in the upper 100 m from 3 to 6 and in the upper 180 m from TNS-7 to TNS-10 following the mixed layer depth (Fig. 3). North of the PF, chlorophyll a concentrations were lower reach-ing 0.6 mg m−3in the upper 60 m at TNS-2 and 0.3 mg m−3 over 200 m depth at TNS-1. TNS-1 was very different from the rest of the transect with higher contributions of nanophy-toplankton over 150 m (20 to 50 % contribution to total biomass depending on depth; Fig. 5). Ten days later, higher phytoplankton biomasses (up to 5.0 mg m−3)were observed in the PF area between TEW-7 and TEW-8 (Fig. 4). Ver-tical profiles clearly evidenced the PF influence which iso-lated very high chlorophyll a waters to the north from com-paratively lower chlorophyll a waters to the south. The coastal station TEW-1 was also characterized by very high chlorophyll a concentrations within the first 40 m (up to
Figure 4. C hl a (m g. m -3) D ep th (m) Fu co xan thin (mg. m -3) NPF SPF
Ocean Data View 6 4 2 0 3.0 2.0 1.5 0.5 0 1.0 2.5 70 E 71 E 72 E 73 E 74 E Longitude ( E) 0 50 100 150 200 D e p th (m) 0 50 100 150 200 5 3 1
Figure 4. Vertical distribution of total chlorophyll a (chl a) and
fu-coxanthin concentrations along the TEW transect. The dashed lines represent the approximate location of the southern branch of the polar front going to the north (NPF) and to the south (SPF).
4.7 mg m−3). As shown by satellite images (d’Ovidio et
al., 2012), TEW-1 already supported a large phytoplank-ton bloom before the beginning of the cruise, likely due to precocious favorable growth conditions in the coastal zone. The latter was separated from the off-plateau waters by the southern branch of the PF circulating along the shelf-break between TEW-3 and TEW-4. The PF signature along the shelf break was defined by lower chlorophyll a concentra-tions (< 1.0 mg m−3). Maximum concentrations in fucoxan-thin (2.0 to 2.5 mg m−3)were similarly found for both the eastern area north of the PF and at station TEW-1, indicating the dominance by diatoms (Fig. 6). The core of the TEW transect (TEW-4 to TEW-6) was characterized by chloro-phyll a concentrations ranging from 1.0 to 1.5 mg m−3 at the surface and a significant increase of the nanophytoplank-ton contribution to the total biomass (20 to 30 %; Fig. 6). An increased grazing activity was evidenced at TEW-7 and TEW-8 by relatively higher concentrations in phaeopigments (Phaeo); the ratio of Phaeo to chlorophyll a was indeed higher (0.3) at these sites as compared to all other stations (< 0.1; data not shown).
3.1.3 Temporal evolution at contrasted productive stations
No clear temporal evolution of the phytoplankton biomass could be evidenced in the complex system of recirculation located in the stationary meander of the PF, as demonstrated by the integrated chlorophyll a concentrations (ranging be-tween 98.2 and 129.0 mg m−2)from the first (E-1) to the last (E-5) visit in Fig. 7.
Figure 5.
Latitude ( S) Ocean Data View
50 100 150 200 0 50 100 150 200 % mi crop hy top lan kton to C hl a % na no ph y top lan kto n to C hl a 60 40 20 0 80 100 60 40 20 0 80 47 S 48 S 49 S 50 S D ep th (m) D ep th (m) 0 50 100 150 200 D ep th (m) % picop h y top lan kto n to C hl a 100 60 40 20 0 80 100
Figure 5. Vertical distribution of micro-, nano- and
picophytoplank-ton community contributions to total biomass along the TNS tran-sect. The dashed line represents the approximate location of the southern branch of the polar front (PF).
Stations E-4W and A3 were visited two times (Fig. 7). The largest phytoplankton development was observed at the KP reference station A3, where chlorophyll a con-centrations have increased 3.5-fold over one month (from 106.2 mg m−2 in October, A3-1 visit, to 371.7 mg m−2 in November, A3-2 visit). This evolution was accompanied by an increase of the Phaeo : chlorophyll a ratio (from < 0.1 to 0.3), reflecting a higher grazing activity at the second visit (data not shown).
Station E-4W was characterized by a moderate evolution compared to A3, likely due to the shorter period of time between the two sampling periods (6 days compared to 27 days). Chlorophyll a concentrations increased about 2-fold from 131.2 to 249.8 mg m−2between the two visits.
For A3 station and E stations, the temporal evolution of chlorophyll biomass was mainly due to the development of a microphytoplankton community largely dominated by di-atoms. At these stations, integrated nano- and picophyto-plankton biomasses, determined using diagnostic pigments, were very low and nearly constant all over the course of the cruise (14.4 ± 3.7 and 4.6 ± 1.7 mg m−2; Fig. 7,respec-tively).
3.2 Biogenic silica and particulate organic matter 3.2.1 Spatial variability over the study area
The study area was characterized by a heterogeneous distri-bution of biogenic silica (BSi) and particulate organic carbon (POC), nitrogen (PON), and phosphorus (POP) (Fig. 8). The lowest vertically integrated concentrations of BSi, POC, and PON were measured at the off-shore stations R2 and TNS-1 with integrated values over 200 m of 88.6 mmol Si m−2, 610.5 mmol C m−2, and 78.1 mmol N m−2, respectively. The
lowest concentrations of POP were evidenced at the station TEW-3 (8.9 mmol P m−2over 200 m). The highest
concen-trations were observed between TEW-7 and TEW-8 (250.4 to 377.6 mmol Si m−2 for BSi, 1200 to 1875 mmol C m−2 for POC, 214.7 to 354.4 mmol N m−2 for PON, 29.5 to 39.0 mmol P m−2 for POP), confirming the very high phy-toplankton biomass of the PF area. North of the KP, the dis-tribution of BSi, POC, PON, and POP was influenced by the passage of the PF which isolated northern waters character-ized by low particulate matter concentrations from southern waters characterized by high particulate matter concentra-tions. This feature is especially highlighted for BSi concen-trations (Table 1).
3.2.2 Vertical distribution along transects TNS and TEW
At the beginning of the bloom, along the TNS transect, POC, PON, and POP concentrations were low at all stations (< 12 µmol C L−1, < 1.5 µmol N L−1 and < 0.16 µmol P L−1,
respectively; Fig. 9). For BSi concentrations, two contrasted areas were observed on either side of the PF, with southern waters richer (1.29 to 3.14 µmol Si L−1)than northern waters (0.08 to 1.05 µmol Si L−1).
Along the TEW transect (Fig. 10), 10 days later, the vertical distributions of BSi and particulate organic mat-ter clearly followed the same patmat-tern as chlorophyll a. The highest BSi, POC, PON, and POP concentrations were ob-served at both the coastal station TEW-1 at the surface (2.77 to 5.87 µmol Si L−1, 5.50 to 16.3 µmol C L−1, 1.00 to 2.82 µmol N L−1, and 0.15 to 0.22 µmol P L−1, respectively) and in the PF area between TEW-7 and TEW-8 down to 50 m depth (2.85 to 5.42 µmol Si L−1, 10.1 to 31.9 µmol C L−1, 2.42 to 5.89 µmol N L−1, 0.23 to 0.81 µmol P L−1, respec-tively). The core of the transect (TEW-3 to TEW-6) was characterized by lower particulate matter concentrations (0.51 to 2.91 µmol Si L−1, 3.93 to 11.4 µmol C L−1, 0.42 to
2.21 µmol N L−1 and 0.01 to 0.19 µmol P L−1). As noticed for chlorophyll a in this area, higher BSi concentrations (2.32 to 2.91 µmol Si L−1)were observed at TEW-4 down to 100 m depth. Standing out of chlorophyll a and partic-ulate organic matter distributions, a well-defined deep BSi maximum (2.00 ± 0.10 µmol Si L−1)was found at 300 m at TEW-5.
Table 1. Integrated concentrations in BSi, POC, PON, and POP (in mmol m−2)over 200 m depth (except for the coastal station TEW-2, integrated over 70 m) north and south of the polar front.
Integrated concentrations (mmol m−2)
North of the PF South of the PF
(stations TEW-2, TEW-3, TNS-1, TNS-2) (stations TEW-4 to TEW-6, TNS-3 to TNS-10, A3-1)
6BSi 33.5–141.0 240.0–460.3 6POC 456.9–629.6 562.9–1164.2 6PON 83.1–144.9 143.5–250.3 6POP 5.7–10.1 8.7–18.9 Figure 6. NPF SPF % mi crop hy top lan kton to C hl a % na no ph y top lan kto n to C hl a 100 60 40 20 0 80 100 60 40 20 0 80
Ocean Data View
70 E 71 E 72 E 73 E 74 E Longitude ( E) D ep th (m) 0 50 100 150 200 D ep th (m) 0 50 100 150 200 % picop h y top lan kto n to C hl a 100 60 40 20 0 80 D ep th (m) 0 50 100 150 200
Figure 6. Vertical distribution of micro-, nano- and
picophytoplank-ton community contributions to total biomass along the TEW tran-sect. The dashed lines represent the approximate location of the southern branch of the polar front going to the North (NPF) and to the South (SPF).
For both transects, the vertical distribution of BSi strongly paralleled that of fucoxanthin (Fig. 3), confirming the dom-inance of diatoms in the phytoplankton communities of the Kerguelen region. Size-fractionation of BSi can bring infor-mation on the sizes of the diatoms even though the pres-ence of debris can alter this information. Nano-sized frac-tion of BSi (0.8 to 20 µm) can then correspond to the pres-ence of small diatom species or fragments of diatoms. Micro-sized fraction of BSi (> 20 µm) indicates the presence of large siliceous phytoplankton which could represent both large di-atom cells and large colonies of didi-atoms. In the Kergue-len region, size fractionation of BSi (Fig. 11) revealed the
major role played by large (> 20 µm) siliceous phytoplank-ton which accounted for > 60 % of total BSi at all produc-tive stations over different depths according to the location: down to 200 m at TEW-4, A3-2, and E (E-1 to E-5) sta-tions (typical vertical profile represented by station TEW-4 in Fig. 11a), down to 100 m at E-4W and in the PF area (rep-resented by F-L vertical profile in Fig. 11b), and down to 40 m at TEW-1 (data not shown). The relative contribution of the two size classes was mainly driven by the evolution of the large size fraction over these different depths, as the small size fraction concentrations remained fairly constant around 190 mmol Si m−2. As a consequence, the nano-sized diatoms (0.8 to 20 µm) were dominant at the low-productivity stations (R2, TNS-1, TNS-2, TEW-2, TEW-3, TEW-5, and TEW-6; typical vertical profile illustrated by station R2 in Fig. 11c) and everywhere below 200 m except at station TEW-5 (Fig. 11d). The latter station showed an increasing contribution of the micro-sized fraction (> 20 µm) to total siliceous biomass with depth (ranging from 23 % at the sur-face and 60 % between 300 and 400 m). This unusual feature coincided with the deep BSi maximum mentioned above. 3.2.3 Temporal evolution at contrasted productive
stations
Slight increases in BSi (Fig. 12) and particulate organic mat-ter (data not shown) concentrations were observed in the re-circulation system (stations E). From the first (E-1) to the third visit (E-3), integrated concentrations over 200 m were relatively constant (average: 308.2 ± 23.6 mmol Si m−2for BSi, 1065 ± 51 mmol C m−2for POC, 195.6 ± 11.6 mmol N m−2for PON and 13.5 ± 1.6 mmol P m−2for POP). Values then increased at the two last visits (E-4E and E-5), reach-ing 410.7 ± 23.1 mmol Si m−2, 1651 ± 26 mmol C m−2,
231.5 ± 31.0 mmol N m−2and 28.5 ± 5.9 mmol P m−2. In
addition, vertical profiles revealed that BSi and particulate organic matter were concentrated in a shallow layer (from the surface down to 100 m depth) during these two last visits (data not shown).
As mentioned for chlorophyll a, the largest phytoplankton development was observed at A3 with increasing concentra-tions of BSi (from 163.5 to 713.3 mmol Si m−2), POC (from
1259 to 2267 mmol C m−2), PON (from 137.9 to 435.9 mmol
N m−2), and POP (from 9.7 to 29.3 mmol P m−2)between
A3-1 and A3-2 visits (Fig. 12, data not shown for POC, PON, and POP concentrations). On the first visit of E-4W, the sit-uation was already characterized by high BSi, POC, PON, and POP concentrations over 100 m depth (up to 3.83, 20.0, 3.60, 0.27 µmol L−1, respectively). The temporal evolution between the two visits was still considerable with integrated concentrations varying from 379.5 to 744.2 mmol m−2for BSi, 1162 to 1598 mmol m−2for POC, from 288.2 to 354.1 mmol m−2for PON, and from 21.5 to 32.6 mmol m−2for POP.
The temporal evolution of particulate matter in the me-ander of the PF and at stations A3 and E-4W evidenced a significant growth of the siliceous phytoplankton community since the beginning of the cruise. As a general trend, the large size fraction (> 20 µm) was contributing to around 60 % over-all of integrated BSi stocks in the surface productive layer, with the exception of stations R2 and E-3, where the small size fraction (0.8 to 20 µm) was slightly dominant (account-ing for 59.4 and 52.5 %,respectively, of the above-mentioned integrated BSi stocks). However, it is particularly important to notice that the BSi stocks located between 200 and 400 m, which may reflect the communities sinking out of the sur-face layer, were always dominated by the nano-sized parti-cles (ranging from 61.4 to 86.1 % of BSi stocks integrated from 200 to 400 m depths).
3.3 Elemental ratios of particulate matter
The elemental ratios in the upper 200 m are presented as six clusters of stations (Fig. 13), grouped in function of biomass, elemental ratios and phytoplankton community structure re-ported for each station. The objective of this clustering is to provide an overview of the distribution of elemental ratios over the study area to highlight some spatial and temporal patterns. Each cluster of stations includes systems with dif-ferent environmental dynamics. Mann–Whitney tests were then performed on these six clusters for each elemental ra-tio (Si : C, Si : N, Si : P, C : N, C : P and N : P) to determine the clusters that were significantly different from each other at the 95 % confidence level (Fig. 13). The six clusters of sta-tions corresponded to the following: (1) the lowest biomass stations including the off-plateau stations R2 and TNS-1, and A3-1 at the start of the bloom, (2) the moderate productive stations north of the PF (TNS-2, TEW-2, TEW-3), (3) the high biomass stations in the PFZ (TEW-7, TEW-8, F-L, F-S), (4) the high biomass stations south of the PF (A3-2, E-4W, E-4W2), (5) the moderate biomass stations south of the PF (TNS-3 to TNS-10, E-1 to E-5, TEW-4 to TEW-6), (6) the coastal station TEW-1.
The lowest Si : C, Si : N and Si : P ratios were observed at the lowest biomass stations (cluster 1) of the study area in the upper 200 m (respectively 0.11 ± 0.07, 0.67 ± 0.43 and 9.6 ± 6.4). Except for cluster (1), Si : C, Si : N and Si : P
ra-Figure 7. 0 100 200 300 400
R FL E1 E2 E3 E4E E5 A3-1 A3-2 E4W E4W2
Integ rat ed Ch l a con cen tr atio ns (m g .m
-2) [Chl a]micro [Chl a]nano [Chl a]pico
R2 F-L E-1 E-2 E-3 E-4E E-5 A3-1 A3-2 E-4W E-4W2 Figure 7. Temporal evolution of chlorophyll a concentrations
associated with micro- ([chlorophyll a]micro), nano- ([chloro-phyll a]nano) and picophytoplankton ([chloro([chloro-phyll a]pico) within 200 m at the complex system of recirculation (five visits chrono-logically numerated: E-1 (10/29), E-2 (11/01), E-3 (11/03), E-4E (11/13), E-5 (11/19)), at the plateau reference station A3 (two its: A3-1 (10/20) and A3-2 (11/16)) and at station E-4W (two vis-its: E-4W (11/12) and E-4W2 (11/18)). The station F–L (integrated within 150 m) and the HNLC reference station R2 are presented for comparison.
tios were always higher than the typical values for nutrient-replete diatoms (Brzezinski, 1985). The highest average val-ues were observed at the coastal station TEW-1 in the upper 70 m (cluster 6) reaching 0.70 ± 0.25 for Si : C, 2.59 ± 0.40 for Si : N and 34.4 ± 6.6 for Si : P. The other stations lo-cated north of the PF or in the PFZ (clusters 2 and 3) were characterized by lower average Si : C, Si : N and Si : P mo-lar ratios (respectively 0.28 ± 0.01, 1.32 ± 0.13, 16.0 ± 2.6) than the stations south of the PF (respectively 0.35 ± 0.01, 1.75 ± 0.05, 24.9 ± 4.3). This observation agreed with statis-tical tests: the clusters of the stations north of the PF were statistically different from the other clusters south of the PF (Fig. 13).
Except for the lowest biomass stations (cluster 1), C : N and C : P ratios were relatively constant (reaching average values of 5.1 ± 1.4 and 73.0 ± 35.4 respectively) and lower than the Redfield et al. (1963) ratios. N : P ratios were close to the Redfield’s ratio all over the study area (aver-age: 14.4 ± 6.3) except for the stations located in the PFZ (cluster 3). These stations were characterized by lower C : P (48.1.7 ± 18.0) and N : P (10.5 ± 3.3) ratios than the rest of the study area. The Mann–Whitney test did not evidence any significant difference between the median of the six clus-ters for C : P and N : P ratios. For C : N ratios, only the low biomass stations were significantly different from the other stations at the 95 % confidence level.
Over the course of the cruise, the development of diatoms was evidenced between the first (A3-1) and the second vis-its (A3-2) at A3 with Si : C and Si:N ratios increasing re-spectively from 0.14 ± 0.06 to 0.32 ± 0.06 and 0.87 ± 0.25 to 1.66 ± 0.24 (data not shown). Significant increases in
Figure 8. O c e a n D a ta Vi e w Longitude ( E) Longitude ( E) 66 E 68 E 70 E 72 E 74 E 76 E 66 E 68 E 70 E 72 E 74 E 76 E L a ti tu d e ( S) 47 S 48 S 49 S 50 S 51 S 6 R2 A3-1 TNS 1 2 3 4 5 6 7 8 9 10 TEW 2 1 3 5 7 8 4 E-2 F-S F-L Polar Front c) PON 6 R2 A3-1 TNS 1 2 3 4 5 6 7 8 9 10 TEW 2 1 3 5 7 8 4 E-2 F-S F-L Polar Front d) POP 2000 1500 1000 500 0 L atit u d e ( S) 47 S 48 S 49 S 50 S 51 S mmol m-2 6 R2 A3-1 TNS 1 2 3 4 5 6 7 8 9 10 TEW 2 1 3 5 7 8 4 E-2 F-S F-L Polar Front a) BSi 6 R2 A3-1 TNS 1 2 3 4 5 6 7 8 9 10 TEW 2 1 3 5 7 8 4 E-2 F-S F-L Polar Front b) POC mmol m-2 500 400 300 200 100 0 350 300 200 150 100 250 mmol m-2 40 30 20 10 mmol m-2
Figure 8. Distribution of biogenic silica (a), particulate organic carbon (b), nitrogen, (c) and phosphorus (d) (same vertical integrations and
legends as Fig. 2).
Si : C and Si : N were also observed at E-4W from the first (0.29 ± 0.12 for Si : C and 1.25 ± 0.62 for Si : N) to the sec-ond visit (0.39 ± 0.07 for Si : C and 2.06 ± 0.15 for Si : N). Moderate increases were shown for Si : P ratio both at A3 (from 17.3 ± 2.9 to 19.6 ± 6.7) and E-4W (from 18.3 ± 4.4 to 19.4 ± 6.3). At E-4W, a slight decrease was evidenced from the first to the second visit for C : N (from 5.5 ± 0.5 to 5.0 ± 0.5), C : P (from 76.3 ± 12.3 to 71.7 ± 25.7) and N : P (from 17.1 ± 6.0 to 12.9 ± 1.9). At A3, a higher de-crease was observed from the first to the second visit for C : N (from 8.8 ± 3.5 to 5.3 ± 0.2), C : P (from 148.9 ± 47.2 to 65.9 ± 32.8) and N : P (from 20.9 ± 3.1 to 11.4 ± 5.2). 3.4 Lithogenic silica
Lithogenic silica is a good proxy to track the transport of lithogenic material (and indirectly Fe) from terrestrial ero-sion, aeolian dust deposition or sediment resuspension to the water column (Quéguiner et al., 1997). Over the entire study area, LSi concentrations did not exceed 0.11 µmol L−1
throughout most of the water column, except at stations sub-jected to continental influence (Fig. 14). The highest LSi values were observed at the coastal station TEW-1 (aver-age: 1.31 ± 0.14 µmol L−1)and at station A3 near the bottom (1.34 ± 0.07 µmol L−1). In addition, compared to surround-ing waters, station A3 was characterized by relatively higher concentrations down to 300 m (values > 0.15 µmol L−1). This feature was also observed at the second visit A3-2 (Fig. 15). The lowest LSi concentrations were found at TNS-1 with
values < 0.01 µmol L−1 over the first 400 m (Fig. 14). As expected, concentrations were low at station R2 (Fig. 15), located far from any continental influence (< 0.04 µmol L−1 in the upper 100 m), although a maximum was reported at 500 m (0.12 µmol L−1). Inside the meander of the PF (sta-tions E), LSi concentra(sta-tions were lower than 0.10 µmol L−1 but local maxima (0.12 to 0.13 µmol L−1)between 600 and
700 m were noticed at the first (E-1), the fourth (E-4E) and the last visit (E-5) (and likely E-2, although data are missing to confirm it). High LSi concentrations were also observed at E-4W at 75 and 400 m (0.23 and 0.12 µmol L−1 respec-tively) only during the second visit. Along the transect TEW, LSi concentrations were higher in the PFZ reaching values higher than 0.11 µmol L−1over the water column at TEW-8. As a general trend, LSi was mainly composed of small particles (from 0.8 to 20 µm) over the water column, repre-senting in average 59.5 % of total LSi. However, local maxi-mums observed at A3-2 (50 m), F-L (300 m), E-4W2 (75 and 400 m) and E-5 (600 m) were associated with large particles (> 20 µm), accounting for 65.2 to 86.5 % of the total LSi.
4 Discussion
4.1 The Kerguelen Plateau region: a mosaic of biogeochemical environments
The biogeochemical characteristics of the water masses northeast of the Kerguelen Islands have already been docu-mented by Blain et al. (2001) in early spring (October 1995).
Figure 9. 0 100 200 300 400 B S i (µ mol L -1) D ep th (m) 30 25 20 15 10 5 0 100 200 300 D ep th (m) P O C (µ mol L -1) 5 4 3 1 0 2 0 100 200 300 D ep th (m) P O N (µ mol L -1) 0 0.7 0.6 0.4 0.2 0.5 0.3 0.1 0 100 200 300 D ep th (m) P O P (µ mol L -1) Latitude ( S)
Ocean Data View
47 S 48 S 49 S 50 S 0 a) b) c) d) 6 5 4 2 0 3 1
Figure 9. Vertical distributions of BSi (a), POC (b), PON (c), POP (d) concentrations along the TNS transect. The dashed line
repre-sents the approximate location of the southern branch of the polar front (PF).
They highlighted the complex mesoscale structure of wa-ter masses which generated contrasting biogeochemical en-vironments above the KP. The particular mesoscale circula-tion is directly impacted by the topography of the KP and the presence of the PF pathway isolating warm northern sub-antarctic surface waters from cold southern Antarctic surface water (AASW) (Park and Gamberoni, 1997). Similar circu-lation patterns (Park et al., 2014; Zhou et al., 2014) were ob-served during the KEOPS2 cruise. This is probably partly for that reason that a mosaic of biogeochemical conditions was also encountered.
Coastal waters (corresponding to stations TEW-1 and TEW-2) were characterized by a large diatom bloom and high LSi concentrations, evidencing strong lithogenic mate-rial inputs (including iron) from the plateau.
A strong shelf front isolated these warmer coastal wa-ters (> 2.4◦C) from the cold (2.3◦C) PF water tongue con-taining low chlorophyll a and BSi concentrations. Blain et al. (2001) associated this water tongue (corresponding to sta-tion TEW-3 in our study) to an intrusion of AASW where phytoplankton growth was limited by an unfavorable light-mixing regime. Indeed, TEW-3 showed the deepest mixed
Figure 10. 6 5 4 2 0 0 100 200 300 400 B S i (µ mol L -1) D ep th (m) 0 30 25 20 15 10 0 0 100 200 300 D ep th (m) P O C (µ mo l L -1) 5 4 3 1 0 2 0 100 200 300 D ep th (m) P O N (µ mol L -1) 0.7 0.6 0.4 0.2 0.5 0.3 0.1 0 100 200 300 D ep th (m) P O P (µ mol L -1) 70 E 71 E 72 E 73 E 74 E Longitude ( E)
Ocean Data View 5 a) b) c) d) 3 1 NPF SPF
Figure 10. Vertical distributions of BSi (a), POC (b), PON (c), POP (d) concentrations along the TEW transect. The dashed lines
repre-sent the approximate location of the southern branch of the polar front going to the north (NPF) and to the south (SPF).
layer depth (95 m) of the west-east transect, but unfortunately photosynthetic parameters were not determined precluding any conclusion about the light-limitation hypothesis. Grazing pressure could also be another limiting factor for phytoplank-ton growth. However, zooplankphytoplank-ton biomass was too low at TEW-3 (Carlotti et al., 2014) to explain the low chlorophyll a and BSi concentrations.
By contrast, a productive, high-biomass system was found in the eastern area in the PF between TEW-7 and TEW-8. This area was characterized by a shallow mixed layer (down to 50 m), likely providing favorable light conditions for di-atom growth. Despite being far from the plateau, these sta-tions showed sufficient iron concentrasta-tions (∼ 0.2 nmol L−1
over 50 m; Quéroué et al., 2014) to support phytoplankton growth. Significant iron could be supplied by the transport of Fe-rich deep waters from the KP to the northwestern Kergue-len Abyssal Plain east of the KP (Zhou et al., 2014), but also from the coastal area by lateral advection driven by the sub-antarctic surface water eastward flow north of the PF (Buc-ciarelli et al., 2001). Potential sources of iron will be dis-cussed in Sect. 4.4.
Figure 11. 0,0 0,5 1,0 1,5 2,0 2,5 0 100 200 300 400 500 0,0 0,1 0,2 0,3 0,4 0,5 0,6 0 100 200 300 400 500 0 1 2 3 4 0 100 200 300 400 500 0,0 0,5 1,0 1,5 2,0 2,5 3,0 3,5 0 100 200 300 400 500 1.0 2.0 3.0 0.0 0.5 1.0 1.5 2.0 2.5 d) TEW-5 b) F-L a) TEW-4 c) R2 100 200 300 0 400 500 0.0 0.2 0.4 0.6 0.0 1.0 2.0 3.0 4.0
Size fraction > 20 µm Size fraction < 20 µm and > 0.8 µm
D ept h (m ) 0.0
BSi concentrations (µmol L-1)
Figure 11. Vertical profiles of BSi concentrations for two size fractions (> 20 µm in black and between 0.8 and 20 µm in grey) at TEW-4 (a),
F-L (b), R2 (c) and TEW-5 (d). These four stations were chosen to illustrate the four typical vertical profiles observed over the study area: TEW-4 represents typical profile of the stations A3-2 and E (from E-1 to E-5), F-L represents typical profile of stations E-4W and those located in the PFZ, R2 represents typical profile of the low productive stations (R2, TNS-1, TNS-2, TEW-2, TEW-3, TEW-5 and TEW-6) and TEW-5 is the only station showing such a vertical profile.
The largest diatom development was observed over the southeast KP at the reference station A3 (during the sec-ond visit) with the highest chlorophyll a and BSi concen-trations reported during the cruise. This station also evi-denced high LSi concentrations near the bottom suggesting lithogenic material inputs from the plateau sediments. In-deed, one major conclusion of KEOPS1 was that the long-lasting diatom bloom above the plateau was maintained by the continuous supply to the surface mixed layer of iron and nutrients. The latter originated from below due to an enhanced tidally induced vertical mixing associated with a weak mean residual circulation resulting in a long retention time for nutrients and trace elements (Blain et al., 2007; Park et al., 2008a). On a longer time-scale, it was assumed that iron supply to A3 originated from horizontal advection from the extensive shoal around the Heard/Mc Donald Is-lands (Park et al., 2008a). East of the KP, this northward circulation along the topography could also lead to a par-tial export of the plateau bloom. This feature was supported by the observation of similar biogeochemical properties at station A3 and at the eastern flank (corresponding to station E-4W for the two visits) of the KP. The E-4W station ev-idenced the same range of values as A3 in terms of BSi, POC, PON, and POP concentrations and quite similar diatom community compositions mainly dominated by Chaetoceros
Hyalochaete, Thalassiosira-like (pending scanning electron
microscopy determination) and Pseudo-nitzschia spp. (Las-bleiz et al., 2014). Furthermore, the assemblages in sedi-ments at these two sites were similarly composed of
Eu-campia antarctica, Dactyliosolen antarctica, Fragilariopsis kerguelensis, Chaetoceros resting spores, Rhizosolenia spp.
as well as an uncommon species, Thalassiosira decipiens, not observed anywhere else over the study area (Wilks, 2013). The northward export of part of the southeast KP bloom also serves as a good explanation to the higher
par-ticulate matter concentrations observed at TEW-4 compared to the other stations of the TEW transect at the beginning of the cruise.
As compared to the easternmost part of the study area in the PF, the stations south of the PF exhibited moder-ate biomasses. Inside the meander of the PF, two stages in the development of the siliceous phytoplankton community were observed in the course of the cruise. At the begin-ning, particulate matter concentrations were moderate and slightly decreasing from the first (E-1) to the third visit (E-3). The microplanktonic size fraction (> 20 µm) contribution to siliceous biomass was also decreasing while the nanoplank-tonic size fraction contribution increased from 34.5 % at the first visit (E-1) to 47.5 % of the siliceous biomass at the third visit (E-3) (Fig. 12). By contrast, the two last visits (E-4E and E-5) showed an increase in phytoplankton biomass dom-inated by large diatoms and concentrated over a shallower depth. Closset et al. (2014) also reported these two contrasted periods through theR D : P ratio defined as the ratio of Si dissolution rates (D) to Si production rates (P ) integrated over the euphotic zone. From E-1 to E-3, increasingR D : P ratio evidenced an increased BSi loss due to enhanced BSi dissolution in surface waters, while decreasingR D : P ra-tio between E-4E and E-5 resulted from enhanced BSi pro-duction rates and revealed bloom conditions. Together, these results would suggest that the start of the bloom period (E-4E and E-5) was preceeded by a non-lasting phytoplank-ton development before the first sampling (E-1). This short bloom event could have been aborted by adverse hydrody-namic conditions before the beginning of the cruise. This was consistent with the increase in the proportion of empty di-atoms frustules from E-1 to E-3 (from 5.1 % to 25.7 %; Las-bleiz et al., 2014) and the increase of phytodetrital and fecal aggregates observed at depth by Laurenceau et al. (2014). The important role of mesoscale structures and turbulence in
the control of primary production and light availability have already been reported by previous studies (e.g., Lancelot et al., 2000; Lévy et al., 2001; Read et al., 2007). We hypoth-esize that the instability of the mixed layer depth before the beginning of the cruise could have generated deepen-ing events providdeepen-ing unfavorable light conditions for phy-toplankton growth. Our hypothesis is supported by the σ2
profiles which indicate the existence of a secondary pycno-cline around 130 m at E-1 and a continuous gradient with no clear mixed layer from the surface down to 200 m depth E-3 (data not shown). Furthermore, the slight increase in zoo-plankton abundance from E-1 to E-3 (Carlotti et al., 2014) suggests that phytoplankton growth was not mainly impacted by grazing pressure. Another feature of the area south of the PF was the presence of a minimum of biomass in the cen-tral core of the complex recirculation meander (correspond-ing to station TEW-5). This central core stands out from the rest of the study area by the presence of a deep silica max-imum (between 300 and 400 m; Fig. 10a) mainly associated with microplanktonic size particles (> 20 µm). There could be several explanations for this peculiar feature. (1) Given the low Si biomass at the surface, the presence of large and non-living diatoms at depth could reflect the sedimentation of an early bloom that could have been quickly driven to an end due to adverse hydrodynamic conditions, as discussed above. A vertical net haul down to 100 m depth at TEW-5 revealed the dominance of the heavily silicified diatoms
Fragilariop-sis kerguelenFragilariop-sis as well as Corethron pennatum (L. Armand,
personal communication, 2013). However no sediment sam-ple was collected at this station to evidence their eventual in-fluence on vertical export. (2) Mesoscale activity could also have favored the transfer and the accumulation of biogenic silica at depth in the central meander area which is character-ized as a region of general downwelling (Zhou et al., 2014). (3) Finally, the northward circulation from the KP could have advected large and non-living diatoms already sedimenting at depth coming from productive southern waters.
4.2 Impact of natural iron enrichment on chlorophyll a and phytoplankton communities
4.2.1 The off-plateau HNLC stations
During the KEOPS2 cruise, the off-plateau station R2 showed the lowest chlorophyll biomass (39.0 mg m−2; Fig. 2a) despite high macronutrient concentrations of the sur-rounding waters (Blain et al., 2014). In this HNLC area, one limiting factor was likely iron availability as suggested by the low iron concentrations in surface waters (∼ 0.1 nmol L−1; Quéroué et al., 2014) and the Fe-Cu incubation experiments (Bowie et al., 2014; Sarthou et al., 2014). Light could also have been (co-)limiting as the mixed layer extended down to
∼120 m almost exactly coinciding with the 0.01 % surface light level. Chlorophyll a concentrations were in the same or-der of magnitude as that measured in typical HNLC waters of
Figure 12. 0 200 400 600 800 0 200 400 600 800 a) Int egrat ed BSi concen tr at ions (m m ol .m -2) Integration over 200 m
Fraction > 20 µm Fraction < 20 µm and > 0.8 µm
Total > 0.8 µm
Integration between 200 and 400 m
Fraction > 20 µm Fraction < 20 µm and > 0.8 µm
Total > 0.8 µm Int egrat ed BSi concen tr at ions (m m ol .m -2) b) R2 F-L E-1 E-2 E-3 E-4E E-5 A3-1 A3-2 E-4W E-4W2 R2 F-L E-1 E-2 E-3 E-4E E-5 A3-1 A3-2 E-4W E-4W2
Figure 12. Temporal evolution of BSi concentrations within 200 m (a) (except for A3-2 where data were integrated down to 160 m) and
between 200 and 400 (b) for three size fractions (> 0.8 µm, between 0.8 and 20 µm and > 20 µm) at the complex system of recirculation, at the plateau reference station A3, at station E-4W (stations legend as in Fig. 7). The station F–L and the HNLC reference station R2 are presented for comparison. At some stations, size-fractionation was not performed because of logistical problems onboard.
the Southern Ocean (Bathmann et al., 1997; Gall et al., 2001; Froneman et al., 2004) and more specifically, of the Kergue-len region (Cailliau et al., 1997; Uitz et al., 2009). Integrated chlorophyll biomass was however higher than the lowest val-ues corresponding to the poorest areas of the Southern Ocean (range: 10 to 20 mg m−2)suggesting the slight phytoplank-ton development that may have occurred shortly before the site visit. In contrast to the other stations of the study area, the off-plateau station R2 showed a lower microphytoplankton contribution (47 % of total chlorophyll a biomass; Fig. 2b) due to a higher proportion of nanophytoplankton (39 % of to-tal chlorophyll a biomass; Fig. 2c). This result was expected from previous artificial and natural iron-fertilization experi-ments (Gall et al., 2001; Hoffmann et al., 2006; Moore et al., 2007; Lance et al., 2007). Increased contributions of nano-sized communities (small diatoms or flagellates) were re-ported under iron-limited conditions (Sunda and Huntsman, 1997; Timmermans et al., 2001; Armand et al., 2008; Uitz et al., 2009). Cell counts confirmed the dominance of nanoflag-ellates at station R2 in terms of C biomass (Lasbleiz et al., 2014). Several species of dinoflagellates and the
silicoflag-ellate Dyctiocha speculum were also important
contribu-tors to C biomass compared to diatoms. At station R2, the chlorophyll a : Fuco ratio (3.7) and chlorophyll a : 190BF ra-tio (11.0) were respectively higher and lower than those mea-sured for diatoms (Wright and Jeffrey, 1987; Ediger et al.,