HAL Id: hal-01464141
https://hal-amu.archives-ouvertes.fr/hal-01464141
Submitted on 10 Feb 2017
HAL is a multi-disciplinary open access
archive for the deposit and dissemination of
sci-entific research documents, whether they are
pub-lished or not. The documents may come from
teaching and research institutions in France or
abroad, or from public or private research centers.
L’archive ouverte pluridisciplinaire HAL, est
destinée au dépôt et à la diffusion de documents
scientifiques de niveau recherche, publiés ou non,
émanant des établissements d’enseignement et de
recherche français ou étrangers, des laboratoires
publics ou privés.
Precue Activity in Motor Cortex
Joachim Confais, Bjørg Kilavik, Adrián Ponce-Alvarez, Alexa Riehle
To cite this version:
Joachim Confais, Bjørg Kilavik, Adrián Ponce-Alvarez, Alexa Riehle. Behavioral/Systems/Cognitive
On the Anticipatory Precue Activity in Motor Cortex. Journal of Neuroscience, Society for
Neuro-science, 2012, �10.1523/JNEUROSCI.1768-12.2012�. �hal-01464141�
Behavioral/Systems/Cognitive
On the Anticipatory Precue Activity in Motor Cortex
Joachim Confais, Bjørg Elisabeth Kilavik, Adria´n Ponce-Alvarez, and Alexa Riehle
Institut de Neurosciences de la Timone, CNRS-Universite´ Aix-Marseille, UMR 7289, 13385 Marseille Cedex 5, France
Motor cortical neurons are activated during movement preparation and execution, and in response to task-relevant visual cues. A few studies also report activation before the expected presentation of cues. Here, we study specifically this anticipatory activity preceding visual cues in motor cortical areas. We recorded the activity of 1215 neurons in the motor cortex of two macaque monkeys while they performed a center-out reaching task, including two consecutive delays of equal duration, known in advance. During the first delay (D1), they had to await the spatial cue and only reach to the cued target after the second delay (D2). Forty-two percent of the neurons displayed anticipatory activity during D1. Among these anticipatory neurons, 59% increased (D1up) their activity and the remaining decreased (D1down) their activity. By classifying the neurons according to these firing rate profiles during D1, we found that the activity during D2 differed in a systematic way. The D1up neurons were more likely to discharge phasically soon after the spatial cue and were less active during movement execution, whereas the D1down neurons showed the opposite pattern. But, regardless of their temporal activity profiles, the two categories seemed equally involved in early and late motor preparation, as reflected in their directional selectivity. This precue activity in motor cortex may reflect two complementary, coexisting processes: the facilitation of incoming spatial information in parallel with the downregulation of corticospinal excitability to prevent a premature response.
Introduction
Animals, as they anticipate events, use available temporal infor-mation to optimize action and perception. This inforinfor-mation might, for instance, be extracted from isochronously presented signals, or by observing the motion of a ball in the air. In motor cortical areas, the anticipation (preparation) of a movement has been widely studied (Riehle, 2005), but here we will focus on the activity of the same areas during anticipation of relevant cues.
The primary motor cortex (M1) and dorsal premotor cortex (PMd) are activated during movement execution (Weinrich et al., 1984, 1985; Riehle and Requin, 1989, 1995; Crammond and Kalaska, 1996), but also beforehand, as the animal prepares to move (Wise and Mauritz, 1985; Wise and Kurata, 1989; Shen and Alexander, 1997a,b; Riehle, 2005), and after the presentation of relevant visual cues (Godschalk et al., 1981; Vaadia et al., 1986; Riehle and Requin, 1989; Miller et al., 1992; Boussaoud and Wise, 1993a,b; Crammond and Kalaska, 1996, 2000; Yamagata et al.,
2009). Furthermore, Wise and collaborators (Mauritz and Wise, 1986; Vaadia et al., 1988; di Pellegrino and Wise, 1993a) de-scribed an anticipatory activity in PMd preceding relevant sen-sory cues, even when the movement was to be executed after a subsequent delay of up to several seconds. Such anticipatory ac-tivity was also reported in other areas, including parietal area 5 (MacKay and Crammond, 1987), the frontal cingulate cortex (Niki and Watanabe, 1979), the dorsal prefrontal cortex (Vaadia et al., 1986; Niki and Watanabe, 1987), and M1 (Crammond and Kalaska, 1996; Fig. 3 in Roux et al., 2003). This widespread phe-nomenon of preactivation was only observed with predictable cue timing. However, its function is still unclear: it could partic-ipate in a general timing process of the cue (Durstewitz, 2004; Coull and Nobre, 2008, Fujioka et al., 2012), or be part of a preparatory process in anticipation of a future motor event, sim-ilar to what was found before movement onset (Lucchetti and Bon, 2001; Renoult et al., 2006; Lebedev et al., 2008).
Although very detailed, the studies about precue activity in motor cortex remained descriptive and focused only on neurons with increasing activity, ignoring those with systematic decreas-ing firdecreas-ing rate preceddecreas-ing the spatial cue (SC). In this study, we addressed both patterns of precue activity (increasing and de-creasing), linking them to the subsequent phases of visuomotor transformation and movement preparation. Furthermore, we analyzed neuronal activity of both PMd and M1. We used a task in which the timing of the visual SC was indicated at the start of each trial. Our main finding is that the cue anticipation involves almost half of the neurons of both M1 and PMd, with 60% of those showing an increasing precue activity and the remaining a decreasing precue activity. The subsequent preparatory activity depends on the direction of the precue activity, especially in the epoch immediately following the cue and during late movement preparation. Despite marked differences in firing rate
modula-Received April 11, 2012; revised Aug. 28, 2012; accepted Sept. 2, 2012.
Author contributions: B.E.K. and A.R. designed research; J.C., B.E.K., and A.P.-A. performed research; J.C. ana-lyzed data; J.C., B.E.K., and A.R. wrote the paper.
This work was supported by Agence National de la Recherche Grant ANR-NEUR-05-045-1; an AXA Research Fund grant (to B.E.K.); a Consejo Nacional de Ciencia y Tecnología de Me´xico (Mexican government) grant (to A.P.-A.); a Ministe`re de l’enseignement supe´rieur et de la recherche (French government) grant (to J.C.); and Fondation pour la Recherche Me´dicale grants (to B.E.K. and J.C.). We thank William A. Mackay and Laurent Goffart for critically reading the manuscript; Emmanuel Procyk and Martine Meunier for making available to us the MRI scanner facility (Institut National de la Sante´ et de la Recherche Me´dicale, Lyon, France); Thomas Brochier for generously sharing needed equipment; Ivan Balansard and Marc Martin for animal care; and Joel Baurberg, Alain De Moya, and Xavier Degio-vanni for technical assistance. We also thank two anonymous reviewers for insightful comments on an earlier version of this manuscript.
Correspondence should be addressed to Joachim Confais, Institut de Neurosciences de la Timone, Campus Sante´ Timone, 27 Bd. Jean Moulin, 13385 Marseille Cedex 5, France. E-mail: [email protected].
Adria´n Ponce Alvarez’s present address: Computational Neuroscience Group, Department of Technology, Univer-sitat Pompeu Fabra, Roc Boronat, 138, E-080818 Barcelona, Spain.
DOI:10.1523/JNEUROSCI.1768-12.2012
Copyright © 2012 the authors 0270-6474/12/3215359-10$15.00/0
tions, the prevalence of directional selectivity in the two catego-ries of anticipatory neurons is comparable, suggesting a similar degree of involvement in early and late motor preparation. We propose that this anticipatory activity reflects a presetting mech-anism to allow an optimal processing of the visual information, while prohibiting a premature response. Preliminary data were presented in Confais et al. (2011).
Materials and Methods
Animal preparation. Two adult male Rhesus monkeys (T and M, both 9
kg) participated in this study. Care and treatment of the animals during all stages of the experiments conformed to the European and French government regulations.
A detailed description of animal preparation and the behavioral task was given in Kilavik et al. (2010) and is briefly outlined here. After learn-ing the task, the monkeys were prepared for multielectrode recordlearn-ings in the right hemisphere of the motor cortex, contralateral to the trained arm. The chamber locations above motor cortex were verified with T1-weighted MRI scans in both monkeys, and intracortical microstimula-tion (ICMS) allowed further subdivision into M1 and PMd in monkey M (Kilavik et al., 2010). Locations in which microstimulation of⬍20A current induced muscle twitches were defined as M1. Other locations where higher current was needed were denoted PMd. Twitches could also be evoked at the most anterior recording locations, indicating that we remained within the caudal part of PMd. The recording depths (⬍2 mm below the dura) suggested that we recorded from the rostral part of M1 in the precentral gyrus, and not in the anterior bank of the central sulcus. The different recording locations spanned a diameter of⬃3 and 12 mm on the surface in monkeys T and M, respectively.
A multielectrode, computer-controlled microdrive (MT-EPS, Al-phaOmega) was used to transdurally insert up to four microelectrodes in monkey T and up to eight microelectrodes in monkey M. Signals were amplified and bandpass filtered from 0.3 to 10 kHz to obtain the high-frequency signal, on which an online spike-shape detection method was applied (MSD, AlphaOmega), allowing isolation of up to three spike shapes per electrode. The timing of each spike was then stored as transis-tor–transistor logic pulses at a temporal resolution of 32 kHz. In parallel, the raw, unfiltered signal was digitized and stored at 32 kHz, and used to carry out offline spike sorting by Principal Component Analysis-based software [Mclust (Normal Mixture Modeling for Model-Based Cluster-ing, Classification, and Density Estimation), http://www.stat.washington. edu/mclust/] when the online spike sorting was uncertain. Behavioral data were transmitted online to AlphaMap (AlphaOmega) from the Cor-tex software (NIMH, http://dally.nimh.nih.gov/), which was used to control the task.
Behavioral task. For more than one year, we trained the monkeys to
make arm movements from a common center position in six directions in the horizontal plane. However, after the recordings started, in some sessions only two opposite directions were used (26% of the sessions in monkey T and 36% in Monkey M). In the remainder of the recording sessions, all six directions were used. The monkeys had continuous mon-itor feedback about hand (cursor) and the six possible target positions (red outlines).
Two delays were presented successively in each trial (Fig. 1 A), the first (D1) demanding temporal attention in anticipation of the visual SC and the second (D2) involving visuomotor integration and movement preparation while waiting for the GO signal. Delay duration (short or long) was modu-lated from trial to trial in a pseudorandom fashion, but was kept the same for both delays within one trial. The monkey started each trial by moving the handle to the center and holding it there for 700 ms until a temporal cue (TC) was presented. Each TC consisted of a 200 ms long tone, its pitch indicating the delay duration to be estimated, starting at the end of the tone (low pitch for short delay and high pitch for long delay). For monkey M, one of two visual cues was simultaneously presented centrally on the monitor. Neither of the two animals had visual/auditory-evoked potentials to TC in the local field potential (LFP) (Kilavik et al., 2010) and⬍1% of the recorded neurons responded phasically to TC, suggesting that TC was encoded and used in motor cortex in a similar way in the two monkeys, despite the difference in
the sensory modalities of the cue (auditory only vs combined auditory and visual).
For monkey T, the short delay was fixed to 700 ms and the long delay was fixed to 1500 ms. For monkey M, the short delay was fixed to 1000 ms and the long delay was fixed to 2000 ms. The delay that followed TC (D1) demanded attention in time (i.e., temporal expectation; Coull and No-bre, 2008) to perceive the SC that was presented very briefly (55 ms) at the end of the delay at the peripheral target location. To assure the temporal precision of SC illumination, light-emitting diodes (LEDs) were used. These were mounted in front of the computer screen. The SC was sub-sequently masked by the additional illumination of the five remaining LEDs, marking the start of D2. During D2, the monkey had to remember and prepare for the movement direction indicated by the visual SC. All LEDs went off at the end of D2 (GO signal), indicating to the monkey to perform the movement. Even though the delay durations were slightly different for each monkey, all delays were within the range of 700 –2000 ms, where timing performance is rather uniform and expected to depend on the same mechanism (Gibbon et al., 1997; Lewis and Miall, 2009). The two monkeys had similar differences in performance between short-delay and long-short-delay trials (see Results). The reaction time (RT) was computed online to reward the monkey according to the outcome of the trial, by detecting when the pointer left the central target (a maximum of 500 ms RT and 500 ms movement time to arrive at the peripheral target was allowed). For a better accuracy, the RT used in further analyses was computed again offline, and defined as the moment when the trajectory of at least one of the x and y movement coordinates reached a predefined threshold (Kilavik et al., 2010).
Data analysis. All analyses were conducted using the software Matlab
(MathWorks) version 7.10 and 7.12 on a Linux platform.
Averaged activity. The averaged perievent time histogram (PETH) of
each neuron category was computed. The mean spike count of each neuron was computed with a temporal resolution of 1 ms across all movement directions, then smoothed with a Gaussian filter (length, 50 ms; SD, 15 ms) and converted in spikes per second. Then, the smoothed firing rates were averaged separately for different neuron categories (see Fig. 2). To assess the difference of firing rate between different categories of neurons at the population level, we typically used a Mann–Whitney U test on fixed time windows, as described in Results.
Firing rate peak detection. For each neuron, the peak in the mean
activity following SC (if any) was detected for each neuron, to com-pute its latency and amplitude. The direction with the highest spike count in a 200 ms window following SC (preferred direction) was selected to conduct the analysis independently for each neuron. For each neuron, the PETH was computed with a 1 ms resolution and smoothed in a 700 ms time window starting 200 before the onset of the SC. The moment of the peak firing rate (see Fig. 3 B, C) was located using the Matlab function findpeaks, which compares each data point against its two neighbors under the following set of parameters: the peak amplitude (difference between the peak activity and the mini-mum activity in the window) must be at least 5 spikes/s, and the peak latency 40 ms or more after SC onset. If several peaks were detected, the one with the highest firing rate was selected. All analyses were subsequently controlled by visual inspection to avoid any spurious peak detection. The same method was used to detect the moment of peak firing rate around movement, except that the data of all trials in one movement direction were aligned to movement onset before computing the smoothed PETH. The direction with the highest firing rate in a 200 ms epoch centered on movement onset was selected for further analysis. The moment with maximal firing rate was then searched in a 600 ms window centered on movement onset. As a control, trial-by-trial peak detection was also performed by comput-ing the maximum fircomput-ing rate in a slidcomput-ing window in the same epochs, and taking the median latency of this maximum for each neuron. The results were very similar, and only the results based on the method using the averaged activity are reported.
Directional selectivity. The time-resolved directional selectivity of the
firing rate during D2 was computed separately for each neuron (see Fig. 5A). A method based on the vector sum was used to compute the pre-ferred direction of the neuron in a given time bin, as well as the
magni-tude of the directional selectivity. This method has already been applied to LFP data by Kilavik et al. (2010, 2012). Only the sessions including six directions were used for this analysis. This rules out the possibility of misclassifying as nonselective neurons that may have a preferred direc-tion orthogonal to the two presented in two-direcdirec-tion sessions. For each neuron in long-delay trials, the mean firing rate in each direction was computed in a sliding window of 200 ms, shifted by 25 ms, from 400 ms before SC to 900 ms after GO. Within each time window, the mean firing rate provided the magnitude of six vectors, pointing in the six movement directions. The mean resultant vector was then computed to get the preferred direction and the magnitude of the selectivity (the length of the vector). To test the significance of the tuning, a shuffle test was used: the trials were randomized across the six directions to compute a resultant vector “due to chance.” The procedure was repeated 1000 times. If the real vector was longer than 95% of the shuffle vectors, the tuning was deemed significant. To avoid false positives due to a very low firing rate, a minimum 5 Hz criterion in the preferred direction of the neuron was added. Additionally, to control for local firing rate fluctua-tions, only series of at least three significant windows in a row were considered. Figure 5 shows that the amount of directionally selective neurons before the SC is virtually 0, indicating that our method to con-trol false positives is efficient.
To assess the potential directional tuning of a neuronal population as a whole, a Hodges-Ajne test (circular statistics toolbox, Berens, 2009) was used: if the test reached significance ( p⬍ 0.05), the neuronal population deviated from uniformity, and its preferred direction was calculated by a mean resultant vector. Oth-erwise, the preferred directions of the neurons were too evenly spread, and the population as a whole was not considered tuned. Conse-quently, the angular difference between the preferred directions of two populations could only be computed if both of them were signif-icantly tuned in the first place. In this case, the angular difference between the mean vectors of the two populations was computed. Finally, to test for angular difference in preferred di-rections of the two populations in a nonpara-metric way, the individual vectors in the two populations were shuffled and dispatched at random in two groups, and a new angular distance was computed. The procedure was repeated 1000 times. The angular difference between the two populations was deemed significant if it was larger than 95% of the random ones.
Comparison of firing rate in short and long trials during D1. To evaluate whether the
activ-ity of a neuron has an early selectivactiv-ity for the duration of the delay, the firing rate in the epoch following TC was compared between short-delay and long-delay trials (see Fig. 6). For each neuron, the spike count during D1 in the short-delay trials was compared with the corresponding epoch in the long-delay trials (see Fig. 2, corresponding to the period be-tween TC and the dashed lines). A sliding win-dow of 100 ms was shifted in steps of 25 ms, starting 300 ms before TC and ending at the onset of SC in short-delay trials (and at the same moment in long-delay trials). In each time bin, the spike counts of the short-delay and the long-delay trials were compared (Mann– Whitney U test) independently for each neuron. Then, the proportion of neurons with a signifi-cant difference ( p⬍0.05)wascomputedforeach time bin.
Results
Neuronal database and behavior
The behavioral results have already been detailed in Kilavik et al. (2010). Briefly, in both monkeys, RTs were shorter and error rates lower in short-delay trials than in long-delay trials.
In monkey T, the activity of 470 single neurons was recorded in 85 recording sessions. In monkey M, the activity of 745 single neurons was recorded in 147 recording sessions. In monkey M, in which the location of recordings was controlled by ICMS (see Materials and Methods), 251 neurons were assigned to M1 and 489 to PMd. Typically, the activity of each neuron was recorded during 20 correct trials per trial type (direction times delay dura-tion). For monkey T, the activity of 350 neurons was recorded in six-direction sessions, while the activity of 120 neurons was re-corded in two-direction sessions. Meanwhile, for monkey M, the activity of 477 neurons was recorded in six-direction sessions, while the activity of 263 neurons was recorded in two-direction sessions. The raster plot of each neuron was inspected visually, and trials with obvious artifacts were removed from analysis (on
Figure 1. Behavioral paradigm and activity of two representative neurons. A, Left, Drawing of the experimental apparatus showing the SC epoch (note the cursor on the central fixation dot). Right, Sequence of task events, not to scale. Start indicates the moment when the monkey brings the cursor to the center of the screen to initiate a new trial. The note indicates the presentation of a tone. Tone pitch differs according to delay duration. All screen-shots shown in the diagram stay on until the next one appears (cursor is not shown). TC, 200 ms; SC, 55 ms; D1, delay 1, D2, delay 2. Both delays have either short duration (700 ms in monkey T and 1000 ms in monkey M) or long duration (1500 ms in monkey T and 2000 ms in monkey M). There is also a 700 ms delay between start and TC. B, C, Raster plots and PETHs of two neurons (left and right). Top, Short-delay trials; bottom, long-delay trials. All movement directions included. In the raster plots, each dot is an action potential and each row a trial, ordered in chronological order of recording from bottom to top. The thick black lines represent the neuronal activity averaged across all trials and movement directions. The black rectangles on top of each raster display indicate the analysis windows used to classify neurons (see Results).
average, 9% of the trials of 6% of the neurons in monkey T, and 12% of the trials of 14% of the neurons in monkey M were re-moved from analysis).
Anticipatory activity during D1
During D1, between TC and SC, the monkey knew in advance the moment of SC appearance. Thus, the monkey could anticipate the SC. A large number of neurons systematically modulated their firing rate before SC. We labeled such an activity pattern as “anticipatory”. Note that here “anticipatory activity” refers to the activity preceding SC, and does not concern the preparatory ac-tivity in anticipation of movement execution during D2 (between SC and the GO signal). These anticipatory neurons were defined as D1up neurons if they showed a significant upward modulation of activity, or D1down neurons if they showed significant down-ward modulation of activity (see below).
Figure 1 B, C shows the mean activities and spike trains (raster displays) of two representative neurons from our set with antic-ipatory activity. The D1up neuron illustrated in Figure 1 B has a low firing rate at the beginning of the trial and a systematic in-crease of activity starting at⬃400 ms after TC in short-delay and long-delay trials. It is worth noting that the onset of the increase in firing rate is variable from trial to trial (see raster displays). As a response to SC, it exhibits a short-latency burst of activity. This pattern of activity is typical, as will be described below. In trast, the D1down neuron illustrated in Figure 1C shows a con-tinuous decrease in firing rate throughout D1, reaching a minimum just before SC and no burst after SC.
To quantify how many neurons display one of these two prominent activity patterns, a systematic analysis of the firing rate during D1 was conducted. A neuron is defined as anticipatory if its spike count measured in two separate epochs, following TC and preceding SC, (measured in two 150 ms time windows, marked in black in the raster displays in Fig. 1 B, C) differed sig-nificantly within trial (Wilcoxon signed-rank test, p⬍ 0.05). For this analysis, all movement directions of the short-delay trials were pooled, since no spatial information has been provided to the monkey at this moment of the task.
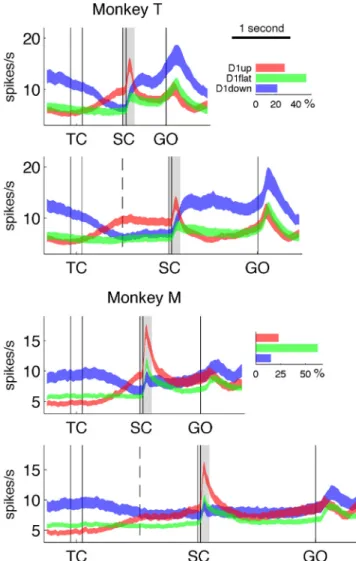
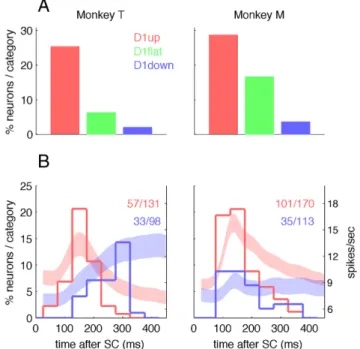
In monkeys T and M, respectively, 49 and 38% of the neurons could be classified as anticipatory. Among them, 57 and 60% were classified as D1up in monkeys T and M, respectively, and the remaining neurons as D1down (43 and 40%, respectively). There were significantly more D1up than D1down neurons in both animals ( p⬍ 0.01,2test). The horizontal bar plots on the right in Figure 2 show these results, but expressed here as a fraction of the total neuronal population: in monkeys T and M, respectively, 28 and 23% of the neurons are D1up, and 21 and 15% are D1down. The D1flat category contains neurons whose activity is not significantly modulated when comparing the start and end of D1. In monkey M, the same percentages of D1up and D1down neurons were recorded in M1 and PMd (D1up: 25 and 22%, respectively, p⫽ 0.85,2test; D1down: 12 and 16%, p⫽ 0.55).
All the subsequently described analyses were tested separately in the two areas, but yielded similar results. Therefore, the neurons from M1 and PMd were pooled in all the results.
In summary, almost half of the recorded motor cortical neu-rons showed an anticipatory activity before the occurrence of a visual cue providing prior information about movement direc-tion. Approximately 60% of these show an increase of activity, being equally distributed in M1 and PMd.
Population activity
Figure 2 shows the mean firing rate of the three neuron catego-ries, averaged across all movement directions (see Materials and Methods). It is clear that the mean firing rate of the three neuro-nal categories is modulated differently in time. The D1down neu-rons have the highest activity before TC, the D1up neuneu-rons show a strong burst of activity shortly after SC, and the D1down neu-rons seem more active than neuneu-rons of the other two categories during movement. The firing rates of the individual neurons in the three categories were measured in three epochs (200 ms be-fore TC, 200 ms after SC, and 200 ms around movement onset) to examine these differences of activity. The results (Table 1) reveal that (1) the population activity of the D1down neurons is signif-icantly higher than that of the D1up neurons in the epoch pre-ceding TC ( p⬍⬍ 0.001 for both monkeys, Mann–Whitney U test across all neurons, with short-delay and long-delay trials pooled); (2) the phasic activity following SC is significantly higher in the D1up neurons than in the D1down neurons (virtually absent in the latter: p⬍ 0.01 and p ⬍⬍ 0.001 for monkey T and M, respec-tively); and (3) the firing rate during movement execution is
Figure 2. Population activity and proportion of the neurons in the three categories. The curves represent the mean firing rate⫾ SEM, with the D1up neurons in red, D1down in blue, and D1flat in green. The bar plots on the right represent separately for the two monkeys the percentages of each neuron category among the whole neuronal populations. The dashed lines in the middle of D1 (delay between TC and SC) indicate the time of the SC in short-delay trials. The light gray rectangles illustrate the central analysis window used to classify phasic responses to SC; see Results.
higher in the D1down neurons than in the D1up neurons, but this is significant only in monkey T ( p⬍⬍ 0.001). The mean activity of the D1flat neurons shows less modulation than that of the other neuron categories, which could be due to the possible heterogeneous nature of this category.
If the population is considered as a whole, the mean firing rate of the neurons from the three categories at the end of D1 is not different between short-delay and long-delay trials (Mann– Whitney U test in a 200 ms time window, p⫽ 0.85 and p ⫽ 0.71 in monkey T and M, respectively). This can be explained by the fact that neurons with a higher firing rate in short-delay trials than in long-delay trials are in the same proportion as neurons showing the opposite pattern. In monkey T, 14% of neurons are more active in short-delay than in long-delay trials, and 19% show the opposite pattern (2test, p⫽ 0.06). In monkey M, 10%
of the neurons are more active in short-delay trials and 12% are more active in long-delay trials, which is also not significantly different ( p⫽ 0.4). These results also hold if only the anticipatory neurons are selected ( p⫽ 0.75 and p ⫽ 0.35 in monkey T and M, respectively). In summary, the changes of firing rate of all indi-vidual neurons seem to balance each other out and lead to the same mean population firing rate before the onset of SC, regard-less of the duration of D1.
Characterization of the phasic activity following SC
By classifying the neurons on the sole basis of their increasing or decreasing firing pattern during D1, two striking differences in their mean activity during D2 emerge (see above). The D1up neurons show a strong burst of activity shortly after the SC, vir-tually absent in the D1down neurons. Conversely, the D1down neurons are more active than the D1up neurons during move-ment execution itself. We therefore studied these two epochs in more detail. The proportion of neurons with an early phasic ac-tivity was computed for each neuron category. However, the pop-ulation peak amplitudes might differ for two reasons: fewer D1down neurons display a phasic activity, and/or their activity peaks have more variable latencies. Two analyses were done to characterize the phasic activity of individual neurons following SC to account for these two possibilities.
First, a neuron was defined as “phasic” if its firing rate was higher in a short epoch following the onset of SC than in the two adjacent periods around it. For each neuron, the single trial spike count of the 200 ms time window shown in gray in Figure 2 was compared with the two adjacent ones (of the same duration) with all movement directions pooled together (two Wilcoxon signed-rank tests, p⬍ 0.05). If both tests reached significance, the neu-ron was classified as “phasic.” To temporally dissociate the activity related to SC from the movement-related activity, only long-delay trials were considered. This analysis shows that the probability of having an early phasic activity burst following SC is strongly correlated with the type of activity during D1 (Fig. 3A).
The percentage of neurons with an early phasic activity burst after SC is highest in the D1up neurons, lowest in the D1down neu-rons, and intermediate in the D1flat neurons. All differences were statistically significant in both monkeys (2tests, p⬍ 0.05),
ex-cept between D1flat neurons and D1down neurons in monkey T. Many motor cortical neurons are directionally selective as soon as a stimulus such as SC is presented (Riehle and Requin, 1989; Shen and Alexander, 1997a,b; for review, see Riehle, 2005). If one of the populations of neurons contained more directionally selective neurons than the other, this could artificially increase the firing rate variability when pooling trials across all movement direc-tions. We therefore also tested all neurons using only the pre-ferred direction of each neuron (data not shown). The overall results were the same, but the percentage of significantly phasic neurons decreased slightly (presumably because of the smaller number of included trials).
Second, the latency of the peak of activity after SC was com-puted for each neuron. The peak was searched in a time window between 40 and 500 ms after SC [40 ms corresponding to the shortest motor cortical response to a visual stimulation (Riehle, 1991)] only in long-delay trials. The distributions of all peak latencies were then plotted separately for the D1up and D1down neurons in (Fig. 3 B, C). The results from this second analysis confirm those from the first analysis in the sense that more D1up than D1down neurons have an early peak (⬍200 ms). However, there are clear differences between the two monkeys. In monkey T, we found similar proportions with a detected peak in both categories of neurons (44 and 34%, respectively;2 test, p⫽
Table 1. Mean firing rates (spikes/sⴞ SEM) during different epochs of the trial
Before TC After SC Around movement Monkey T D1up (n⫽ 129) 5.6⫾ 0.6 11.9⫾ 1 9.6⫾ 1.1 D1flat (n⫽ 228) 6.8⫾ 0.8 7.9⫾ 0.8 10.5⫾ 1 D1down (n⫽ 95) 11.6⫾ 1.1 8.4⫾ 0.9 15.9⫾ 1.8 Monkey M D1up (n⫽ 168) 4.9⫾ 0.4 13.1⫾ 0.8 9.2⫾ 0.8 D1flat (n⫽ 455) 6.0⫾ 0.4 8.6⫾ 0.5 8.5⫾ 0.5 D1down (n⫽ 113) 9.4⫾ 0.9 8.1⫾ 0.8 10.4⫾ 1
Figure 3. Phasic activity following SC. A, Percentages of neurons with a phasic burst of activity in 200 ms following SC, expressed as a fraction of the numbers of neurons per category. The trials of all movement directions of long-delay trials are pooled for this analysis. All com-parisons of differences between categories are significant for both monkeys (2test, p⬍
0.05), except between D1flat and D1down in monkey T. B, Histograms, Distributions of the neurons’ peak firing rate latencies, shown as percentages in each category (left ordinate axis). D1up, red; D1down, blue. The digits in the top right corners are the numbers of cells with a detected peak of the total number of neurons in each category. The abscissa represents in milliseconds the peak latency compared with SC onset. For comparison, the PETHs of the two categories in the same epoch have been reproduced in the background, with the firing rate scale indicated on the right ordinate axis. Please note that, unlike the histograms of peak latencies, the PETHs include the activity of all recorded cells, not just the ones with a detected peak. Confais et al.• Cue Anticipatory Activity in Motor Cortex J. Neurosci., October 31, 2012•32(44):15359 –15368 • 15363
0.15), but the median peak latencies were significantly shorter in the D1up than in the D1down neurons (151 and 250 ms, respec-tively; Mann–Whitney U test, p⬍⬍ 0.001). In monkey M, the median peak latencies were not different between D1up and D1down neurons (145 and 162 ms, p⫽ 0.22), but significantly more D1up than D1down neurons showed a peak of activity (59 and 31%, p⬍⬍ 0.01). These differences in peak latency distribu-tions are clearly reflected in the mean population activity shown in Figure 2, which is reproduced in the background of Figure 3. In monkey T, the response to SC of the D1down neurons seems delayed compared with the D1up activity, but has a similar am-plitude, whereas in monkey M, all categories of neurons show a short-latency change of activity, but with a higher amplitude and a more phasic response in the D1up than in the D1down neurons. In conclusion, the second analysis confirms that the D1up neu-rons are more likely to have a burst of activity in the early epoch following SC than the D1down neurons.
Using the same method as in the previous paragraph, but in a 600 ms time window centered on movement onset, the same analysis was performed on the movement-related activity. The distributions of the motor peak latencies of the D1up and D1down neurons are largely overlapping, but significantly dif-ferent in monkey T ( p⬍ 0.01), with D1up neurons peaking on average 43 ms earlier than D1down neurons. The same ten-dency can be seen in monkey M ( p ⫽ 0.06), with a mean difference of 36 ms.
Comparison of visual-related and movement-related activity
As described above, the D1up neurons discharge, on average, with a higher firing rate during the epoch following SC than during movement execution, whereas the D1down neurons ex-hibit the opposite firing pattern (Fig. 2). However, this difference in mean activity may be due to a high firing rate of a small number of dominant neurons. To rule out this possibility, the discharge evoked by SC and that related to movement execution were com-pared for each neuron (Fig. 4). The single-trial spike counts in two 200 ms time windows were compared: the first one following SC and the second around movement onset. Figure 6 shows for each monkey the proportion of D1up, D1flat, and D1down neu-rons with a significant (Wilcoxon signed-rank test, p⬍ 0.05) higher spike count in the visual than in the motor epoch (left), and with a significant higher spike count in the motor than in the visual epoch (right). The proportion of neurons with a higher firing rate during the visual than during the motor epoch is high-est in the D1up neurons and lowhigh-est in the D1down neurons. Conversely, the D1down category has the highest proportion of neurons with a preference for the motor over the visual epoch, followed by the D1flat and then the D1up categories. Note that the proportion of neurons with a higher firing rate in the visual epoch cannot be accounted for solely by the presence of an early phasic activity. For example, this phasic activity is only present in 30% of the D1up neurons of monkey M (Fig. 3A), and Figure 4 shows that twice as many D1up neurons are more active in the visual than in the motor epoch. In summary, neurons that increase their activity before the SC have a tendency to exhibit a short-latency burst following the cue, and to have in general a higher firing rate during the first part of D2 than during movement execution. In contrast, neurons that decrease their firing rate before the SC tend to be quieter in the early epoch following it, and are more active during movement execution than during the early processing of the visual cue. This may sug-gest that the two populations of neurons are sequentially involved in movement preparation.
Directional selectivity
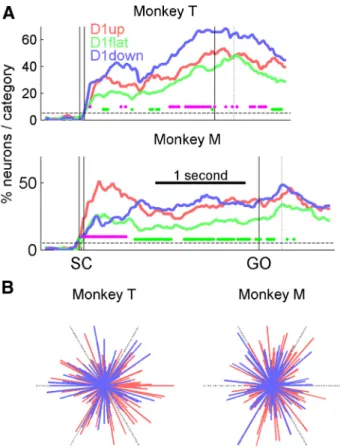
If neurons are involved in the preparation of a motor act, their activity should reflect some movement parameters, such as its direction. In other words, if the D1up and D1down neurons are involved in different phases of movement preparation, one might expect the activity to be differentially selective to movement di-rection, depending on task epoch. The time-resolved ratio of neurons being selective for movement direction was therefore computed separately for the three categories, to evaluate whether the evolution of this ratio differed across categories. We assessed the directionality of the neurons with a method based on the vector sum in a 200 ms sliding window shifted by 25 ms (see Materials and Methods). The results are shown in Figure 5A for long-delay trials. Only the sessions with six target directions were included. First, two epochs of increased directional selectivity emerge: the epochs following SC and around movement onset. In addition, all three neuron categories have significant ( p⬍ 0.05) proportions of tuned neurons. Second, the two categories of an-ticipatory neurons (D1up and D1down) generally contain higher proportions of significantly directionally selective neurons than the D1flat category. This might be due to the fact that the D1flat neurons did not have to pass any statistical test to be classified as such, and therefore could include noisier or less task-related
Figure 4. Differences in firing rates between the visual and motor epochs. Proportions of neurons in each category with a significantly higher activity in the “visual” than in the “motor” epoch (left), and with a significant higher activity in the “motor” than in the “visual” epoch (right). Only long-delay trials are used, and all movement directions are considered. Because only the neurons with significant differences are shown here, the total percentage within each neuron category does not necessarily add up to 100. All comparisons of differences between categories are significant for both monkeys (2test, p⬍ 0.05), except the difference between D1flat and D1down for visual⬎mvt in monkey M. mvt, movement.
neurons. Third, and most important here, the overall levels of directional selectivity of the two categories of anticipatory neu-rons have comparable magnitudes, albeit with more D1down neurons tuned than D1up neurons in monkey T and more D1up neurons tuned after SC in monkey M. Indeed, no systematic differences of directional selectivity between the D1up and D1down populations can be seen for the two monkeys related to the different task epochs. The overall differences in tuning ob-served between monkeys could be due to the localization of the electrodes: we mainly recorded in PMd in monkey M, but we do not have this information for monkey T. In summary, the se-quentiality observed in the firing rate patterns of the two catego-ries of neurons (Figs. 2– 4) is not reflected in their directional selectivity.
In the work of Mauritz and Wise (1986), the anticipatory activity they observed was interpreted as the anticipation of a rightward movement instruction. In other words, the anticipa-tory activity would merely be a reflection of the preparation of a default movement direction. Even though there is a major differ-ence between their paradigm and ours (they used only 2 direc-tions, and we mainly used 6 directions), their interpretation
could also apply to our data. In our case, the mean RTs of the monkeys in the different movement directions seem to indicate that the behavioral preferred direction (the one with the shortest mean RTs) remained stable throughout the recordings. If we as-sume that this would also be the case for the putative default direction that the animals would be expecting during D1, it al-lows us to directly test the interpretation proposed by Mauritz and Wise (1986). According to this hypothesis, neurons with a preferred direction close to the preferred behavioral direction would be the D1up, and the ones with a preferred direction close to the opposite direction would be the D1down. Thus, as popu-lations, the distributions of the preferred directions of the D1up and D1down neurons should then be unimodal, and have close to opposite selectivity during D2.
Aiming to test this, we first compared the distributions of the preferred directions of the significant directionally selective D1up and D1down neurons in the two task-relevant epochs mentioned above (Fig. 5A), 200 ms following SC and around movement onset (trials aligned to movement onset). In none of these two epochs were both populations tuned (data not shown). However, it is possible that the neurons are tuned at different moments during D2. Thus, restricting the measure of directional selectivity to these two epochs may not give an accurate picture of the directional selectivity of the two neuronal populations. To compensate for this possible bias, we allowed all neurons to have their own “moment in time” of maximal directional selectivity: for each neuron the preferred direction was selected in the epoch with its strongest directional selectivity (the epoch with the lon-gest significant mean vector). The distributions of these preferred directions are shown in Figure 5B: all distributions are homoge-neous (Hodges-Ajne test, p⫽ 0.5 and 0.95 for D1up and D1down in monkey T, and p⫽ 0.72 and 0.73 in monkey M, respectively). These results suggest that either by taking meaningful epochs of the task, or by pooling together all the possible selective epochs during D2, no striking difference in preferred directions can be detected between D1up and D1down neurons. It is therefore unlikely that the anticipatory activity is explained by early direc-tional selectivity.
Comparison of correct and error trials
We postulated that the anticipatory activity in D1 could influence the detection and processing of SC. Monkeys T and M made 21 and 15% of directional errors, respectively (i.e., reaching to the wrong target), indicating that although they were overtrained, the task was still difficult. These directional errors could be (in part) due to the inability of the monkey to correctly identify the SC in some trials. If the activity of the anticipatory neurons in D1 influences the probability of detecting SC, it should be different when the monkey selected the correct target than when he made an error. The firing rate of the 200 ms preceding SC of correct and error trials was compared in two different ways. First, the spike count in the window was compared across single trials for each neuron (Mann–Whitney U test), and the percentage of signifi-cant neurons calculated for the three categories. Second, the ac-tivity in all correct and error trials was averaged separately for each neuron, and a Wilcoxon signed-rank test was computed across all neurons for each of the three categories. Both analyses yielded the same results: there was no significant difference in activity preceding the SC between correct and error trials in any of the neuron categories.
Figure 5. Directional selectivity. A, Percentages of neurons (fractions of the sample size of each neuron category) with significant directional selectivity, calculated in a 200 ms sliding window, shifted by 25 ms. Each magenta dot indicates a window with a significant difference between the D1up and D1down categories (2test, p⬍ 0.05). Each green dot indicates a significant difference between the D1flat category and the lowest of the D1up and D1down categories. The dashed lines indicate the 5% proportion expected by chance. The dotted vertical lines indicate mean RTs. Only neurons recorded in sessions with six directions are used. B, Distributions of the directional vectors of the D1up neurons (red) and D1down neurons (blue), selected in the bin of maximum (significant) magnitude for each neuron. Each vector indicates the preferred direction of a neuron and its magnitude of selectivity. The black dashed lines indicate the directions of the six targets, and their length indicates the unit vector (maximum vector length). All distributions are homogeneous. All neurons that were significantly tuned at least once during D2 are considered: 92 of 106 for D1up and 65 of 67 for D1down in monkey T, and 109 of 124 and 72 of 94 in monkey M.
Behavioral strategies
Figure 2 shows that the mean activity during D1 in long-delay trials is different between the two monkeys. This difference could be due to the variety of strategies that the monkey may have used to solve the task. One strategy may be to use the temporal infor-mation contained in TC to expect SC at the correct moment. The second strategy would be to expect SC at the end of the short delay in all trials. If then it does not appear, the monkey would know that it is a long-delay trial. In fact, we noted that in monkey M, the firing rate profile during D1 changed along the recording ses-sions. To quantify these differences, we compared the firing rate during D1 in short-delay trials and the corresponding first half of the long-delay trials. This was done separately for the first and second halves of the recording sessions (that is, for two periods of 3 months in monkey T, and of 5 months in monkey M). Figure 6 shows the proportion of anticipatory neurons with a significantly different firing rate in short-delay and long-delay trials (Mann– Whitney U test, p⬍ 0.05, see Materials and Methods) separately for each recording period. In monkey T, the proportion of neu-rons with a different firing rate in short-delay and long-delay trials never deviates from chance level (dashed line) in the first or in the last recording sessions. Monkey M shows the same pattern as monkey T in the first recordings, but a completely different one in the second half of the recording sessions. In the late sessions, the activity of up to 40% of the anticipatory neurons differed in short-delay and long-delay trials already shortly after TC, as a function of the temporal information provided by TC. These results suggest that monkey M initially adopted the same strategy as monkey T (always expecting the SC at the end of the short delay), but then switched to another strategy during later sessions (using the temporal information of TC). Nevertheless, it seems that this possible change of strategy in monkey M did not have a striking influence on behavior, since the error rate does not change between the two halves of the recording sessions (2test,
p⫽ 0.75). Additionally, even though the mean reaction time of
monkey M decreased by 21% between early and late sessions, monkey T showed a decrease of 43%, without displaying the change of activity during D1. To see whether the possible change in behavioral strategy by monkey M influenced the neuronal ac-tivity patterns in D2, all analyses presented above were repeated in monkey M by separating the data according to the date of
recording (first vs second half of the sessions). No qualitative difference was observed. In particular, we observed no significant change in the proportion of anticipatory neurons, or in the phasic response to SC, or in the temporal profile of the directional se-lectivity. In conclusion, these results suggest that the possible switch of strategy adopted by monkey M did not change the observed neuronal activity in second part of the trial.
Discussion
We here demonstrate that almost half of the neurons in M1 and PMd exhibit anticipatory activity preceding the expected presen-tation of a relevant SC, well before movement parameters can be processed. Of those, 60% increase their firing rate, whereas the remaining neurons decrease their activity. This anticipatory ac-tivity during the first, nonmotor delay is predictive for the tem-poral profile of the activity during the second, preparatory delay. The difference in activity between neuron categories is especially prominent during the early epoch following the cue, where the probability of having a phasic burst of activity depends upon the type of anticipatory activity. However, both types of anticipatory neurons seem to be similarly involved in motor preparation, as reflected by comparable proportions of directionally selective neurons.
Anticipation and processing of task-related information
Three studies by Wise and collaborators (Mauritz and Wise, 1986; Vaadia et al., 1988; di Pellegrino and Wise, 1993a) ad-dressed anticipatory activity as defined here (i.e., neuronal activ-ity changes in motor cortex occurring before the presentation of task-relevant information). Our results confirm theirs, even if they mainly focused on PMd and on neurons that we call D1up: (1) the proportion of anticipatory neurons is close to ours (be-tween 30 and 50% of the neuronal population) and (2) Mauritz and Wise (1986) show that most of their D1up neurons (46 of 52) exhibit phasic activity following the SC. Thus, it seems that the anticipatory activity we describe is not simply related to our spe-cific task, but a pattern of activity consistently present in motor cortical areas when the monkey can predict the timing of relevant spatial information. Our study is the first one to thoroughly study the D1down neurons, showing that their modulation of activity during the processing of spatial information and during move-ment preparation clearly differs from that of the D1up neurons. Furthermore, even though the activity profiles of D1up and D1down neurons are different, their involvement in the task seems similar, as reflected in the proportions of directionally se-lective neurons. Finally, this anticipatory activity seems similar in M1 and PMd, even though this could be explained by the fact that we recorded rostrally in M1 and caudally in PMd. MacKay and Crammond (1987) reported an anticipatory activity preceding visual stimuli in parietal area 5 of the monkey. The posterior part of this area projects directly to PMd, and the anterior part to M1 (Geyer et al., 2000). We interpreted this activity in terms of pre-dictions of upcoming events based on experience. Our data sug-gest that these predictions might then be fed to motor cortex to facilitate the future processing of the information provided by an instruction signal.
Several studies have shown that the information about move-ment parameters (such as direction) is processed as soon as it is presented (“preprocessing,” Requin, 1985; Riehle and Requin, 1989; for review, see Riehle, 2005). This early processing could be reflected in motor areas by the so-called “signal-related” activity (Weinrich and Wise, 1982; Riehle and Requin, 1989; Crammond and Kalaska, 2000; Cisek and Kalaska, 2005), a short-latency
Figure 6. Selectivity to delay duration during D1. Proportions of anticipatory neurons with an early selectivity to delay duration during D1, according to the period of recording. SCshort, onset of the SC in short-delay trials, and equivalent timing in long-delay trials.
(⬍200 ms) phasic activity following the SC. We find that the proportion of neurons with a peak latency of⬍200 ms following SC drops dramatically from the D1up to the D1down category (Fig. 3 B, C). This suggests that the signal-related neurons are much more likely to display an increasing activity preceding the SC than the others. Furthermore, signal-related activity (Wise et al., 1992; Boussaoud and Wise, 1993a,b; di Pellegrino and Wise, 1993a,b; Crammond and Kalaska, 2000) and precue anticipatory activity (Vaadia et al., 1988; di Pellegrino et Wise, 1993a) are both modulated by the motor meaning of the SC (i.e., whether or not the SC is informative regarding the movement to be executed), suggesting a functional link between the two patterns of activity. Altogether, this supports the idea that when the timing of an SC is known in advance, motor cortex will enter into a preparatory state, enabling an optimal response.
Interpretations of the anticipatory activity
Our task was attentionally very demanding, as it required waiting for the presentation of the very brief SC at a precise moment. Rolke and Hofmann (2007) showed that temporal uncertainty, which increases with delay duration (Gibbon, 1977), degrades perceptual processing. This could in part explain the higher rate of directional errors in long than in short trials (even though other causes could intervene, like the monkey being more dis-tracted during the longer D2). The activity seen during D1 could therefore reflect attentional processes, as it has been shown in PMd in other tasks (Boussaoud, 2001; Lebedev and Wise, 2001). Yet, in the trials where the monkey reached to a wrong target, the firing rate preceding SC was not different from that in the correct trials. Thus, even though the anticipatory activity of the motor areas during D1 relies on temporal attention, we could not dem-onstrate that it influences directly the ability to perceive SC or to choose the correct target.
It was proposed that motor cortical areas could participate in a timing network, when a motor action is to be planned. Lebedev et al. (2008) decoded the duration before or after the initiation of a self-triggered movement from the activity of PMd neurons, and Lucchetti and Bon (2001) showed that the discharge onset of motor cortical neurons depended on the delay before GO. These neurons had ramping activity (increasing or decreasing) similar to what we found in D1. Such a ramping activity has been shown to be a possible substrate of timing processes (Durstewitz, 2004). fMRI studies in humans on implicit timing (i.e., duration does not have to be overtly reported) show frequent activation of the premotor cortex (Coull and Nobre, 1998; Coull et al., 2000), even when no motor act is involved (Schubotz and von Cramon, 2001). Fujioka et al. (2012) showed that in absence of movement, the synchronization of beta oscillations of the MEG signal in the motor cortex were timed to an isochronous signal. This supports the idea that PMd is part of a temporal prediction network (Coull and Nobre, 2008). Recently, Davranche et al. (2011) showed that the BOLD signal of the motor areas (M1 and PM) and of the left intraparietal sulcus (IPS) covaried during a temporal orienting task, but only when the subject had to respond with a movement. This context-dependent recruitment may indicate the modula-tion of a motor anticipatory process in the motor cortex by tem-poral information being processed in IPS. Applied to our task, it would mean that the anticipatory activity seen during D1 could reflect the involvement of the motor system in the estimation of the duration preceding the cue. Furthermore, our data suggest that this timing process could set the motor cortex in a particular (optimal) state before the onset of the cue. We find that, at the time of the cue onset, the same population firing rate is reached
despite the fact that 22–32% of the neurons change their firing rate according to delay duration. Saleh et al. (2010) showed that the power of LFP beta oscillations in the motor cortex of a human subject increased before the onset of an attended relevant cue. We speculate that this precue optimal state reflects two complemen-tary processes: one (represented by D1up neurons) would tune up the gain of cue-processing networks, while the other (D1down neurons) would transiently inhibit the activity of the pyramidal movement-related neurons, to prevent any spurious movement triggering. This might also explain why D1down neurons are directionally selective just after SC. Thus, we can make a predic-tion about activity during the early epoch following SC. The in-stantaneous population vectors (Georgopoulos et al., 1983) of the D1up and D1down neuronal populations would point in differ-ent directions from trial to trial (according to SC), but would systematically stay opposite to each other. The former would represent the planned movement, while the latter would cancel its immediate execution (Riehle et al., 2006). To confirm this prediction, one would need to analyze data from simultaneous recordings of large populations of anticipatory neurons, which is not the case for our dataset.
Conclusion
In this study, we showed that many motor cortical neurons dis-play an anticipatory activity preceding the onset of a relevant cue. Their activity during the motor preparatory part of the task is modulated according to their precue activity, especially during the early epoch following the onset of the relevant cue and during movement execution. We propose that whenever there is temporal information available allowing cue anticipation, motor cortex, pre-sumably along with other areas involved in time estimation or motor preparation, enters into an optimal preparatory state, enabling a more efficient processing of the incoming spatial information or its transformation into a motor command (“presetting”; Requin, 1985), while preventing a premature response in tasks that require delayed motor response.
References
Berens P (2009) CircStat: a Matlab toolbox for circular statistics. J Stat Soft 31. Available at http://www.jstatsoft.org/v31/i10.
Boussaoud D (2001) Attention versus intention in the primate premotor cortex. Neuroimage 14:S40 –S45.
Boussaoud D, Wise SP (1993a) Primate frontal cortex: neuronal activity following attentional versus intentional cues. Exp Brain Res 95:15–27. Boussaoud D, Wise SP (1993b) Primate frontal cortex: effects of stimulus
and movement. Exp Brain Res 95:28 – 40.
Cisek P, Kalaska JF (2005) Neural correlates of reaching decisions in dorsal premotor cortex: specification of multiple direction choices and final selection of action. Neuron 45:801– 814.
Confais J, Kilavik B, Ponce-Alvarez A, Riehle A (2011) Visually-related an-ticipatory activity in motor cortical neurons predicts their involvement in preparatory processes. Program No. 803.3. 2011 Neuroscience Meeting Planner. Washington, DC: Society for Neuroscience.
Coull JT, Nobre AC (1998) Where and when to pay attention: the neural systems for directing attention to spatial locations and to time intervals as revealed by both PET and fMRI. J Neurosci 18:7426 –7435.
Coull J, Nobre A (2008) Dissociating explicit timing from temporal expec-tation with fMRI. Curr Opin Neurobiol 18:137–144.
Coull JT, Frith CD, Bu¨chel C, Nobre AC (2000) Orienting attention in time: behavioural and neuroanatomical distinction between exogenous and en-dogenous shifts. Neuropsychologia 38:808 – 819.
Crammond DJ, Kalaska JF (1996) Differential relation of discharge in pri-mary motor cortex and premotor cortex to movements versus actively maintained postures during a reaching task. Exp Brain Res 108:45– 61. Crammond DJ, Kalaska JF (2000) Prior information in motor and
premo-tor cortex: activity during the delay period and effect on pre-movement activity. J Neurophysiol 84:986 –1005.
Davranche K, Nazarian B, Vidal F, Coull J (2011) Orienting attention in time activates left intraparietal sulcus for both perceptual and motor task goals. J Cogn Neurosci 23:3318 –3330.
di Pellegrino G, Wise SP (1993a) Visuospatial versus visuomotor activity in the premotor and prefrontal cortex of a primate. J Neurosci 13:1227–1243. di Pellegrino G, Wise SP (1993b) Effects of attention on visuomotor activity
in the premotor and prefrontal cortex of a primate. Somatosens Mot Res 10:245–262.
Durstewitz D (2004) Neural representation of interval time. Neuroreport 15:745–749.
Fujioka T, Trainor LJ, Large EW, Ross B (2012) Internalized timing of iso-chronous sounds is represented in neuromagnetic beta oscillations. J Neurosci 32:1791–1802.
Georgopoulos AP, Caminiti R, Kalaska JF, Massey JT (1983) Spatial coding of movement: a hypothesis concerning the coding of movement direction by motor cortical populations. Exp Brain Res [Suppl] 7:327–336. Geyer S, Matelli M, Luppino G, Zilles K (2000) Functional neuroanatomy of
the primate isocortical motor system. Anat Embryol 202:443– 474. Gibbon J (1977) Scalar expectancy theory and Weber’s law in animal
tim-ing. Psychol Rev 84:279 –325.
Gibbon J, Malapani C, Dale CL, Gallistel C (1997) Toward a neurobiology of temporal cognition: advances and challenges. Curr Opin Neurobiol 7:170 –184.
Godschalk M, Lemon RN, Nijs HG, Kuypers HG (1981) Behaviour of neu-rons in monkey peri-arcuate and precentral cortex before and during visually guided arm and hand movements. Exp Brain Res 44:113–116. Kilavik BE, Confais J, Ponce-Alvarez A, Diesmann M, Riehle A (2010)
Evoked potentials in motor cortical local field potentials reflect task tim-ing and behavioral performance. J Neurophysiol 104:2338 –2351. Kilavik BE, Ponce-Alvarez A, Trachel R, Confais J, Takerkart S, Riehle A
(2012) Context-related frequency modulations of macaque motor corti-cal LFP beta oscillations. Cereb Cortex 22:2148 –2159.
Lebedev MA, Wise SP (2001) Tuning for the orientation of spatial attention in dorsal premotor cortex. Eur J Neurosci 13:1002–1008.
Lebedev MA, O’Doherty JE, Nicolelis MA (2008) Decoding of temporal in-tervals from cortical ensemble activity. J Neurophysiol 99:166 –186. Lewis PA, Miall RC (2009) The precision of temporal judgement:
millisec-onds, many minutes, and beyond. Philos Trans R Soc Lond B Biol Sci 364:1897–1905.
Lucchetti C, Bon L (2001) Time-modulated neuronal activity in the premo-tor cortex of macaque monkeys. Exp Brain Res 141:254 –260.
MacKay WA, Crammond DJ (1987) Neuronal correlates in posterior pari-etal lobe of the expectation of events. Behav Brain Res 24:167–179. Mauritz KH, Wise SP (1986) Premotor cortex of the rhesus monkey:
neu-ronal activity in anticipation of predictable environmental events. Exp Brain Res 61:229 –244.
Miller J, Riehle A, Requin J (1992) Effects of preliminary perceptual output on neuronal activity of the primary motor cortex. J Exp Psychol Hum Percept Perform 18:1121–1138.
Niki H, Watanabe M (1979) Prefrontal and cingulate unit activity during timing behavior in the monkey. Brain Res 171:213–224.
Renoult L, Roux S, Riehle A (2006) Time is a rubberband: neuronal activity in monkey motor cortex in relation to time estimation. Eur J Neurosci 23:3098 –3108.
Requin J (1985) Looking forward to moving soon. Ante factum selective
processes in motor control. In: Attention and performance XI (Posner M, Marin O, eds), pp 147–167. Hillsdale, NJ: Lawrence Erlbaum.
Riehle A (1991) Visually induced signal-locked neuronal activity changes in precentral motor areas of the monkey: hierarchical progression of signal processing. Brain Res 540:131–137.
Riehle A (2005) Preparation for action: one of the key functions of the mo-tor cortex. In: Momo-tor cortex in voluntary movements: a distributed system for distributed functions (Riehle A, Vaadia E, eds), 213–240. Boca Raton, FL: CRC.
Riehle A, Requin J (1989) Monkey primary motor and premotor cortex: single-cell activity related to prior information about direction and extent of an intended movement. J Neurophysiol 61:534 –549.
Riehle A, Grammont F, MacKay WA (2006) Cancellation of a planned movement in monkey motor cortex. Neuroreport 17:281–285. Rolke B, Hofmann P (2007) Temporal uncertainty degrades perceptual
processing. Psychonomic Bull Rev 14:522–526.
Saleh M, Reimer J, Penn R, Ojakangas CL, Hatsopoulos NG (2010) Fast and slow oscillations in human primary motor cortex predict oncoming be-haviorally relevant cues. Neuron 65:461– 471.
Roux S, Coulmance M, Riehle A (2003) Context-related representation of timing processes in monkey motor cortex. Eur J Neurosci 18:1011–1016. Schubotz RI, von Cramon DY (2001) Functional organization of the lateral premotor cortex: fMRI reveals different regions activated by anticipation of object properties, location and speed. Brain Res Cogn Brain Res 11:97–112.
Shen L, Alexander GE (1997a) Neural correlates of a spatial sensory-to-motor transformation in primary sensory-to-motor cortex. J Neurophysiol 77:1171– 1194.
Shen L, Alexander GE (1997b) Preferential representation of instructed target location versus limb trajectory in dorsal premotor area. J Neu-rophysiol 77:1195–1212.
Vaadia E, Benson DA, Hienz RD, Goldstein MH Jr (1986) Unit study of monkey frontal cortex: active localization of auditory and of visual stim-uli. J Neurophysiol 56:934 –952.
Vaadia E, Kurata K, Wise SP (1988) Neuronal activity preceding directional and nondirectional cues in the premotor cortex of rhesus monkeys. So-matosens Motor Res 6:207–230.
Weinrich M, Wise SP (1982) The premotor cortex of the monkey. J Neuro-sci 2:1329 –1345.
Weinrich M, Wise SP, Mauritz KH (1984) A neurophysiological study of the premotor cortex in the rhesus monkey. Brain 107:385– 414.
Wise SP, Kurata K (1989) Set-related activity in the premotor cortex of rhe-sus monkeys: effect of triggering cues and relatively long delay intervals. Somatosens Motor Res 6:455– 476.
Wise SP, Mauritz KH (1985) Set-related neuronal activity in the premotor cortex of rhesus monkeys: effects of changes in motor set. Proc R Soc Lond B Biol Sci 223:331–354.
Wise SP, Di Pellegrino G, Boussaoud D (1992) Primate premotor cortex: dissociation of visuomotor from sensory signals. J Neurophysiol 68:969 –972.
Yamagata T, Nakayama Y, Tanji J, Hoshi E (2009) Processing of visual sig-nals for direct specification of motor targets and for conceptual represen-tation of action targets in the dorsal and ventral premotor cortex. J Neurophysiol 102:3280 –3294.