HAL Id: hal-02436678
https://hal.archives-ouvertes.fr/hal-02436678
Submitted on 13 Jan 2020
HAL is a multi-disciplinary open access
archive for the deposit and dissemination of
sci-entific research documents, whether they are
pub-lished or not. The documents may come from
teaching and research institutions in France or
abroad, or from public or private research centers.
L’archive ouverte pluridisciplinaire HAL, est
destinée au dépôt et à la diffusion de documents
scientifiques de niveau recherche, publiés ou non,
émanant des établissements d’enseignement et de
recherche français ou étrangers, des laboratoires
publics ou privés.
Nucleation and growth mechanisms of trivalent
chromium conversion coatings on 2024-T3 aluminium
alloy
Xavier Verdalet-Guardiola, Benoit Fori, Jean-Pierre Bonino, Sandrine
Nathalie Duluard, Christine Blanc
To cite this version:
Xavier Verdalet-Guardiola, Benoit Fori, Jean-Pierre Bonino, Sandrine Nathalie Duluard, Christine
Blanc. Nucleation and growth mechanisms of trivalent chromium conversion coatings on 2024-T3
aluminium alloy. Corrosion Science, Elsevier, 2019, 155, pp.109-120. �10.1016/j.corsci.2019.04.035�.
�hal-02436678�
OATAO is an open access repository that collects the work of Toulouse
researchers and makes it freely available over the web where possible
Any correspondence concerning this service should be sent
to the repository administrator:
tech-oatao@listes-diff.inp-toulouse.fr
This is an author’s version published in:
http://oatao.univ-toulouse.fr/25262
To cite this version:
Verdalet-Guardiola, Xavier
and Fori, Benoit and Bonino, Jean-Pierre
and
Duluard, Sandrine Nathalie
and Blanc, Christine
Nucleation and growth
mechanisms of trivalent chromium conversion coatings on 2024-T3 aluminium
alloy. (2019) Corrosion Science, 155. 109-120. ISSN 0010-938X
Nucleation and growth mechanisms of trivalent chromium conversion
coatings on 2024-T3 aluminium alloy
Xavier Verdalet-Guardiola
a,
b,
c,
Benoit Fori
C,
Jean-Pierre Bonino
h,
Sandrine Duluard
h,
Christine Blanc
a,
*
• ClRIMA T, Un1"'1'Slti de Toulouse, CNRS, INP-ENSIACET, 4 allée Emile Manso • BP 44362, 31030 Toulouse œdex 4, France
b ClRIMAT, Universlti de Tculouse, CNRS, lJn1verslii Tculouse 3 • Pad SobatJu, 118 rouu de Narbonne, 31062 Toulouse œdex 9, France • MECAPROTEC lrutistries, 34 Bculewml de Joffruy, BP 30204, 3160S Muret Cedex, France
ARTICLE INFO ABSTR ACT
Keywords: A Alumlnium alloy A Copper B. EIS B.XPS
C. Trivalent chromlum coatlng
Nucleation and growth mechanisms of trivalent chromium conversion coatings on 2024 aluminium alloy ( AA 2024) were studied. Nucleation of 25 nm diameter nodules was observed on the ridges of the scalloped structure of degreased and desmutted AA 2024 after very short tiine of conversion treatment corresponding to the for mation of a 12 nm thick precursor layer. Then, the composition of this layer evolved and concomitantly a chromium and zirconium outer layer deposited on top of it. Rather long-lasting anticorrosive properties were measured even for conversion coatings formed after short exposure to the conversion bath, except for the precursor layer.
1. Introduction
Due to their high specific modulus, aluminium alloys are widely used in the aeronautical domain [1). The addition of specific alloying elements increases the mechanical propa-ties of aluminium, but has a detrimental effect on its corrosion resistance [2,3). As a consequence, for most of their applications, aluminium alloys cannot be used without surface treatment. Hexavalent chromium conversion coatings are Jar gely used to prevent corrosion of aluminium alloys. However, in 2013, the European Regulation REACh adopted a ban on the use of
ercvn [
4).For the aeronautical field, this restriction will become effective in 2024 so that a lot of research studies are focused on the development of Cr (VI) free coatings, for example the trivalent chromium process (TCP) that is already commercially available [5 14). The anticorrosive properties of TCP coatings have already been studied extensively and the results showed that this new type of conversion coating is pro mising; the optimisation of their performance is still possible and should make the TCP proœss a very powerful solution [8,9,11 20). For this purpose, a better insight on the nucleation and growth mechanisms of TCP coatings should be helpful [12,21 23). Different scenarios and hypotheses are proposed in the literature. Unlike chromate coatings, for which a redox reaction based formation mechanism is proposed, TCP coatings are formed via a pH assisted precipitation [8,22,23). lt is as sumed that, in a first step, the native aluminium oxide thickness
• Corresponding author.
decreases and metallic aluminium can be oxidised. This reaction con sumes protons and leads to a pH rise near the surface so that chromium and zirconium hydroxides precipitate at the surface. The reaction rate decreases as the surface becomes fully covered by the coating. This general process is generally admitted and supported by several studies. Dardona et al. [22) studied the growth of a TCP coating on pure alu minium by in situ spectroscopie ellipsometry. They proposed a three step mechanism: (i) an induction pa-iod with no growth of the coating and dissolution of the native oxide by F- ions; (il) rapid growth of the coating with a thickness vs. time linear law; (ili) low i.e. a logarithmic law, or no growth of the coating. Similar mechanisms were reported by Qi et al. [13) based on the open circuit potential (OCP) variation of pure aluminium when immersed in the TCP solution. However, the studies do not detail the origin of the duplex layer microstructure of the coating. Li et al. [7) suggested that, once the native oxide layer was dissolved, the aluminium was oxidised by fluoride ions and formed an inner layer of fluoroaluminates. Chromium and zirconium hydroxides precipitated at the surface of the fluoroaluminates to form the outer layer. They also suggested that intermetallic particles catalysed the pH increase by reducing the incubation pa-iod before the TCP coating growth. Qi et al. [12) measurements supported this last hypothesis. Indeed, using energy dispersive spectroscopy (EDS) analyses, the au thors detected zirconium after only 15 s of exposure to the TCP solution near a S phase particle and after 120s on the aluminium matrix.
E-mail address: christine.blanc@ensiacetfr (C . Blanc).
prepared with SEM FIB under the conditions described above. GD OES analyses were performed with a HORIBA Jobin Yvon GD Profiler 2 at the platform of micro characterisation Raimond Castaing (Toulouse, France). A copper anode of 4 mm diameter was used with an argon pressure of 630 Pa, a power of 30 W and radiofrequency of 13.56 MHz. A flush time of 120 s was operated before sampling. Samples were covered by a gold sputtered layer in order to prevent instability of the plasma initiation. The acquisition interval was set to 0.01 s. The emission lines used were: H 121.567 nm, O 130.217 nm, C 165.701 nm, Cu 324.754 nm, Zr 339.198 nm, Al 396.152 nm, Cr 425.433 nm and Au 242.795 nm. GD OES profiling was used to de termine in depth variations of the element concentration for the TCP coatings formed for different conversion times.
XPS profiles were performed with a ThermoFisher K alpha spec trometer at Aquitaine Platform of Material Characterisation (PLACA MAT, Bordeaux France). Base pressure wasfixed to 10−9mbar. Al Kα
monochromated radiation (1486.6 eV) was used as X ray source. Measured spot diameter wasfixed to 200 μm. Sputtering was performed with a Ionic Ar canon (500 eV) and a spot diameter of 500μm. These conditions give a sputtering of 0.3 nm.s−1on SiO2.
2.3. Electrochemical measurements
OCP measurements were performed in the TCP solution with a VSP 150 potentiostat (Bio Logic). A two electrode cell set up composed by a saturated calomel electrode (SCE) as reference electrode and the alu minium alloy substrate as working electrode was used.
Local pH measurements were performed during the TCP coating growth in the TCP solution by recording the electrical potential of a tungsten microelectrode (W microelectrode). The W microelectrode was prepared as described in Guo [24] and Li [23] previous works. A pH potential calibration curve was plotted in TCP solution allowing to correlate the potential of the W microelectrode to the pH around it. The W microelectrode potential was measured with a VSP 150 potentiostat (Bio Logic); before each measurement, it was allowed to stabilise during 5 min in a TCP solution placed in a beaker. For the local pH measurements, the W microelectrode was positioned by using an in termittent contact scanning electrochemical microscope IC SECM M470 (Bio Logic). The distance between the alloy surface and the W micro electrode was estimated around 100μm. When the W microelectrode and the degreased and desmutted sample were well positioned in the IC SECM set up, the TCP solution was added and the potential mea surement started. The pH measurement was performed in a TCP solu tion at room temperature (22 ± 1 °C).
Electrochemical Impedance Spectroscopy (EIS) measurements were performed in naturally aerated 0.5 M NaCl solution with a three elec trode cell (SCE reference electrode and graphitic rod as counter elec trode). Before each measurement, OCP was recorded for 1 h. Measurements were performed at OCP for different immersion times in the NaCl solution: 1 h, 3, 7, 14 days. For more clarity, only the results at 1 h and 14 days are shown in the paper. Frequency range was set to 6 104to 5 10−3Hz with a potential amplitude of 10 mV (rms). Z view
software (version 3.5d, Scribner Associates) was used to fit the ex perimental data.
All electrochemical measurements were performed in a laboratory room with controlled (22 ± 1 °C) temperature and repeated at least three times for reproducibility.
3. Results and discussion
3.1. Surface reactivity in the TCP solution
Variation of the OCP in TCP solution for the degreased and des mutted alloy is reported inFig. 1. The shape of the curve was similar to the OCP described in the literature [13,25 27]. An initial potential decrease was measured before a fast OCP increase followed by a To the authors’ knowledge, there is no direct evidence of this three
step mechanism. Therefore, to go further in the description of the TCP coating nucleation and growth mechanisms, the present work focusses on the evolution of the coating morphology and chemistry after dif ferent immersion times in the TCP solution, considering in particular very short immersion times to detect the very first stages of nucleation and growth. Scanning electron microscope (SEM) and transmission electron microscope (TEM) observations, X ray photoelectron spectro scopy (XPS) and Glow Discharge Optical Emission Spectroscopy (GD OES) analyses were performed to identify and characterise the TCP coatings formed after different immersion times. Then, electrochemical impedance spectroscopy (EIS) measurements were performed in order to evaluate the evolution of the corrosion properties of the samples in relation with the coating morphology.
2. Materials and methods 2.1. Material and sample preparation
Samples were removed from cold rolled sheets (1 mm thick) of aluminium alloy 2024 (AA 2024) thermally treated T3 and provided by Kaiser Aluminium. The chemical composition of the alloy (wt. %, Al balance) was: Cu 4.5, Mg 1.4, Mn 0.51, Fe 0.15, Si 0.08, Zn 0.13, Cr 0.01, Ti 0.02, V 0.01, Zr 0.01, others 0.05. The samples were 12 × 8 x 0.1 cm3 parallelepipeds with the TCP coating formed on the rolling
plane. Before the surface treatments, the sample surface was abraded using SiC papers down to P grade 2400 and then polished to a 1 μm diamond paste, in order to have a controlled surface. Then, the TCP coating was formed on the sample surface using a multi step process. Firstly, in order to remove inks and other surface pollutants, samples were rinsed with acetone prior to surface preparation, as done during the industrial process. Then, they were degreased in an alkaline bath (40 g·L−1 sodium tripolyphosphate, 40 g·L−1 borax and 5 mL·L−1 Turco
4215 additive, pH = 9) at 60 °C for 1200s. The next step corresponded to an immersion in a desmutting bath, i.e. a pH = 1 sulfo nitro ferric solution, at room temperature for 300 s in order to remove coarse in termetallic particles and native oxide. The TCP coating was then formed by immersion of the sample in a 32%v/v Socosurf TCS (Socomore,
France) solution at 40 °C for various duration times from 1 s to 600 s. The pH of the solution was set at 3.9 ± 0.1 with a sulfuric acid solu tion. Finally, the samples were dried with dried air stream. For each step, the solutions were prepared using industrial grade chemical re actants, and the samples were rinsed in deionised water following each step.
2.2. Morphological and chemical characterisations
The surface morphology of the TCP coatings was characterised by using a SEM equipped with a field emission gun (SEM FEG), JEOL JSM 7800 F Prime, operating at 5 kV in secondary electrons mode (platform of micro characterisation Raimond Castaing, Toulouse, France). The coating thickness was measured on cross sections prepared with a SEM
focused ion beam (SEM FIB) FEI HELIOS 600i equipped with a gallium Ionic Canon (platform of Micro characterisation Raimond Castaing, Toulouse, France). Gallium canon operated at 30 kV and 47 nA to 80 pA during cutting. Before cutting, samples were covered by an electro nically deposited carbon layer (0.5 μm in thickness, operating at 5 kV and 2.5 nA, precursor: naphthalene (C10H8)) and a 3 μm thick ionically
deposited platinum layer (operating at 30 kV and 0.43 nA, precursor: methylcyclopentadieny(trimethyl)platinum (C5H4CH3Pt(CH3)3)).
Because the contrast between TCP coating and carbon layer was low, a gold coating was sputtered by physical vapour deposition on top of the conversion coating to increase the contrast.
TEM observations combined with EDS analyses were performed with a JEOL JEM 2100 F (platform of micro characterisation Raimond Castaing, Toulouse, France) operating at 200 kV. TEM samples were
plateau. Such changes in OCP were attributed to changes in reactivity of the alloy surface. Indeed, in the literature, the OCP decrease was as sociated to the dissolution of the air formed oxide on the alloy surface and the OCP increase to a rapid growth of the conversion layer. The OCP plateau was correlated to a complete coverage of the alloy by the TCP coating. Andreatta et al. [25] suggested that further immersion in the conversion bath could lead to an increase of the thickness layer without OCP variation.
To go further in the explanation of the OCP curve and description of the nucleation and growth mechanisms of the TCP coating, the coating morphology, composition and anticorrosion properties were studied throughout the conversion coating formation. Cross marks plotted in Fig. 1indicate the samples that were further studied: samples immersed in the TCP solution for different duration times, i.e. between 1 600 s, were studied.
3.2. Local pH variations during TCP coating growth
Local pH variations measured near the AA 2024 surface during the conversion treatment in the TCP solution are plotted inFig. 2; the OCP variation is also reported for comparison. Immediately after immersion, a rapid increase of the pH was observed, from 3.86 to a maximum value of 4.5 reached after 30 s. Then, the pH decreased slowly to reach a value of 3.9 after 300 s in the TCP solution; it remained relatively stable around 3.9 4 during the following 300 s.
As discussed in the literature, the TCP coating growth is based on the precipitation of oxy hydroxide due to the pH increase [22,23]. Comparison of the OCP and pH curves showed that the minimum OCP and maximum pH values were not reached exactly at the same time. However, the position in time of the maximum pH was not very accu rate due to the fact that the W microelectrode was relatively far from the sample surface (around 100μm). Therefore, it was assumed that, as
indicated in the literature, the TCP coating growth was controlled by the pH. Moreover, after 300 s, the pH near the surface was similar to the bulk solution. Such a decrease of the pH gradient indicated a slowdown or a stop of the coating growth, as reported in the literature [22,28].
3.3. Evolution of the TCP coating morphology and thickness during the conversion treatment
3.3.1. Surface morphology of the TCP coating
SEM FEG micrographs of the sample surface before immersion in the TCP solution and for different immersion times in the TCP solution are reported inFig. 3. Firstly, after surface preparation, i.e. after de greasing and desmutting, alloy surface exhibited a typical scalloped morphology (Fig. 3a) [29]. Results also showed that the scalloped morphology of the as prepared substrate was maintained in thefirst period of the coating formation, i.e. after only 1 s of immersion in the TCP solution, but small nodules were observed on the ridges of the scallops (Fig. 3b). The nodules were assumed to correspond to thefirst evidence of the coating growth. After 3 s of immersion in the TCP so lution (Fig. 3c), the alloy surface was fully covered by the nodules but pores were observed. After 13 s (Fig. 3d), i.e. when the minimum OCP value was reached (Fig. 1), pores were not detected any more. Then, the coating surface morphology remained similar during the rest of the chemical conversion treatment (Fig. 3e to h) which was coherent with the literature [7,8,30]. However, observations showed that the nodule size was increasing as a function of the exposure time to the conversion solution. InFig. 4, average values of the nodule size are given for the different exposure times; they result from at least 30 measurements performed on 10 different zones of the sample, with 3 measurements per zone. This method was used to evaluate whether an influence of the grain orientation of the substrate on the nodule size could be detected but this was not shown. Fig. 4shows that the nodule diameter was around 30 nm from 1 to 45 s of immersion in the TCP solution. Therefore, during thefirst 45 s, no significant growth of the nodules was observed, but, during the OCP plateau (Fig. 1), the nodule diameter increased and reached 70 nm for 300 s of exposure which could indicate a modification of the growth mechanism. For a 600 s immersion, the nodule diameter could not be measured accurately.
3.3.2. Thickness of the TCP coating
SEM FEG micrographs of FIB cross sections prepared for the TCP coatings formed after different immersion times in the TCP solution are shown inFig. 5. After only 1 s of exposure to the TCP solution, it was difficult to observe the TCP coating because it corresponded only to small nodules on the ridges of the scallops (Fig. 3b), but the TCP coating was clearly observed for immersion times as short as 3 s. Moreover, independent on the immersion times (equal and/or higher than 3 s), the coating thickness was enough to lead to an apparent complete covering of the substrate roughness (which did not mean that pores were not observed).Fig. 4showed that the coating thickness strongly increased at the beginning of the TCP treatment (12 nm after 3 s, 42 nm after 45 s) and went on increasing even during the OCP plateau (Fig. 1) to reach 85 nm after 300 s of exposure to the TCP solution. Results also showed surprisingly that the TCP coating was less thick after 600 s of exposure to the TCP solution than after 300 s. Considering that the TCP coating thickness was calculated on the basis of ten measurements performed for three different samples in each case, it was assumed that the thin ning of the TCP coating for long immersion times in the TCP solution had to be considered. Moreover, after 600 s of exposure to the TCP solution, the TCP coating was about 60 nm thick, which was in ac cordance with the 50 100 nm thicknesses reported in the literature [7,8,13,31 33].
Fig. 1. OCP versus immersion time in the conversion solution (TCP solution = Socosurf TCS) for the pre-treated AA 2024-T3. Crosses indicate the
duration time of the TCP treatments for the different samples analysed in the
following.
Fig. 2. Local pH and OCP versus immersion time in the conversion solution (TCP solution = Socosurf TCS) for the pre-treated AA 2024-T3.
3.4. Evolution of the chemical composition of the TCP coating during the conversion treatment
3.4.1. Proof of the presence of the TCP coating on AA 2024 surface after very short immersion times in the TCP solution
A TEM micrograph of the TCP coating formed on AA 2024 T3 after a 3 s immersion in the TCP solution is reported inFig. 6including cor responding EDS mapping scans. InFig. 6, the different zones have been labelled, especially the platinum deposit; indeed, when platinum is present in very large content, its signal distorts that of zirconium as seen for the zirconium map at the bottom of the map. TEM micrograph seemed to show a single layer coating, unlike usual TCP coatings de scribed in the literature and characterised by a duplex structure [8]. The coating showed a non homogeneous thickness, between 8 and 15 nm, which was not inconsistent with previous SEM measurements, especially by considering that TEM observations were very local whereas the thickness measured by SEM was calculated on the basis of ten measurements done on different sites. EDS mapping scans showed that the chromium, zirconium and fluorine maps could be
Fig. 3. SEM-FEG micrographs of the AA 2024-T3 surface (a) before conversion and after different immersion times in the Socosurf TCS solution: (b) 1 s, (c) 3 s, (d)
13 s, (e) 15 s, (f) 45 s, (g) 300 s and (h) 600 s.
Fig. 4. Nodules diameter and TCP coating thickness (measured on micrographs
shown inFig. 5) versus immersion time in TCP solution (Socosurf TCS) for AA
superimposed which might confirm the single layer structure of the coating formed after 3 s of exposure to the TCP solution. Therefore, all the results suggested that the coating formed after very short immersion times in the TCP solution should have to be considered as a TCP pre cursor coating. Nevertheless, it remains possible that the TEM/EDS mapping resolution equal to a few nanometres does not allow to detect a more complex microstructure, and perhaps a two layer structure of the TCP coating formed for short exposure was missed. Furthermore, local variation in the thickness of TEM sample could disrupt nano scale microscopy observations.
3.4.2. Chemical composition profiles
GD OES elemental depth profiles plotted for AA 2024 samples im mersed in the TCP solution for different immersion times are shown in Fig. 7. No result was obtained for fluorine because GD OES analyses were performed under an argon pressure which does not allow to detect this element [33]. Copper signal was used to localise the position of the TCP coating/AA 2024 interface on the basis of the copper enrichment generated by surface preparation treatment as shown in previous work [34]; this interface is indicated by the vertical dash lines inFig. 7. It is of interest to note that the intensity of the copper peak linked to copper enrichment at the alloy surface was similar independently of the
Fig. 5. SEM-FEG micrographs (sec-ondary electron images) of cross-sec-tions of AA 2024-T3 samples after Focus Ion Beam cutting for treatment durations in the TCP solution equal to (a) 3 s, (b) 13 s, (c) 15 s, (d) 45 s, (e) 300 s and (f) 600 s. Vertical measure-ments of the coating thickness need to be corrected by cos(38) due to the tilt (52°) imposed by the ionic column.
immersion time in the TCP solution and was similar also to that ob served for the desmutted substrate (not shown here). This suggested a low influence of the TCP conversion on the copper enriched layer. Results showed that the TCP coating/alloy interface was reached after 0.4, 0.72, 1.06, 1.17, 1.9, 2.18 s of GD OES sputtering for samples ex posed to the TCP solution for 3, 13, 15, 45, 300 and 600 s, respectively, which could be related to an increase of the TCP coating thickness when the immersion time in the TCP solution increased. Moreover, for a 3 s immersion in the TCP solution (Fig. 7a), onlyfine peaks of chromium and zirconium were observed in agreement with the presence on the sample surface of afine TCP coating that was supposed to be a single layer coating on the basis of TEM observations (Fig. 6). Considering the GD OES sputtering area (around 4 mm), the small thickness and the nodular structure of the coating, associated with strong roughness, for this short duration time of exposure to the TCP conversion solution, it was difficult to conclude on the coating structure, i.e. single layer or two layer coating. On the contrary, when the immersion time in the TCP solution increased (Fig. 7b f), the width of the chromium and zirconium signals increased and two layers were distinguishable in the TCP coating for immersion times in the TCP solution longer than 13 s: an outer layer mainly composed of chromium and zirconium and an inner layer containing mainly aluminium. The literature also men tioned a two layer structure with oxide and hydroxide of chromium and zirconium in the upper part (i.e., outer layer) andfluoroaluminates in
the inner one (i.e., inner layer) [8,13]. Further, except for a 600 s long TCP treatment, concerning the outer layer, the results also showed that the chromium signal had a relatively constant intensity whereas the intensity of the zirconium signal increased with sputtering time which could indicate differential precipitation kinetics of those elements during the conversion treatment. After 600 s of immersion in the TCP solution, the intensity of the zirconium signal was more stable during sputtering which suggested that different mechanisms could occur be tween 300 and 600 s of immersion in the TCP solution. The evolution of the growth mechanisms could lead to a modification of the TCP coating structure, e.g. its compacity; those changes could be associated to dif ferent sputtering rates of the coating as suggested by Qi et al. [13]. These observations could explain why, with GD OES measurements, the TCP coating thickness seemed to increase even between 300 and 600 s, whereas SEM FEG observations (Fig. 5) showed a thinning of the TCP coating after 300 s of immersion in the TCP solution.
Because GD OES measurements are sensitive to the differential sputtering capabilities of the elements and do not allow to detect fluorine in the experimental conditions used (argon gas), XPS con centration profiles were plotted to complete the study (Fig. 8). Due to the carbon surface pollution (> 40%at), thefirst measuring point was
not considered (grey zone inFig. 8). After 3 s of immersion in the TCP solution (Fig. 8a), low concentrations of chromium and zirconium were detected (0.5 and 3%at. respectively) on the sample surface. A low
Fig. 7. GD-OES profiles plotted for TCP samples coated during (a) 3 s, (b) 13 s, (c) 15 s, (d) 45 s, (e) 300 s and (f) 600 s. Dash lines indicate the coating/aluminium substrate interface characterised by a copper enrichment layer.
content offluorine was also measured around 2%at. This corroborated
the previous results (TEM EDS mapping and GD OES analyses) that showed the presence of the TCP coating even after only a 3 s exposure to the TCP solution. After 13 s of immersion in the TCP solution (Fig. 8b), chromium, zirconium andfluorine concentrations increased on the sample surface; moreover, the maximum signals for the three elements were observed after similar sputtering times; this suggested a single layer structure for the coating, in agreement with the hypothesis proposed above. Moreover, the analysis of the XPS profiles for longer exposure to the TCP solution confirmed the validity of this hypothesis. Indeed, after 15 s (Fig. 8c), chromium and zirconium surface con centrations went on increasing. For thefluorine, the global concentra tion increased also but the concentration profiles clearly showed that the maximumfluorine concentration was observed inside the coating whereas the chromium and zirconium signals were maximal in the extreme surface. Further, after 45 s (Fig. 8d), chromium and zirconium surface concentrations reached values equal to 3%atand 22%at, re
spectively, i.e. similar values to those reported in the literature for TCP coatings [7,35]. For this immersion time in the TCP solution, the maximum chromium and zirconium concentrations were still measured at the extreme surface with concentrations decreasing inside the coating. By comparison toFig. 8c, the maximum signal for thefluorine
was even more shifted inside the coating. Therefore, the results showed that, for immersion times in the TCP solution equal to or higher than 15 s, a duplex structure was observed for the TCP coating and the chromium and zirconium rich outer layer was clearly defined. After 300 s of exposure to the TCP solution (Fig. 8e) and for a complete treatment (600 s,Fig. 8f), a plateau was observed for both chromium and zirconium signals during the first 100 150 s of sputtering. The concentrations on the plateau were equal to 4.5 and 23%atfor chro
mium and zirconium, respectively, similar to those measured at the extreme surface after 45 s of exposure to the TCP solution. Near the TCP coating/substrate interface, chromium and zirconium concentrations decreased significantly whereas the fluorine signal was maximum showing clearly the presence of thefluorine rich inner layer. Results also showed that thefluorine concentration in the inner layer increased as the immersion time increased between 300 and 600 s. This result indicated the permeability of the outer layer to thefluorine rich elec trolyte as observed by EIS in previous work [29].
To sum up, the results showed that, for very short immersion times in the TCP solution, only a TCP precursor layer could be observed. Indeed, TEM images associated with EDS mapping had suggested a single layer structure for short exposure to the TCP solution, which did not correspond to the two layer structure commonly observed for TCP
Fig. 8. XPS profiles plotted for TCP samples coated during (a) 3 s, (b) 13 s, (c) 15 s, (d) 45 s, (e) 300 s and (f) 600 s. The grey zones correspond to analyses performed in the carbon-polluted thickness of the coating.
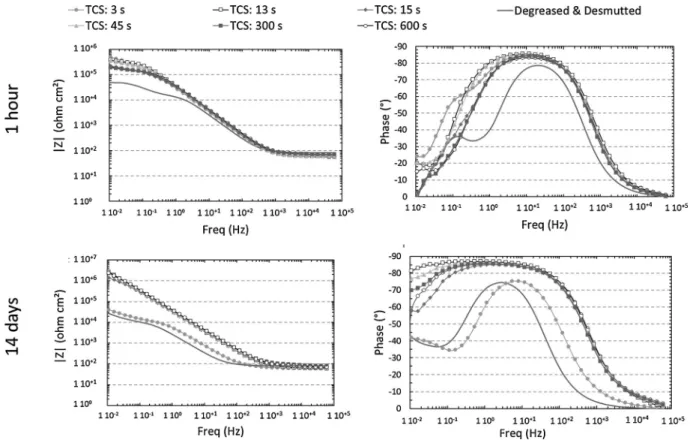
Fig. 9. EIS spectra plotted for TCP coated samples after 1 h and 14 days of immersion in 0.5 M NaCl.
coating. But, the possibility that this two layer structure had been missed could not be neglected. Then, the sample roughness associated to the low lateral resolution of GD OES and XPS could lead to some uncertainty on the conclusions. However, the methodology used for XPS analyses (with an accurate study of the evolution of the con centration profiles with increasing exposure to the TCP solution) led us to assume that, for short immersion time, the superimposition of the maximum signals for chromium, zirconium and fluorine was not an artefact and showed that the TCP coating had a single layer structure whereas it evolved towards a two layer structure during its growth leading to a gradual shift of the maximum signal of fluorine compared to chromium and zirconium signals. Indeed, when the immersion time increased, a duplex structure was observed progressively: the pre cipitation of chromium and zirconium oxide occurred leading to the formation of an outer layer permeable to fluoride ions, which thus al lowed the formation of the fluorine rich inner layer. Moreover, a sig nificant enlargement of the chromium and zirconium plateaus was observed between 300 and 600 s of exposure to the TCP solution sug gesting a thickening of the TCP coating as observed with GD OES analyses (Fig. 7). This observation was inconsistent with the FIB mea surements (Fig. 5) which indicated a thickness decrease between 300 and 600 s of exposure to the TCP solution. However, as previously in dicated, GD OES analyses suggested that chemical and/or morpholo gical changes of the TCP coating could explain significant variations in sputtering rate. As an example, a densification of the outer layer could generate significant sputtering rate variations.
3.5. Evolution of the anticorrosive properties of the TCP coating as a function of the immersion time in the TCP solution
EIS spectra of TCP coatings formed on AA 2024 T3 for different immersion times in the TCP solution are plotted in Fig. 9. After 1 h of exposure to the 0.5 M NaCl solution, all the coated samples exhibited higher impedance modulus at 10−2 Hz than the degreased and des
mutted sample. Moreover, the EIS spectra for the degreased desmutted
sample showed two well defined time constants, the one at 10−1 Hz
being related to the oxygen diffusion on the sample surface. For the 3 s coated sample, the two time constants were not clearly seen but a shoulder on the phase was noticeable. For all others samples, only one time constant, with high phase angles on a large frequency domain, was distinguished. As shown in a previous paper [29], high impedance modulus and a large frequency range of high phase angles could be related to improved anticorrosion properties for the TCP coating [11,13,29,36]. After 14 days of immersion in NaCl, an enlargement of the frequency domain were high phase angles were observed and an increase by one or two orders of magnitude of the impedance modulus at 10−2 Hz were noticeable for all samples except for the degreased
desmutted and 3 s TCP coated samples that showed similar EIS spectra. The 600 s TCP coated sample showed the largest frequency domain with high phase angles which suggested that this coating had the highest anticorrosive properties after 14 days of immersion in NaCl. On the basis of these results, the EIS spectra plotted for the degreased desmutted (1 h and 14 days) and 3 s TCP coated (14 days) samples were analysed with the same equivalent circuit (Fig. 10a). It comprised a parallel combination of the charge transfer resistance Rct and a constant
phase element Qdl associated with another combination including the
resistance linked to the oxygen reduction RdifO2 and a constant phase
element QdifO2. In accordance with Qi et al. [13] and previous work
[29], another equivalent circuit was used (Fig. 10b) to analyse the EIS spectra plotted for the other coated samples after 1 h and 14 days in NaCl solution (and for the 3 s coated sample after 1 h in 0.5 M NaCl). For this circuit, the second parallel combination was replaced by a coating resistance Rcoat and a constant phase element Qcoat. EIS para
meters extracted from spectra plotted after 1 h and 14 days of immer sion in NaCl are reported in Tables 1 and 2, respectively.
At the beginning of the immersion in NaCl solution (1 h immersion), Rcoat values were similar for all TCP coated samples, even for the short
exposure duration time to the TCP solution (3 s). For all samples, Rcoat
values were in the same order of magnitude than the electrolyte re sistance (Re) which indicated a permeability of the coating allowing
access of the electrolyte to the alloy as shown by Dong et al. [21]. Further, for all TCP coated samples, Rctvalues increased by one order of
magnitude by comparison to the degreased desmutted sample which demonstrated a significant improvement of the corrosion behaviour of the TCP coated samples even for short duration times in the TCP so lutions. Concerning the CPE coating parameters, low αcoatand high
Qcoatare associated to strong heterogeneity of the conversion coating
[13,15,34]. The results showed no significant differences of those parameters as a function of the immersion time in the TCP solution which indicated a good homogeneity of all the TCP coatings. The result was consistent with the SEM micrographs (Fig. 3) for the samples ex posed to the TCP solution for duration times equal or higher than 13 s, i.e. after a full surface covering. It was more surprising for the 3 s coated sample for which numerous pores were observed on the surface of the coated sample (Fig. 3c). Besides, the evolution of the EIS spectrum after 14 days of immersion in NaCl solution for this sample was quite con sistent with the SEM (Fig. 3c) and TEM (Fig. 6) observations. Indeed, after a long time of exposure to the NaCl solution, the 3 s coated sample behave similarly to the degreased desmutted sample and similar Rct
values were measured for both samples, which corresponded to a de crease of this parameter for the 3 s coated sample when the immersion time in the NaCl solution increased. This could be explained as a de crease of the corrosion resistance for the 3 s TCP coated sample that could be related to the porous surface morphology observed inFig. 3c. The pores represented preferential ways towards the aluminium surface for chloride ions and oxygen and led to a similar corrosion behaviour as for the degreased desmutted sample. More globally, the results could led us to assume that the single layer structure of the 3 s TCP coating, considered as a precursor of the TCP coating, was not an optimised structure for anticorrosion properties. On the contrary, the other sam ples showed a significant increase in Rctvalues between 1 h and 14 days
of immersion in NaCl solution whereas Rcoat, Qcoatandαcoat values
remained similar. As shown in previous paper [29], the results showed that the anticorrosive properties of the TCP coating were mainly related to the inner layer; moreover, the improvement of the anticorrosion properties of those TCP coatings when the immersion time in NaCl increased could be explained by a self healing mechanism linked to the hydration of the TCP coating [29]. Nevertheless, the main result was that substantial anticorrosive properties were associated to a duplex structure of the TCP coating.
Finally, EIS measurements showed that the TCP coatings exhibited anticorrosive properties even for short immersion times in the TCP solution but the stability of the TCP coating in aggressive solution was
only obtained for long conversion durations, when the TCP coating showed a duplex structure. However, the effect of the conversion duration on anticorrosive properties for exposure to the TCP solution longer than 13 s, was not clearly detected with the EIS experiments performed here, even though the anticorrosive properties of the 600 s coated samples seemed to be the highest.
3.6. Nucleation and growth mechanism
From the results presented above, a nucleation and growth me chanism for TCP coating can be proposed. Three steps, each one being associated to one of the three zones distinguished on the OCP curves plotted during the TCP treatment, can be defined: the first step is re lated to the initial potential decrease, the second one to the rapid po tential increase and the third corresponds to the processes occurring when the OCP is stabilised at the end of the TCP treatment.
3.6.1. Step 1: Initial potential decrease (0 13 s)
After surface preparation, the alloy surface is characterised by a scalloped surface with ridges composed of copper and other non dis solved impurities and troughs [29,37,38]. During step 1, the native oxide dissolves due to the activation of substrate surface by thefluoride ions (Eq. 1) in agreement with the mechanism proposed in the literature [7,22,39 41]. The role offluorine is to undermine the air formed film to provide the appreciable electron tunnelling for the solution/alumi nium reactions. Therefore, competition between aluminium dissolution and precipitation reactions takes place as described by the following equations (Eqs.1, 2and 3) leading, in particular, to the formation of fluoroaluminates (Eqs.1and 3):
Al2O3+ 2xF−+ 6H+→ 2AlFx(3 x)+ 3H2O (1) + → ++ −+ Al H O Al OH H 2 ( )s 6 2 2 3 6 3 2 (2) + → + − Al3 3F AlF3( )s (3)
As a consequence, a pH gradient takes place near the alloy surface, as described in the literature and measured here by using a local pH probe (Fig. 2). The local pH increase, due to protons consumption, al lows the precipitation of zirconium and chromium oxides and hydro xides, in agreement with the large amount of oxygen measured with the different techniques used (Eqs.4and 5]:
+ → +
− − −
ZrF62 4OH ZrO2.2H O2 6F (4)
Fig. 10. Equivalent circuit used tofit the EIS
spectra plotted for (a) degreased-desmutted and 3 s TCP (14 days) coated samples, (b) all other TCP coated samples.
Table 1
Parameters extracted from EIS spectra by using equivalent circuits shown inFig. 10for TCP coated samples after different immersion times in the TCP solution. The
EIS spectra were plotted after 1 h in 0.5 M NaCl. Results obtained for the degreased and desmutted sample (Deg-des.) are also given for comparison.
Parameter Deg-Des. 3 s 13 s 15 s 45 s 300 s 600 s Re(Ω cm2) 83 62 57 59 60 72 70 Rct(Ω cm2) 1.8 104 6.1 105 3.4 105 1.4 105 2.8 105 1.6 105 1.6 105 Qdl(sα/(Ω cm2)) 7.4 10 6 3.1 10 6 1.3 10 6 7.9 10 7 7.4 10 7 2.2 10 6 3.0 10 6 αdl 0.96 0.55 0.97 0.98 1.00 0.83 0.91 Rcoat(Ω cm2) 110 50 60 80.4 154 28 Qcoat(sα/(Ω cm2)) 4.7 10 6 2.3 10 6 4.6 10 6 4.2 10 6 2.9 10 6 1.7 10 6 αcoat 0.98 0.96 0.94 0.95 1.00 1.00 Rdif O2(Ω cm2) 3.2 104 Qdif O2(sα/(Ω cm2)) 6.8 10 5 αdif O2 1
+ →
+ −
Cr3 3OH Cr OH( )
3 (5)
All those reactions lead to the formation of small nodules,first on the ridges of the scalloped surface, that constitute preferential and re active sites on which reactions are promoted. When these sites are fully covered, the precipitation occurs on the whole sample surface. Thisfirst step ends with a complete surface covering by a precursor coating containing small quantities offluorine, chromium and zirconium. At the end of this step, the precursor coating is formed; it corresponds to a single layer coating that exhibits anticorrosive properties as measured by EIS in NaCl solution (Fig. 9), but a rapid degradation of the coated sample is observed when the exposure to the NaCl solution is extended. A schematic diagram of thefirst step is given inFig. 11.
3.6.2. Step 2: Rapid increase of the potential (15 s 45 s)
At the end of thefirst step, the native oxide is dissolved and the aluminium surface is almost completely covered by the precursor coating. Therefore, it can be assumed that the amount of aluminium ions near the sample surface decreases so that the formation offluor oaluminates is not promoted on the surface. Because the dissolution of aluminium is slowed down, the pH gradient decreases but it still exists as shown by Fig. 2. Therefore, chromium and zirconium oxide pre cipitation reactions go on and correspond then to the major reactions, leading to the enrichment in chromium and zirconium at the surface: these processes correspond to the outer layer nucleation (schematic diagram in Fig. 12). Because the intensity of the pH gradient has
decreased, the growth kinetics of the coating is slowed down as shown inFig. 4. In parallel, the chemical composition of the precursor coating previously formed evolves gradually and this coating becomes enriched influorine due to the permeation of this element through the chromium and zirconium rich outer layer in formation. Therefore, the precursor coating gradually evolves and its composition tends to be similar to that of the inner layer commonly observed for TCP coating. At the end of this step, the sample surface is covered by a coating composed of two layers with improved anticorrosion properties. Between 15 and 45 s, due to the evolution of the TCP coating from a precursor to a two layer coating, a gradual increase of the anticorrosion properties of the coating was observed leading to a gradual increase in the OCP measured in the TCP solution.
3.6.3. Step 3: Stabilisation of the potential (after 45 s of immersion in the TCP solution)
The second step corresponds to the nucleation of the outer layer and the transition of the precursor coating to the inner layer. During the last step (Fig. 13), the pH gradient goes on to decrease slowly to reach gradually the bulk solution pH so that the growing rate of the coating still decreases. However, the precipitation of chromium and zirconium goes on slowly leading to the growth of the outer layer. In parallel, the fluorine goes on diffusing through the outer layer leading to the growth of the inner layer. In agreement with literature [13,29], the EIS results showed that the TCP coating presented a permeability to an electrolyte through pores and defects. All these reactions are assumed to maintain
Table 2
Parameters extracted from EIS spectra by using equivalent circuits shown inFig. 10for TCP coated samples after different immersion times in the TCP solution. The
EIS spectra were plotted after 14 days in 0.5 M NaCl. Results obtained for the degreased and desmutted sample (Deg-des.) are also given for comparison.
Parameter Deg-des. 3 s 13 s 15 s 45 s 300 s 600 s Re(Ω cm2) 81 60 61 63 67 77 77 Rct(Ω cm2) 1.3 104 1.4 104 3.1 107 2.3 106 2.2 107 1.2 107 1.0 107 Qdl(sα/(Ω cm2)) 6.6 10 5 3.0 10 5 2.3 10 6 3.3 10 6 3.0 10 6 2.3 10 6 2.6 10 6 αdl 0.92 0.87 0.96 0.93 0.94 0.96 0.94 Rcoat(Ω cm2) 88 58 57 61 47 Qcoat(sα/(Ω cm2)) 2.7 10 7 2.4 10 6 2.1 10 6 1.9 10 6 2.6 10 6 αcoat 0.97 0.95 0.96 0.96 0.95 Rdif O2(Ω cm2) 6.5 104 6.5 104 Qdif O2(sα/(Ω cm2)) 4.3 10 4 2.4 10 4 αdif O2 0.87 0.9
a pH gradient at the sample surface, which is very low but sufficient to allow the TCP coating to go on growing. After 300 s, the coating thickness is found to decrease. The characterisations performed in this work are not sufficient to explain this evolution, but different hy potheses can however be proposed. The near surface pH being similar to the bulk pH after 300 s, it could lead to the dissolution of the coating; an unidentified densification mechanism of the coating could also occur. Nevertheless, at the end of step 3, the duplex TCP coating is formed and shows long lasting anticorrosive properties.
4. Conclusions
The main conclusions of this work are given in the following: 1) A precursor layer of TCP coating was formed immediately after
immersion in the TCP solution. This precursor layer exhibited a single layer structure and was composed of chromium, zirconium, fluorine and aluminium. It was considered as a precursor coating of thefinal duplex structure.
2) For immersion times in the TCP solution longer than 13 s (minimum potential on the OCP curve), the coating exhibited the duplex structure commonly observed and composed by an aluminium and fluorine rich inner layer, and a zirconium and chromium rich outer layer. When the exposure to the TCP solution was extended, i.e. until 600 s, the chemical composition of both the outer and inner layers evolved.
3) The TCP coating exhibited anticorrosive properties (measured by EIS) even for immersion time in the TCP solution as short as 3 s which meant that even the precursor layer exhibited anticorrosive properties. However, during immersion in a NaCl solution, the de gradation of the precursor layer occurred rapidly whereas the TCP coating with the duplex structure showed significant anticorrosive properties even after 14 days of immersion in a NaCl solution. The best anticorrosive properties were obtained after 600 s of exposure to the TCP solution which showed that the chemical and structural
changes that had occurred between 13 and 600 s were of major interest for the anticorrosive properties of the TCP coating. 4) A nucleation and growth mechanism of TCP coating was proposed
on the basis of the electrochemical, chemical and morphological characterisations performed. It could be described as a three step process; thefirst step corresponded to the dissolution of the native oxide and the formation of the precursor layer, the second one to the nucleation of the outer layer combined with an enrichment in fluorine of the precursor layer to reach the composition commonly measured for the inner layer. Finally, the third step corresponded to the growth of both the outer and inner layers of the TCP coating. The results therefore showed that, with the conditions applied for the TCP coating nucleation and growth, a duration time of 600 s was requested to obtain substantial anticorrosive properties. This corre sponded to a specific chemical composition and structure of the TCP coating. From an industrial point of view, it could be interesting tofind a way to accelerate the chemical reactions leading to this optimised composition and structure of the TCP coating in order to reduce the process duration.
Data availability
The raw/processed data required to reproduce thesefindings cannot be shared at this time as the data also forms part of an ongoing study.
Acknowledgments
The authors thank Mecaprotec and the ANRT for their financial support. The technical support of the team of the micro caracterisation platform Raimond Castaing and PLACAMAT was also greatly appre ciated. Thanks to R. SAILLARD (CIRIMAT) for fruitful discussion.
Fig. 12. Schematic describing the formation of the TCP coating during the rapid potential increase (step 2).
References
[1] A.S.M. International, A.I.H. Committee, A.I.A.P.D. Committee, Properties and Selection, ASM International, 1990.
[2] T. Muster, A.E. Hughes, G.E. Thompson, Copper Distribution in Al Alloys, Nova Science Publishers, 2007.
[3] A.E. Hughes, G.E. Thompson, J.M. Mol, N. Birbilis, S.J. Garcia, X. Zhou, High Strength Al-alloys: Microstructure, Corrosion and Principles of Protection, INTECH Open Access Publisher, 2011.
[4] European Chemical Agency, REACh Annex XIV, (2013).
[5] C. Matzdorf, M. Kane, J. Green, Corrosion Resistant Coatings for Aluminum and Aluminum Alloys, US6375726B1, (2002) (Accessed 26 December 2018),https:// patents.google.com/patent/US6375726/it.
[6] P. Bares, C. Stephan, C. Gazeau, Method for the Surface Treatment of Parts Made of an Aluminum or Magnesium Alloy, WO2013117767A1, (2013) (Accessed 26 December 2018),https://patents.google.com/patent/WO2013117767A1/en. [7] L. Li, G.P. Swain, A. Howell, D. Woodbury, G.M. Swain, The formation, structure,
electrochemical properties and stability of trivalent chrome process (TCP) coatings on AA2024, J. Electrochem. Soc. 158 (2011) C274–C283.
[8] Y. Guo, G.S. Frankel, Characterization of trivalent chromium process coating on AA2024-T3, Surf. Coat. Technol. 206 (2012) 3895–3902.
[9] Y. Guo, G.S. Frankel, Active corrosion inhibition of AA2024-T3 by trivalent chrome process treatment, Corros. J. Sci. Eng. 68 (2012) 045002–1.
[10] C. Cai, X.-Q. Liu, X. Tan, G.-D. Li, H. Wang, J.-M. Li, J.-F. Li, A Zr- and Cr(III)-containing conversion coating on Al alloy 2024-T3 and its self-repairing behavior, Mater. Corros. 68 (2017) 338–346.
[11] J. Qi, L. Gao, Y. Li, Z. Wang, G.E. Thompson, P. Skeldon, An optimized trivalent chromium conversion coating process for AA2024-T351 alloy, J. Electrochem. Soc. 164 (2017) C390–C395.
[12] J. Qi, T. Hashimoto, J. Walton, X. Zhou, P. Skeldon, G.E. Thompson, Formation of a trivalent chromium conversion coating on AA2024-T351 alloy, J. Electrochem. Soc. 163 (2016) C25–C35.
[13] J.-T. Qi, T. Hashimoto, J.R. Walton, X. Zhou, P. Skeldon, G.E. Thompson, Trivalent chromium conversion coating formation on aluminium, Surf. Coat. Technol. 280 (2015) 317–329.
[14] L. Li, A.L. Desouza, G.M. Swain, Effect of deoxidation pretreatment on the corrosion inhibition provided by a trivalent chromium process (TCP) conversion coating on AA2024-T3, J. Electrochem. Soc. 161 (2014) C246–C253.
[15] L. Li, K.P. Doran, G.M. Swain, Electrochemical characterization of trivalent chro-mium process (TCP) coatings on aluminum alloys 6061 and 7075, J. Electrochem. Soc. 160 (2013) C396–C401.
[16] B.W. Whitman, L. Li, G.M. Swain, Anti-corrosion properties of a TCP pretreatment conversion coating on aluminum alloy 2024-T3 during moist SO2atmospheric
testing: effects of galvanic coupling, J. Electrochem. Soc. 164 (2017) C135–C147. [17] A. Iyer, W. Willis, S. Frueh, W. Nickerson, A. Fowler, J. Barnes, L. Hagos,
J. Escarsega, J. La Scala, S.L. Suib, Characterization of NAVAIR trivalent chromium process (TCP) coatings and solutions, Plat. Surf. Finish. 94 (2007) 14–18. [18] L.L. Song, J.F. Li, C. Cai, Corrosion resistance and self-repairing behaviour of Cr(III)
contained conversion coating on AA2024-T3, Corros. Eng. Sci. Technol. 51 (2016) 263–271.
[19] K. Thirupathi, P. Bárczy, B.M. Somosvári, Impact of corrosive liquid on trivalent chromium over aluminium alloys, J. Surf. Eng. Mater. Adv. Technol. 07 (2017) 51–60.
[20] C.A. Munson, G.M. Swain, Structure and chemical composition of different variants of a commercial trivalent chromium process (TCP) coating on aluminum alloy 7075-T6, Surf. Coat. Technol. 315 (2017) 150–162.
[21] X. Dong, S. Argekar, P. Wang, D.W. Schaefer, In situ evolution of trivalent chro-mium process passivefilm on Al in a corrosive aqueous environment, ACS Appl. Mater. Interfaces. 3 (2011) 4206–4214.
[22] S. Dardona, M. Jaworowski, In situ spectroscopic ellipsometry studies of trivalent chromium coating on aluminum, Appl. Phys. Lett. 97 (2010) 181908.
[23] L. Li, A.L. Desouza, G.M. Swain, In situ pH measurement during the formation of conversion coatings on an aluminum alloy (AA2024), Analyst 138 (2013) 4398–4402.
[24] Q. Guo, X. Wu, E.-H. Han, W. Ke, pH response behaviors and mechanisms of dif-ferent tungsten/tungsten oxide electrodes for long-term monitoring, J. Electroanal. Chem. 782 (2016) 91–97.
[25] F. Andreatta, A. Turco, I. de Graeve, H. Terryn, J.H.W. de Wit, L. Fedrizzi, SKPFM and SEM study of the deposition mechanism of Zr/Ti based pre-treatment on AA6016 aluminum alloy, Surf. Coat. Technol. 201 (2007) 7668–7685.
[26] J. Qi, A. Němcová, J.R. Walton, X. Zhou, P. Skeldon, G.E. Thompson, Influence of pre- and post-treatments on formation of a trivalent chromium conversion coating on AA2024 alloy, Thin Solid Films 616 (2016) 270–278.
[27] J. Cerezo, I. Vandendael, R. Posner, K. Lill, J.H.W. de Wit, J.M.C. Mol, H. Terryn, Initiation and growth of modified Zr-based conversion coatings on multi-metal surfaces, Surf. Coat. Technol. 236 (2013) 284–289.
[28] X. Dong, P. Wang, S. Argekar, D.W. Schaefer, Structure and composition of trivalent chromium process (TCP)films on Al alloy, Langmuir. 26 (2010) 10833–10841. [29] X. Verdalet-Guardiola, J.-P. Bonino, S. Duluard, B. Fori, C. Blanc, Influence of the
alloy microstructure and surface state on the protective properties of trivalent chromium coatings grown on a 2024 aluminium alloy, Surf. Coat. Technol. 344 (2018) 276–287.
[30] C.M. Rangel, T.I. Paiva, P.P. da Luz, Conversion coating growth on 2024-T3 Al alloy. The effect of pre-treatments, Surf. Coat. Technol. 202 (2008) 3396–3402. [31] L. Li, G.M. Swain, Effects of aging temperature and time on the corrosion protection
provided by trivalent chromium process coatings on AA2024-T3, ACS Appl. Mater. Interfaces 5 (2013) 7923–7930.
[32] W.-K. Chen, J.-L. Lee, C.-Y. Bai, K.-H. Hou, M.-D. Ger, Growth and characteristics of Cr(III)-based conversion coating on aluminum alloy, J. Taiwan Inst. Chem. Eng. 43 (2012) 989–995.
[33] K. Wagatsuma, K. Hirokawa, N. Yamashita, Detection offluorine emission lines from Grimm-type glow-discharge plasmas— use of neon as the plasma gas, Anal. Chim. Acta 324 (1996) 147–154.
[34] J. Qi, G.E. Thompson, Comparative studies of thinfilm growth on aluminium by AFM, TEM and GDOES characterization, Appl. Surf. Sci. 377 (2016) 109–120,
https://doi.org/10.1016/j.apsusc.2016.03.115.
[35] T. Schram, G. Goeminne, H. Terryn, W. Vanhoolst, P.V. Espen, Study of the com-position of zirconium based chromium free conversion layers on aluminium, Trans. IMF. 73 (1995) 91–95.
[36] C.A. Matzdorf, W.C. Nickerson, E. Lipnickas, Evaluation of modified zirconium/ trivalent chromium conversion coatings by accelerated corrosion and electro-chemical techniques, Tri-Serv. Corros. Conf., NACE International (2005) 1–22. [37] C.E. Caicedo‐Martinez, E.V. Koroleva, G.E. Thompson, P. Skeldon, K. Shimizu,
H. Habazaki, G. Hoellrigl, Surface nanotextures on aluminium, Surf. Interface Anal. 34 (2002) 405–408.
[38] C.E. Caicedo-Martinez, E. Koroleva, P. Skeldon, G.E. Thompson, G. Hoellrigl, P. Bailey, T.C.Q. Noakes, H. Habazaki, K. Shimizu, Behavior of impurity and minor alloying elements during surface treatments of aluminum, J. Electrochem. Soc. 149 (2002) B139–B145.
[39] K. Shimizu, G.M. Brown, K. Kobayashi, G.E. Thompson, G.C. Wood, The role of electron tunnelling in the development of chemical conversion coatings on high purity aluminium, Corros. Sci. 34 (1993) 1853–1857.
[40] M.F. Abdrabbo, J.A. Richardson, G.C. Wood, Study of conversion coating devel-opment on aluminium in chromate-fluoride solutions using secondary ion mass-spectrometry, Corros. Sci. 18 (1978) 117–123.
[41] D. Chidambaram, C.R. Clayton, G.P. Halada, The role of hexafluorozirconate in the formation of chromate conversion coatings on aluminum alloys, Electrochim. Acta 51 (2006) 2862–2871.