Assessing the viability of enabling a round-trip carsharing system
to accept one-way trips: Application to Logan Airport in Boston
The MIT Faculty has made this article openly available.
Please share
how this access benefits you. Your story matters.
Citation
Jorge, Diana et al. “Assessing the Viability of Enabling a
Round-Trip Carsharing System to Accept One-Way Round-Trips: Application to
Logan Airport in Boston.” Transportation Research Part C: Emerging
Technologies 56 (July 2015): 359–372 © 2015 Elsevier Ltd
As Published
http://dx.doi.org/10.1016/j.trc.2015.04.020
Publisher
Elsevier
Version
Author's final manuscript
Citable link
http://hdl.handle.net/1721.1/116587
Terms of Use
Creative Commons Attribution-NonCommercial-NoDerivs License
Assessing the viability of enabling a round-trip
carsharing system to accept one-way trips:
application to Logan Airport in Boston
Diana Jorge, Corresponding Author Department of Civil Engineering University of Coimbra
Rua Luís Reis – Pólo II 3030-788 Coimbra Portugal
Email: diana.jorge@student.dec.uc.pt Tel.: (+351) 239 797 159;
Cynthia Barnhart
Department of Civil and Environmental Engineering, Massachusetts Institute of Technology
77 Massachusetts Avenue Cambridge, MA, 02139 USA Email: cbarnhar@mit.edu Tel.: (+1) 617 253 3815
Gonçalo Homem de Almeida Correia Department of Transport and Planning Delft University of Technology P.O. Box 5048 - 2600 GA Delft The Netherlands
Email: G.Correia@tudelft.nl Tel.:+31(15) 27 81384
ABSTRACT
Although one-way carsharing is suitable for more trip purposes than round-trip carsharing, many companies in the world operate only in the round-trip market. In this paper, we develop a method that optimizes the design of a one-way carsharing service between selected origin-destination pairs of an existing round-trip carsharing system. The goal is to supplement the established round-trip services with new one-way services and increase profitability. We develop an integer programming model to select the set of new one-way services and apply it to the case study of Boston, USA, considering only trips with one endpoint at a station in the round-trip Zipcar service network and the other endpoint at Logan Airport. The airport was chosen as a necessary endpoint for a one-way service because it is a very significant trip generator for which the round-trip carsharing is not suitable. Results show that these supplemental one-way services could be profitable. Enabling relocation operations between the existing round-trip stations and the Airport greatly improves the demand effectively satisfied, leads to an acceptable airport station size (in terms of the number of parking spots required), and is profitable; however, these benefits come with the need to manage relocation operations.
1. Introduction
Two main urban transportation modes have been used in the past few decades: private vehicle and public transportation. When the use of private vehicles started to become common, greater accessibility and flexibility in industrialized countries was achieved; however, several externalities resulted, including loss of time, pollution, congestion, and unrecoverable costs associated with the vehicle itself (Mitchell et al., 2010). Traditional public transportation modes like bus and rail may help solve these issues. However, public transportation has drawbacks, such as poor service coverage, schedule inflexibility and lack of personalization due to high investment costs.
Therefore, there is the need to find alternatives that are both sustainable and also guarantee that people have transport that enables them to carry out their activities. One of those alternatives is carsharing services. Carsharing systems involve a small to medium fleet of vehicles available at several stations to be used by a relatively large group of members (Shaheen et al., 1999). It appeared in 1948, in Europe, with a cooperative known as Sefage, which initiated services in Zurich, Switzerland. Later, in the 1980s, it came to the US within the Mobility Enterprise program (Shaheen et al., 1999). Currently, one of the world’s largest carsharing companies is Zipcar, which was founded in January 2000. It has more than 850,000 members and about 10,000 vehicles spread across the USA, Canada, UK, Spain, and Austria (Zipcar(a), 2014). In March 2014, Zipcar started to offer one-way trips in Boston, USA (ZipcarOneWay, 2014).
Some studies (Litman, 2000; Schuster et al., 2005) have shown that carsharing has a positive impact on urban mobility, through a more efficient use of automobiles, mainly by reducing the time that each car is waiting to be used. The use of carsharing systems has also quite often allowed car ownership rates to decline (Schure et al., 2012; Klincevicius et al., 2014) and thus lowered car usage (Celsor and Millard-Ball, 2007; Martin and Shaheen, 2011; Sioui et al., 2013). Furthermore, some recent studies concluded that carsharing systems should have positive environmental effects by allowing the reduction of greenhouse gas emissions (Martin and Shaheen, 2011, Firnkorn and Müller, 2011).
Considering the operating model, carsharing systems can be classified into: round-trip systems, in which users have to return a car to the station where it was picked up; and one-way systems, in which users may pick up a car from one station and return it to another (Shaheen et al., 2006). Recently, a particular case of one-way carsharing appeared in which the vehicles are scattered around parking spots within a city, the so-called free-floating carsharing (Ciari et al., 2014; Schmoller et al., 2014). From the user perspective, round-trip services may not be attractive if a round-trip requires spending a long time parked at a location other than the vehicle’s home location. Hence, this type of carsharing is mostly used for short trips when vehicles are parked for a short duration (Balac and Ciari, 2014; Barth and Shaheen, 2002; Costain et al., 2012), typically for leisure, shopping and sporadic trips; whereas one-way carsharing can be used for all other trip purposes, even commuting (Balac and Ciari, 2014; Ciari et al., 2014). Therefore, one-way carsharing systems are suitable for more trip purposes than round-trip services. Schmoller et al. (Schmoller et al., 2014) concluded
this through a study on two German cities, Munich and Berlin. In the one-way systems that are implemented in these cities, the highest number of bookings occurs on Fridays and Saturdays, which indicates that the system is used for shopping and social-recreational activities. However, during the week, peaks of demand correspond to the typical rush hours, that is, commuter traffic. This was also concluded by (Balac and Ciari, 2014), who found that peaks of demand for one-way carsharing occur in the morning rush hour, around noon, and in the afternoon rush hour, while for round-trip carsharing peaks of demand happen outside rush hours. Balac and Ciari (Balac and Ciari, 2014) did, however, conclude that the introduction of one-way carsharing does not cause a significant decline in round-trip carsharing demand, showing that the services are complementary.
Despite being an advantage for users, one-way carsharing operators often face the complexity of managing fleet imbalances since incoming and outgoing trips are rarely balanced at each station at any given time and clients may not find vehicles or parking spots available when they need them. Moreover, one-way carsharing may compete with public transportation, walking and cycling as well as with the car, as concluded by Ciari et al. (2014); this might be less beneficial than round-trip carsharing in terms of transportation sustainability. Balac and Ciari (2014) showed that car and walking are the modes more likely to be replaced by one-way carsharing. With respect to the car, this replacement is good and more sustainable. But the replacement of walking is harmful because it might lead to more car usage.
We can therefore conclude that a combination of round-trip and one-way carsharing could be better for the operator and the clients, considering that the decision to offer one-way trips is limited to special services, at least for a transition period. A carsharing system that operates as a one-way system can easily be used for round-trips; however, the opposite is rarely possible because the daily management of the system would have to be changed. The hypothesis discussed in this paper is that one-way carsharing services can sometimes be beneficial for both the users, who do not need to pay for the time the vehicle is parked, and the operator, which will be able to expand its market. When carsharing is operated only as a round-trip service, clients will choose other transportation modes for long-stay durations at the destination. One such mode is the taxi, which has door-to-door capability and only charges for the effective distance of the trip. Therefore, allowing a one-way service for some trips could be particularly interesting in cities where carsharing prices are significantly lower than the cost of a taxi or a private vehicle (if parking charges are included). Alfian et al. (2014) studied this possibility using a simulation tool to test several types of carsharing services, specifically those that offer both round-trip and one-way. They concluded that those services need to be cheaper than the taxi price for intermediate length trips. The goal of our work is to develop a methodology for testing if a round-trip carsharing system can provide a one-way service for very specific OD pairs, for which the round-trip service is usually not appropriate because it involves vehicles being parked for a long time. Despite the introduction of this new one-way service, round-trip service is the
core business of the company. We consider the introduction of this service to be a strategic planning level problem.
A mathematical programming model is proposed that maximizes the expected daily profit from accepting or rejecting one-way trips between a specific high demand generator site in a city and the existing round-trip stations.
We think that for these types of trips, it is easy for users to find alternative
transportation modes if way carsharing is not available when needed. The availability of
one-way carsharing service, however, does provide users with a less expensive option when compared
to using a private vehicle or taxi.
The model is applied to the case study of trips between the round-trip carsharing stations in Boston’s
Zipcar network and Logan International Airport. It is relevant to note that Boston is a city where carsharing
costs significantly less than other transportation modes, such as private cars and taxis, especially for longer trips.
Therefore, the main contributions of this paper are:
assessing the possibility of combining both round-trip and one-way carsharing services in a network that was created originally for a round-trip service;
developing an integer programming model that provides such assessment by selecting trips for a specific high demand generator site to help maximize the daily profit of the company;
applying the model to a case study, the United States city of Boston, in MA, using realistic dataobtained from a survey performed in 2010 (Logan Airport Air Passenger Ground-Access Survey, 2010);
performing a sensitivity analysis of the model’s performance by varying several parameters and by introducing relocation operations between the existing network and the high demand generator site, which have been used in one-way services around the world; and
providing insights on how this transition between one-way and round-trip should be put into practice.
The paper is structured as follows. We first present a review of the relevant literature on this topic. This is followed by the mathematical model, which is applied to a Boston case study. Finally, the main results of the model are presented, and the main conclusions drawn from this study and some possibilities for future work are summarized.
Several studies have appeared in the last years addressing strategic, tactical and operational planning decision-making for carsharing systems. In this literature review, our focus is on flexible systems. Boyaci et al. (2015) develop an optimization methodology, while Lopes et al. (2014) use an agent-based simulation model to determine the number and location of carsharing stations, the fleet size and its dynamic allocation to stations, and vehicle relocation operations. Rickenberg et al. (2013) presented a strategic-level study aimed at determining the location and size of carsharing stations using an optimization approach to minimize the costs of operating the service; while Nair and Miller-Hooks (2014) studied the same problem but with the objective of maximizing company profit. Using an optimization approach and queueing theory to model vehicle availability, George and Xia (2011) addressed a tactical decision-making problem to determine fleet size and vehicle distribution among stations. Cepolina and Farina (2012) studied the same problem and optimized fleet size and fleet distribution to stations, and used a simulation model to evaluate the performance of the optimized system. Combining tactical and operational decisions, Barrios and Doig (2014) and Nourinejad and Roorda (2014) explored the relationship between the existence of vehicle relocations and the fleet size needed to achieve a specified service level. Other authors concentrated their research on operational planning, studying ways to balance vehicle stocks in one-way carsharing systems, including, for example, relocation of vehicles between stations (Barth and Todd, 1999; Barth and Todd, 2001; Kek et al., 2006; Kek et al., 2009; Nair and Miller-Hooks, 2011; Krumke et al., 2013; Jorge et al., 2014; Nourinejad and Roorda, 2014; Repoux et al., 2014; Boyaci et al., 2015); user-based relocations (Barth et al., 2004; Uesugi et al., 2007; Febbraro et al., 2012; Weikl and Bogenberger, 2012; Pfrommer et al., 2014; Correia et al., 2014); accepting or refusing a trip (Fan et al., 2008; Correia and Antunes, 2012); station location selection (Correia and Antunes, 2012); and trip pricing (Mitchell et al., 2010; Papanikolaou, 2011; Zhou, 2012). There are also other studies, namely one by Kaspi et al. (2014), where parking reservation policies are presented in order to evaluate its impact on system performance.
Although most of these studies have features in common with our work, none develops a methodology for evaluating the model of integrating and enhancing round-trip carsharing systems with selected one-way service. In our model, we determine the capacity needed for the one-way station (in this case, Boston Logan Airport), given the fixed fleet size and capacity of existing round-trip stations. We also evaluate the impacts of relocation operations. This is in contrast to the work of Rickenberg et al. (2013), Barrios and Doig (2014), Lopes et al. (2014), Nair and Miller-Hooks (2014), and Boyaci et al. (2015) in which they develop a model to determine the location and capacity of the stations; or that of George and Xia (2011), Cepolina and Farina (2012), Barrios and Doig (2014), Lopes et al. (2014), and Boyaci et al., 2015 in which they determine fleet size and distribution; or finally, the work of Barth and Todd (1999), Barth and Todd (2001), Kek et al. (2006), Kek et al. (2009), Nair and Miller-Hooks (2011), Krumke et al. (2013), Jorge et al. (2014), Nourinejad and Roorda (2014), Repoux et al. (2014), and Boyaci et al. (2015), in which they optimize vehicle relocation operations. Moreover, we should note that all of the previous cited research is either on
round-trip or one-way services, while ours is unique in that it designs and evaluates hybrid round-trip and one-way systems.
3. Integer programming model
A mathematical programming model is proposed whose objective is to select the one-way trips that should maximize the expected daily profit of a carsharing company currently operating in a round-trip mode.
Two assumptions underlie this model: the capacity, that is, the number of parking spots in each round-trip station is not increased, and the fleet of vehicles is limited to the number of vehicles currently operating in the round-trip service.
It is important to note that there may be a different number of vehicles available in each station at the end of each day. Moreover, we performed a sensitivity analysis of the model’s performance, including the vehicle relocation operations between the existing round-trip stations and the station that it is created in the high demand generator site. The formulation presented below includes relocations. Even though they are only included for sensitivity analysis purposes, it is easier to explain the original model for this situation.
The notation used to formulate the model (sets, data and decision variables) is as follows:
Sets:
𝑺 = {1, … , 𝑖 … 𝐼}: set of stations, where 𝐼 is the number of stations including the high demand generator site.
𝑬 = {1, … , 𝑡 … 𝑇}: set of time steps in the operation period, where 𝑇 is the last optimization time step.
Data:
𝛿𝑖𝑗𝑡: Travel time, in time steps, between stations 𝑖 and 𝑗 when departure time is 𝑡, 𝑖, 𝑗 ∈ 𝑺, 𝑡 ∈ 𝑬. 𝑁: Total number of vehicles in the fleet.
𝐻𝑇𝑇: The longest travel time between any pair of stations during the whole day. 𝐷𝑖𝑡𝑗
𝑡+𝛿𝑖𝑗𝑡: One-way carsharing demand from 𝑖 to 𝑗 from time 𝑡 to time 𝑡 + 𝛿𝑖𝑗
𝑡, 𝑖, 𝑗 ∈ 𝑺, 𝑖 ≠ 𝑗, 𝑡 ∈ 𝑬, 𝑡 +
𝛿𝑖𝑗𝑡 ≤ 𝑇 + 𝐻𝑇𝑇.
𝑈𝑖1: Number of unavailable vehicles at station 𝑖 at the beginning of the optimization period (𝑡=1), ∀𝑖 ∈
𝑺, given that the round-trip service already exists and when the one-way service starts its operation,vehicles may be being used for the round-trip service, and therefore out of the stations.
𝑍𝑖𝑡: Number of vehicles that arrive at 𝑖 at time 𝑡, 𝑖 ∈ 𝑺\{𝐼}, 𝑡 ∈ 𝑬 for the round-trip service. 𝑊𝑖𝑡: Number of vehicles that depart from 𝑖 at time 𝑡, 𝑖 ∈ 𝑺\{𝐼}, 𝑡 ∈ 𝑬 for the round-trip service.
𝑃𝑖𝑗: Taxi fare per trip from station 𝑖 to 𝑗.
𝐶𝑚𝑝: Daily cost of a parking space in the high demand generator site. 𝐶𝑣: Cost of vehicle maintenance per time step driven in the one-way trips. 𝐶𝑓: Cost of fuel per time step driven.
𝐶𝑟: Cost of relocating a vehicle per time step driven. In this paper, we assume that hourly hires are
available to perform the needed relocation.
𝐶𝑎𝑝𝑖: Capacity of station 𝑖, 𝑖 ∈ 𝑺\{𝐼} in number of parking spots.
Decision Variables: 𝑥𝑖𝑡𝑗
𝑡+𝛿𝑖𝑗𝑡: Number of trips accepted from 𝑖 to 𝑗 from time 𝑡 to time 𝑡 + 𝛿𝑖𝑗
𝑡 , 𝑖, 𝑗 ∈ 𝑺, 𝑖 ≠ 𝑗, 𝑡 ∈ 𝑬, 𝑡 +
𝛿𝑖𝑗𝑡 ≤ 𝑇 + 𝐻𝑇𝑇. 𝑟𝑖𝑡𝑗
𝑡+𝛿𝑖𝑗𝑡 : Number of vehicles relocated from 𝑖 to 𝑗 from time 𝑡 to time 𝑡 + 𝛿𝑖𝑗
𝑡, 𝑖, 𝑗 ∈ 𝑺, 𝑖 ≠ 𝑗, 𝑡 ∈ 𝑬, 𝑡 +
𝛿𝑖𝑗𝑡 ≤ 𝑇 + 𝐻𝑇𝑇.
𝑎𝑖𝑡: Number of vehicles available at station 𝑖 at the start of time , 𝑖 ∈ 𝑺, 𝑡 ∈ 𝑬\{1} . 𝑎𝐼1: Number of vehicles available at site 𝐼 at the beginning of the operation period (𝑡=1). 𝑐𝐼: Capacity of the station at the high demand generator, 𝐼, in number of parking spots.
Using the notation above, the mathematical model can be formulated as follows:
𝑀𝑎𝑥 𝜋 = ∑
∑
𝑥
𝑖𝑡𝑗 𝑡+𝛿𝑖𝑗𝑡 𝑡∈𝑬 𝑡+𝛿𝑖𝑗𝑡≤𝑇+𝐻𝑇𝑇 𝑖,𝑗∈𝑺 𝑖≠𝑗× (𝑃
𝑖𝑗× 𝑚) − 𝐶𝑚𝑝 × 𝑐
𝐼−(𝐶𝑓 + 𝐶𝑣) × ∑
∑
𝑥
𝑖𝑡𝑗 𝑡+𝛿𝑖𝑗 𝑡∈𝑬 𝑡+𝛿𝑖𝑗𝑡≤𝑇+𝐻𝑇𝑇 𝑖,𝑗∈𝑺 𝑖≠𝑗× 𝛿
𝑖𝑗𝑡−(𝐶𝑟 + 𝐶𝑓) × ∑
∑
𝑟
𝑖𝑡𝑗 𝑡+𝛿𝑖𝑗𝑡 𝑡∈𝑬 𝑡+𝛿𝑖𝑗𝑡≤𝑇+𝐻𝑇𝑇 𝑖,𝑗∈𝑺 𝑖≠𝑗× 𝛿
𝑖𝑗𝑡((1)
subject to,
∑ 𝑎
𝑖𝑡 𝑖∈𝑺+ ∑ 𝑈
𝑖𝑡 𝑖∈𝑺= 𝑁, 𝑡 = 1
(2)
𝑎
𝑖1= 𝐶𝑎𝑝
𝑖− 𝑈
𝑖1, ∀ 𝑖 ∈ 𝑺\{𝐼}
(3)
𝑎
𝑖𝑡= 𝑎
𝑖𝑡−1−
∑
𝑥
𝑖𝑡−1𝑗 𝑡−1+𝛿𝑖𝑗𝑡 𝑗∈𝑺 𝑖≠𝑗 𝑡+𝛿𝑖𝑗𝑡≤𝑇+𝐻𝑇𝑇+ ∑ 𝑥
𝑗 𝑡−𝛿𝑖𝑗𝑡𝑖𝑡 𝑗∈𝑺 𝑖≠𝑗 𝑡−𝛿𝑖𝑗𝑡≥1−
∑
𝑟
𝑖𝑡−1𝑗 𝑡−1+𝛿𝑖𝑗𝑡+ ∑ 𝑟
𝑗𝑡−𝛿𝑖𝑗𝑡𝑖𝑡 𝑗∈𝑺 𝑖≠𝑗 𝑡−𝛿𝑖𝑗𝑡≥1− 𝑊
𝑖𝑡−1 𝑗∈𝑺 𝑖≠𝑗 𝑡+𝛿𝑖𝑗𝑡≤𝑇+𝐻𝑇𝑇+ 𝑍
𝑖𝑡,
∀ 𝑖 ∈ 𝑺, 𝑡 ∈ 𝑬\{1}
(4)
𝑥
𝑖𝑡𝑗 𝑡+𝛿𝑖𝑗𝑡≤ 𝐷
𝑖𝑡𝑗𝑡+𝛿𝑖𝑗𝑡,
∀𝑖, 𝑗 ∈ 𝑺, 𝑖 ≠ 𝑗, 𝑡 ∈ 𝑬, 𝑡 + 𝛿
𝑖𝑗 𝑡≤ 𝑇 + 𝐻𝑇𝑇
(5)
∑
𝑥
𝑖𝑡𝑗 𝑡+𝛿𝑖𝑗𝑡 𝑗∈𝑆 𝑖≠𝑗 𝑡+𝛿𝑖𝑗𝑡≤𝑇+𝐻𝑇𝑇+
∑
𝑟
𝑖𝑡𝑗 𝑡+𝛿𝑖𝑗𝑡 𝑗∈𝑆 𝑖≠𝑗 𝑡+𝛿𝑖𝑗𝑡≤𝑇+𝐻𝑇𝑇+ 𝑊
𝑖𝑡≤ 𝑎
𝑖𝑡, ∀𝑖 ∈ 𝑺, 𝑡
∈ 𝑬\{𝑇}, 𝑡 + 𝛿
𝑖𝑗𝑡≤ 𝑇 + 𝐻𝑇𝑇
(6)
𝑎
𝑖𝑡≤ 𝐶𝑎𝑝
𝑖,
∀𝑖 ∈ 𝑺\{𝐼}, 𝑡 ∈ 𝑬
(7)
𝑎
𝐼𝑡≤ 𝑐
𝐼,
∀𝑡 ∈ 𝑬
(8)
𝑥
𝑖𝑡𝑗 𝑡+𝛿𝑖𝑗𝑡∈ 𝑁
0,
∀𝑖, 𝑗 ∈ 𝑺, 𝑡 ∈ 𝑬, 𝑡 + 𝛿
𝑖𝑗𝑡≤ 𝑇 + 𝐻𝑇𝑇
(9)
𝑟
𝑖𝑡𝑗 𝑡+𝛿𝑖𝑗𝑡∈ 𝑁
0,
∀𝑖, 𝑗 ∈ 𝑺, 𝑡 ∈ 𝑬, 𝑡 + 𝛿
𝑖𝑗𝑡≤ 𝑇 + 𝐻𝑇𝑇
(10)
𝑎
𝑖𝑡∈ 𝑁
0,
∀𝑖 ∈ 𝑺, 𝑡 ∈ 𝑬
(11)
𝑐
𝐼∈ 𝑁
0(12)
The objective function (1) of the mathematical model maximizes the total daily profit (𝜋) of the one-way trips, taking into consideration the revenue from the trips paid by the clients (assuming that the price of each trip is 𝑃𝑖𝑗× 𝑚), the cost of maintaining the vehicles used for the one-way service, the parking costs
of the station at site 𝐼, and the vehicle relocation costs, when applicable. Constraint (2) guarantees that the total number of vehicles in the system is not greater than the current fleet at 𝑡 = 1 and computes the initial availability of vehicles (𝑎𝐼1) at the station at site 𝐼. Constraints (3) compute the initial availability of vehicles in each existing station, given that their capacities and the number of unavailable vehicles are inputs. Constraints (4) ensure the conservation of vehicle flows at each node (𝑖𝑡) of the time-space network
for 1 < 𝑡 ≤ 𝑇. Constraints (5) guarantee that the number of trips between stations 𝑖 and 𝑗 at time 𝑡 will not exceed the existing demand. Constraints (6) ensure that the number of vehicles leaving each station 𝑖 at each time 𝑡 does not exceed the availability of vehicles in each station 𝑖 at each time 𝑡. Constraints (7) guarantee that the capacity of station 𝑖 will not be greater than the current capacity of 𝑖 in the case of the existing round-trip carsharing stations. Constraints (8) ensure that the capacity of the station in the high demand generator at site 𝐼 is greater than the number of vehicles present there at any time 𝑡. In practice, capacity will not be greater than the highest value of 𝑎𝐼𝑡for the operation period, because this would penalize the objective function. Expressions (9)-(12) set the domain of the decision variables. The parameter 𝐻𝑇𝑇 is used to allow all the trips to be performed, even those that leave the station at the end of the operating period (𝑇), because the system is open 24 hours and therefore clients can pick up the vehicles on one day and return them on subsequent days. Despite the fact that we are only optimizing one typical day of operations, due to computational limitations, the model can be used for any day of operation. It assumes that, at the start of each day, which corresponds to the end of the previous day, there are a number of unavailable vehicles at each station that are already being used by the round-trip or the one-way services.
When no relocation operations are included in the model, the variable 𝑟𝑖𝑡𝑗𝑡+𝛿𝑖𝑗 is taken out from the constraints and the relocation costs are eliminated from the objective function (1).
4. Applying the model to the Logan Airport case study
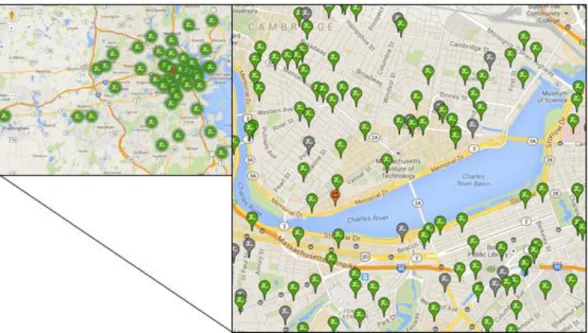
The model is applied to the trips between existing round-trip carsharing stations in Boston and Logan International Airport, which is close to the city center. Currently, there are 391 stations spread across the city with a fleet of about 1200 vehicles for use by clients (Zipcar(b), 2014). Most of the stations are within the city center; however, some of the suburbs are also served by Zipcar (Figure 1).
Figure 1 Visualization of the Boston Zipcar network (Zipcar(b), 2014).
Considering the round-trip service already offered in this city, i.e. the stations’ location and their capacity (number of parking spots) obtained from the Zipcar website (Zipcar(b), 2014), the other data needed to apply the model are:
the number of available vehicles in each station at each time, due to running the round-trip service, for three different days in May and June 2014 (information that was also collected from (Zipcar(b), 2014));
the potential trip demand matrix for the one-way carsharing service;
the driving travel times from the existing stations to Logan Airport and vice-versa; and the cost of running the one-way system.
The potential trip demand matrix uses data from a survey performed in 2010 by Logan Airport (Logan Airport Air Passenger Ground-Access Survey, 2010), and flight data (Flightstats, 2013). In spring 2013, an average of 39,424 passengers enplaned daily at Logan Airport according to information provided by the airport authorities. Taking this into account, together with the number of passengers enplaning and arriving at Logan Airport in 2012, taken from the DB1B database (Bureau of Transportation, 2013), it was possible to estimate the average number of passengers arriving each day at that airport in spring 2013, which resulted in 39,699 trips. Data from the Logan Airport Survey (Logan Airport Air Passenger Ground-Access Survey, 2010) were used to assign enplaning passengers to the origin station and arriving passengers to the destination station. This survey provides data about the number of passengers by origin (zip code), the transportation mode used to travel to the airport (private vehicle, taxi, rental vehicle, and public
transportation), and the type of passenger: resident business; resident leisure; non-resident business, and non-resident leisure.
First, considering the current stations in the Boston Zipcar service (Zipcar(b), 2014), only 36% of the total number of passengers surveyed can be captured by the one-way carsharing service; the others come from or are going to zip code areas with no Zipcar stations. These passengers correspond to a total of 14,193 enplaning passengers and 14,292 arriving passengers. Of these, it was assumed that only trips that currently use private vehicles, taxis or rental vehicles can be captured by carsharing. Moreover, demand may differ for the two trip purposes (business or leisure). While it can be expected that only a small percentage of business trips would transfer to carsharing, because companies usually pay for these trips, higher adoption rates can be expected with respect to leisure trips, since the main objective of these travelers is to choose the cheapest travel option. Therefore, we considered that only 15% of business passengers would be willing to choose carsharing while probably 100% of the non-business passengers would not mind taking this option. Moreover, vehicle occupation rates were considered diferentely, depending on the type of trip: for business trips we considered 1.0 person per vehicle, since business passengers usually travel alone, and for non-business trips we considered the vehicle occupation rate of 2.0. Given this, 2 non-business passengers correspond to one trip. The application of these criteria resulted in a potential trip demand matrix with a total of 5,474 trips. This is the upper bound for the demand scenarios that were tested.
The 5,474 trips were distributed by each zip code area according to the survey data. Knowing that there is more than one station in each zip code area, we decided to assign the trips to each station in each zip code according to the capacity (number of parking spots) that each station has at present for the round-trip service, that is, the more parking spots currently assigned to that station, the more trips starting from or ending at it.
Flight data (Flightstats, 2013) were used to assign a departure time to each trip from a station or from the airport. Flight schedule data (departures and arrivals to Logan Airport) were considered for one week in April 2013, with respect to their departure and arrival time and type of airplane used for each flight. The type of airplane provides information on the number of seats on each flight and the Consulting Bureau of Transportation (2013) provides details of airplane load factors for domestic flight departures and arrivals for the year 2012, which were: 0.8493, and 0.8723, respectively; and for international flight departures and arrivals for the same year, which were: 0.7346, and 0.7491, respectively. This information was combined to give an estimation of the number of passengers on each flight at each time of the day. Hence, the probabilities of enplaning trips happening at a given time of the day are estimated by dividing the number of enplaning trips occurring at each time by the total number of enplaning trips in the whole day. Equally, with respect to the arriving trips, the process is the same.
The process explained above provided aggregated information, such as: the number of trips departing from each station in a whole day; the number of trips arriving at each station in a whole day; the probability of enplaning trips occurring at each time in the 24 hours, and the probability of arriving trips happening at
each time in the 24 hours. However, we needed to distribute the trips by pair of stations and time of the day at which each occurs. The Monte Carlo simulation method was used for this, computing the cumulative probabilities and randomly generating a time when each enplaning and arriving trip will occur. Therefore, the Monte Carlo simulation is only used to generate the potential demand matrix, which is an input to the optimization model. We note, however, that this process may have a significant influence on the optimization results due to its randomness, hence this will be tested.
With the process described above we obtained the distribution of the trips according the flight departure and arrival times, however, it is necessary to note that people need to arrive to the airport some time before the flight departure and are only able to leave the airport some time after the flight arrival. Thus, to match the airplane trips with the carsharing trips and lacking better information, we considered that passengers going on a domestic flight begin their trip 2 hours before boarding, and for international flights, they begin 3 hours before boarding. With respect to the arrivals, it is assumed that passengers are able to pick a car from the airport one hour after the airplane’s arrival, for domestic and international flights alike.
The day was divided into time steps of 20 minutes, which allows the necessary precision for the most frequent travel times in the city. The proposed model takes the effects of congestion into account, although data limitation issues meant that we used the same driving travel times for the whole day, which were computed using the Google Maps application (GoogleMaps, 2014) and expressed in time steps of 20 minutes.
The Honda Civic Ex Sedan 1.6 that is currently in use in the Zipcar fleet was the reference for computing vehicle costs. It has an initial cost of USD 20,815.0 (autos, 2013). The cost of running the system was calculated as realistically as possible according to:
𝐶𝑓 (cost of fuel): USD 0.442 per time step driven (20 min), taking an average speed of 10 miles/hour, a price per gallon of USD 3.668 (BostonGasPrices, 2014), which is according to today’s cost, and assuming that the cars are mainly driven in the city (consumption of 28 miles per gallon according to autos (2013));
Cr (cost of relocating a vehicle): USD 4.323 per time step driven (20 min), since the averagehourly wage of a taxi driver in Boston, MA, is USD 12.97 (Bureau of Labor Statistics, 2013);
𝐶𝑚𝑝 (cost of maintaining a parking space): USD 29 per day, which is the fee for parking in theterminal area of Logan International Airport (Massport, 2014);
𝐶𝑣 (cost of one vehicle, which includes maintenance and repairs): USD 0.034 per time step driven, calculated for a city car (autos, 2013).The price charged to clients of the one-way carsharing service varies according to the location of the origin and destination stations and is given by multiplying an experimental parameter (𝑚 percentage) by
the taxi price charged to each pair of OD stations (𝑃𝑖𝑗), which includes the initial fare, Massport fee, tolls
and distance travelled fare (Taxifarefinder, 2013; Itoataxi, 2013). The 𝑚 percentage is always lower than 1 (100%).
5. Results
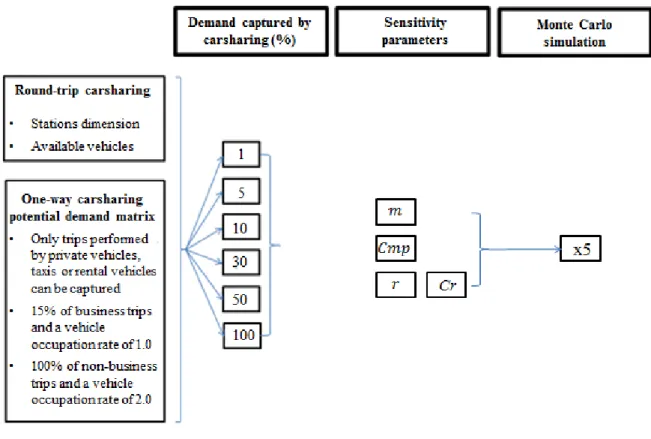
Considering that the matrix produced in the previous section is the upper bound of the demand (potential demand) that can be reached by the one-way service, 6 demand scenarios were tested based on different percentages of potential demand that may be captured by carsharing (demand scenario): 1%, 5%, 10%, 30%, 50%, and 100%. These scenarios were considered in order to observe the effects of the captured demand on the profit of the company, even when it is very low, as happens with the 1% and 5% scenarios. The following parameters were varied for each of the demand scenarios in order to perform a sensitivity analysis: percentage of the taxi price (𝑚), airport parking cost (𝐶𝑚𝑝), allowing or preventing vehicle relocations between existing stations and Logan Airport (vector 𝑟𝑖𝑡−1𝑗𝑡−1+𝛿𝑖𝑗), and varying relocation operations cost (Cr). Relocations in the round-trip service, which operates with reservations, are planned with known round-trip demand and the expected trip pattern of one-way trips; one-way service does not operate with reservations.
The tests were performed using round-trip data for May 27 (Tuesday), June 10 (Tuesday) and 11 (Wednesday), 2014. We used more than one day so as to test the sensitivity of the model to different days and thus different availabilities of vehicles in each station. The initial availability (𝑎𝑖1) of vehicles at each existing station varies for each day. Moreover, the model was also run assuming only the one-way service in order to see how the round-trip service (the priority one) constrains the new service.
The model was run 5 times for each demand scenario and combination of parameters, and the average results were computed to account for the randomness inherent to the use of the Monte Carlo simulation in the determination of the potential trip demand matrix. The operator should base decisions on average
values depending on the combination of parameters chosen.
Figure 2 Methodology used to obtain the results.
The mathematical model (1)-(12) was run for all the possible combinations of these experimental factors (a total of 360 runs) in an i5 processor @ 2.50 GHz, 4 Gb RAM computer under a Windows 7 64 bit operating system. The model was built using Xpress 7.7, an optimization tool that uses branch-and-cut algorithms for solving MIP problems (FICO, 2014). The model always reached optimum solutions for every run, taking a minimum of 0.5s and a maximum of 308.8s as running time.
5.1. Sensitivity analysis
The following variables were used as performance indicators for the experiments: the percentage of trips effectively served by the one-way carsharing system for the demand scenario considered; the total number of trips performed; the total number of time steps driven by the clients (time steps of 20 minutes); the utilization rate of each vehicle for the one-way carsharing service; the number of parking spots that were needed at the airport (airport station capacity); the daily profit obtained by the company; the percentage of relocations related to the demand effectively satisfied for each demand scenario; the total number of relocated vehicles; the total number of time steps of vehicle relocation.
It is important at this point to explain that in this paper we define three levels of demand: the potential demand that corresponds to a total upper bound demand (5,474 trips); the demand scenario that is basically
a percentage of the upper bound; the demand effectively satisfied by carsharing that will result from applying the model (it will of course be a percentage of the previous one).
The following is the base combination of parameters considered for sensitivity analysis purposes: 60% of the taxi price (𝑚 = 0.6) charged to the clients, since it seems to be the most reasonable
one in terms of profit for carsharing, competitiveness with the private vehicle and the taxi, and sufficiently greater than the public transportation price in order to not capture that demand; the cost of maintaining a parking space in the airport is taken to be USD 29 per day, which is
the price currently charged to private drivers (Massport, 2014);
no relocations are considered, since they present additional operational complexity to the operator, who may not be willing to use them.
The price charged to the clients is then varied, decreasing to 40% of the taxi price per trip and increasing to 80%, while the other parameters remain the same. The cost of maintaining a parking space in the airport is also varied, decreasing to USD 20 per day and then increasing to USD 40 per day, keeping the other parameters the same as the base combination. Finally, relocation operations are added to the base combination of parameters with two different costs, the direct one (explained in the previous section) and the double of the direct one to take into consideration the round-trip of the person that performs the relocation operation. Relocation operations are only an add-on to the base combination of parameters and are not included in all the other tests performed since they are difficult to manage by the operator.
Table 1 presents all the experimental configurations, as well as the average results for 5 replications of demand estimation, applied to the data of May 27, 2014.
Table 1 Average results for 5 demand estimation replications
Experimental configuration Results
Potential demand that can be captured (% of total demand) m Cmp Reloc.. Cr Demand effectively captured (% of the potential demand) Total n. of trips done using one-way carsharing service per day Total n. of time steps driven per day Utilization rate per vehicle by one-way carsharing N. of parking spaces needed at the airport Profit per day (USD) Reloc. (%) Total n. of reloc. Total n. of reloc. time steps per day 1 0.6 29 no -- 0.36 20 24 0.03 4 315.6 -- -- --0.4 29 no -- 0.34 19 23 0.03 3 174.0 - -- --0.8 29 no -- 0.60 33 37 0.04 10 492.9 - -- --0.6 20 no -- 0.60 33 37 0.04 10 383.2 - -- --0.6 40 no -- 0.35 19 23 0.03 3 278.4 - -- --0.6 29 yes 4.323 0.97 53 60 0.07 3 653.3 64.48 34 37 0.6 29 yes 8.646 0.88 48 55 0.06 4 513.9 44.81 24 27
5 0.6 29 no -- 2.43 133 141 0.16 11 1890.5 -- -- --0.4 29 no -- 2.37 130 139 0.16 10 1134.1 - -- --0.8 29 no -- 3.24 177 187 0.22 28 3058.1 - -- --0.6 20 no -- 2.94 161 170 0.20 26 2053.3 - -- --0.6 40 no -- 2.39 131 139 0.16 10 1770.5 - -- --0.6 29 yes 4.323 4.60 249 268 0.31 8 3210.8 43.93 110 119 0.6 29 yes 8.646 4.30 235 254 0.29 11 2754.8 32.48 84 93 10 0.6 29 no -- 4.68 256 281 0.33 21 3826.3 -- -- --0.4 29 no -- 4.55 249 274 0.32 19 2316.0 - -- --0.8 29 no -- 5.07 278 302 0.35 32 5402.9 - -- --0.6 20 no -- 5.09 278 303 0.35 32 4072.2 - -- --0.6 40 no -- 4.60 252 276 0.32 19 3605.3 - -- --0.6 29 yes 4.323 8.90 487 534 0.62 12 6708.9 44.87 218 239 0.6 29 yes 8.646 8.47 464 511 0.59 14 5738.6 37.11 187 208 30 0.6 29 no -- 13.91 762 838 0.97 49 11524.5 -- -- --0.4 29 no -- 13.56 742 818 0.95 44 7095.1 - -- --0.8 29 no -- 14.34 785 861 1.00 61 16037.3 - -- --0.6 20 no -- 14.30 785 861 1.00 61 12032.2 - -- --0.6 40 no -- 13.77 754 830 0.96 46 10997.8 - -- --0.6 29 yes 4.323 27.99 1532 1674 1.94 34 21158.3 46.34 710 775 0.6 29 yes 8.646 26.52 1452 1592 1.84 30 17948,8 39.55 634 696 50 0.6 29 no -- 24.30 1330 1454 1.68 74 20334.1 -- -- --0.4 29 no -- 23.82 1304 1428 1.65 67 12648.9 - -- --0.8 29 no -- 24.58 1346 1469 1.70 81 28088.8 - -- --0.6 20 no -- 24.61 1347 1471 1.70 82 21034.6 - -- --0.6 40 no -- 23.97 1312 1436 1.66 69 19549.6 - -- --0.6 29 yes 4.323 47.26 2585 2830 3.28 51 36018.5 45.52 1177 1293 0.6 29 yes 8.646 44.73 2449 2690 3.11 46 30718.4 37.72 1034 1142 100 0.6 29 no -- 46.20 2529 2767 3.20 88 40166.1 -- -- --0.4 29 no -- 45.51 2491 2730 3.16 78 25523.2 - -- --0.8 29 no -- 46.55 2548 2787 3.23 96 54860.1 - -- --0.6 20 no -- 46.68 2555 2794 3.23 100 40984.3 - -- --0.6 40 no -- 45.80 2507 2746 3.18 82 39220.4 - -- --0.6 29 yes 4.323 93.50 5118 5593 6.47 96 69972.6 49.76 2547 2779 0.6 29 yes 8.646 87.19 4773 5240 6.06 82 58610.6 39.82 2180 2396 The base combination of parameters is shown in bold.
Besides the average of the results for the 5 replications, the standard deviation and the coefficient of variation were also computed (not shown in the table). The coefficient of variation was mostly lower than 0.2 for scenarios with 10% or less of potential demand captured by carsharing and 0.0 for scenarios with more than 10% of demand captured by carsharing. The maximum value of the coefficient of variation was 0.4 for the first 3 scenarios and 0.1 for the rest. The number of parking spots needed at the airport had the
highest coefficient of variation, which means that this output has the highest sensitivity to the demand variations.
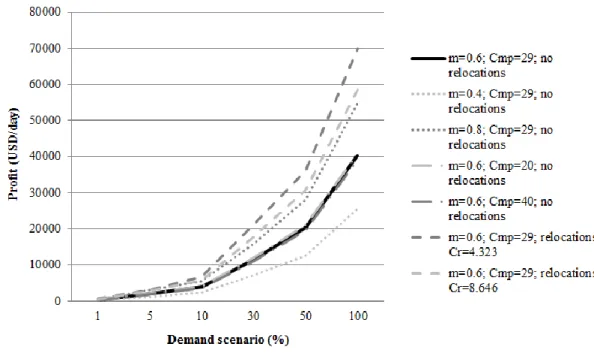
Analyzing Table 1, and considering the base combination of parameters, the profit obtained varies between USD 315.6 and USD 40,166.1 per day. However, it should be noted that scenarios with more than 10% of demand are probably not that realistic and have only been studied for sensitivity purposes.
As the price charged to the client increases, the profit, as expected, also increases (Figure 3). For example, for the 1% demand scenario, it varies from USD 174.0/day (when 40% of the taxi price was charged) to USD 492.9/day (when 80% of the taxi price was charged). The profit is inversely proportional to the cost of parking at the airport, so as the cost decreases, the profit increases (Figure 3). Considering the 10% demand scenario, the profit obtained varies from USD 3605.3/day for a parking cost of USD 40/spot×day to USD 4072.2/day for a parking cost of USD 20/spot×day.
Figure 3 Profit obtained for each demand scenario.
It can also be concluded from Table 1 that if the price charged to the clients or the cost of maintaining a parking space in the airport is varied, the changes in the demand that is effectively satisfied by the one-way carsharing for each demand scenario are not as great as using relocation operations. Moreover, for the variations considered in this study, changing parking costs for the company at the airport produces effects on the demand effectively captured by carsharing similar to changes in the price charged to the clients, taking into consideration their inverse proportionality.
The primary axis in Figure 4 represents the percentage of demand effectively satisfied for the 6 demand scenarios considered and each of the 6 parameter configurations. It is possible to see that the effect of
relocation operations on the one-way system is very significant, since they allow at least 90% of all the demand to be satisfied for each of the 6 demand scenarios. This occurs because relocating vehicles repositions them where they are needed and the whole system has enough vehicles for all the one-way trips if they are positioned in the desired stations at each time step, something that does not happen naturally without relocation operations. Although, as shown in the secondary axis through the number of potential trips in each demand scenario, this is much more relevant for the 100% demand where the maximum potential demand (5,474 trips) can almost be satisfied.
Figure 4 Demand effectively satisfied for each demand scenario.
With respect to the number of parking spots needed at the airport, this increases as the price charged increases, because there are more trips being served. It is important to note that we are not considering demand elasticity relative to price and that generally as price increases, demand decreases. However, we always considered lower prices for carsharing than the taxi and private vehicle prices. Therefore, we think that it is reasonable to consider that even if the price rises, the number of trips could still increase because some of the previously unprofitable trips would be more attractive to the system. When the cost of parking at the airport falls, there are more trips being served as happens when the price charged to the clients increases, and the capacity of the airport station also increases. Furthermore, as already mentioned, the results of changing parking costs at the airport or changing the price charged to the clients are similar for the combinations of parameters considered in this paper. As an example, Figure 5 shows a great parallelism between the lines related to the combination of parameters with the highest price charged to the clients and
the lowest cost of parking at the Airport. When relocations are added with a lower cost (the direct one), it is possible to have a smaller station at the airport for all the demand scenarios considered except the 100% scenario, varying between 3 spots for the 1% scenario and 96 spots for the 100% scenario. In the case of adding relocations with a higher cost, it is not possible to have smaller stations at the airport for the demand scenarios 1% and 5%. However, it is possible to have smaller stations for the other demand scenarios, even when compared with having relocations with a lower cost for demand scenarios of 50% and 100%.
Figure 5 Number of parking spots needed at the airport for each demand scenario.
Analyzing the scenarios that involve relocation operations, we find that these have the best results in terms of profit, and demand effectively captured by carsharing, which confirms previous findings found in the literature (Fan et al., 2008; Kek et al., 2009; Jorge et al., 2014). Regarding the capacity of the airport station, the results are different when the costs of relocation change as noted previously. Nonetheless, the number of relocations is great when compared to the number of one-way trips satisfied, as shown in Table 1. The company may not want to manage such logistic process everyday. The difficulty of managing relocation operations is not discussed in detail in this paper. For a better insight on this problem, see the authors’ previous paper (Jorge et al., 2014). As it was expected, comparing the high and low relocation costs scenarios, we can notice that as the cost increases, there is a decrease on the number of vehicle relocations and as a consequence of the demand attended by the system. Nevertheless, the demand effectively captured by carsharing considering a higher cost for the relocation operations is still higher than the demand satisfied in all scenarios with no relocations.
The utilization rate of each vehicle for the one-way carsharing service is small, varying from 0.03% for the 1% demand scenario and 6.47% for the 100% demand scenario with the lowest relocation costs. This
means that even to satisfy almost all of the one-way demand, the amount of time that vehicles are being in this new service is small when compared to the time vehicles are stopped at the stations or are being used for the round-trips.
Analyzing the departures and arrivals of trips over a whole day for each station in the city, it is possible to assess which stations should be open to the one-way carsharing service. If no relocations are considered, these are the stations that have potential one-way service demand (departures plus arrivals) higher than the average potential demand for all the stations (14 trips), and that at the same time have more than one vehicle assigned to them. When there is only one vehicle available, this is mostly used for the round-trip service, which leaves no vehicle available for the one-way service. Note that this model does not consider trip rejection for the round-trips. Moreover, it is concluded that the price charged to the clients has no influence on the location of the stations that should be open to the one-way carsharing service towards the airport. This is because the bigger stations are closer to the airport (for instance, in Boston, Cambridge, Somerville, Dorchester, Jamaica Plain, and Brookline). Thus, the trips from/to these stations are cheaper, but they are the ones most likely to be performed because they are from/to stations with more available vehicles.
Looking at the stations located in the Boston suburbs, revenue from the trips where they are the origin or destination would be higher, but at the moment they have few vehicles for the round-trip service, and not enough for one-way trips. This effect can be seen by running the model without considering the round-trips. The number of trips performed using the one-way carsharing service in that case increases, as well as the number of time steps driven, as expected. For instance, for the base combination of parameters and the 5% demand scenario, there are 25 more trips satisfied and 32 time steps driven when no round-trips are considered. The increase in the number of time steps driven is much greater than the increase in the number of trips, showing that the model is choosing trips from/to stations further away from the airport, since all the vehicles present in the suburbs’ stations are available for use by the one-way service.
5.2. Effect of daily demand variations
In addition to the round-trip demand data from May 27, 2014, data for two more days were obtained (June 10 and 11, 2014). This was used to investigate the effect that round-trip demand variations may have on the results. These three days had different vehicle availabilities in most of the stations; however, by running the model for each of them we found that results are similar for all parameters considered.
For the base combination of parameters, the changes in profit for 10% or less demand scenarios are always lower than 9.5% (USD 382.4/day). In the worst case, with respect to the number of parking spots needed at the airport station, the changes correspond to less than 12.5% (3 parking spots). From these results it can be concluded that the variations in profit and the capacity of the airport station are significant across the days. However, considering different days, and thus different vehicle availabilities in each station at each time, the model always finds a solution for the one-way carsharing service that allows the company to
make a profit. This is because it adjusts the trips selected to be satisfied according to the availability of vehicles in each station after the round-trip demand is wholly satisfied. However, it may not occur when the utilization rates of the round-trip service are so high that there are no available vehicles left to be used by the one-way carsharing service. Therefore, the company should work out if these one-way trips are profitable enough to make it worthwhile adding more vehicles to the integrated system or if it should stop offering the way service. We concluded that for 10% or less demand scenarios, the profit from the one-way carsharing service falls as the number of round-trip entries and exits increases. Summing the number of entries and exits for the round-trip system for each of the three days (May 27, June 10, and June 11, 2014), the following figures are obtained: 2440, 2357, and 2417, respectively. For instance, taking the 1% demand scenario and the base combination of parameters, the profits of the one-way carsharing service on those days are USD 315.6, USD 423.6, and USD 385.1, respectively. It is necessary to perform a sensitivity analysis to evaluate the capacity impacts of the airport station, as there is significant daily demand variation.. The values we present for different combinations of parameters are intended to provide insights about the range of possibilities.
To study the effect that different one-way trip patterns, and therefore different vehicle availabilities at each station, may have on the results, we ran the model for the first day of one-way carsharing service operation, considering: our assumption that the availability at site 𝐼 at 𝑡 = 1 is 0 (since we are not increasing the existing vehicle fleet and the vehicles in it are at the existing stations or being used by clients); that the model can increase the vehicle fleet by adding vehicles to the airport station at 𝑡 = 1, given that this is done with a cost of the depreciation of these vehicles to the company, which is USD 14.781 per vehicle per day, according to autos (2013). Both hypotheses result in significantly different trip patterns (availability of vehicles at each station during this day). However, in terms of the profit obtained, these differences are not that significant as they amount only to a maximum of about 4% for the most realistic scenarios (1, 5, and 10%). Once again, this demonstrates that the model is able to adapt the demand satisfied to the number of available vehicles at each station at each time step, thereby maximizing the profitability of the carsharing company.
6. Conclusions
From the user’s point of view, one-way carsharing systems are a better option for more trip purposes than round-trip services. While round-trip carsharing is used for short duration activities, such as leisure and shopping (Balac and Ciari, 2014; Barth and Shaheen, 2002), one-way carsharing may be used to other purposes, including commuting (Balac and Ciari, 2014; Ciari et al., 2014; Shaheen et al., 2006). Nevertheless, this type of system is more complex in terms of management, mostly arising from the imbalance of vehicle stocks.
on the clients’ needs. Hence, we studied the adaptation of a system that is operating for round-trips so that it can handle one-way trips for a specific high demand generator in a city. The round-trip service was deemed the priority one, that is, it should be served first, since it is the core business of the company. A mathematical model was developed to decide which one-way trips to accept and reject towards the carsharing station located in the high demand generator. The application of the model to the case study of Boston, with the high demand generator station located at Logan International Airport, led to the conclusion that the one-way carsharing service is profitable for all the scenarios considered. This is reinforced by the fact that Zipcar started to integrate both round-trip and one-way carsharing in Boston during this year (ZipcarOneWay, 2014). However, this study was completed before this change in operations.
Implementing a relocation policy between the round-trip stations and the high demand generator station at the airport and vice-versa had a great impact on increasing profits. For example, for the lowest cost of the relocation operations and the 5% demand scenario, the profit achieved when relocations are performed is 70% higher than when no relocations are performed, and about 27% fewer parking spots are needed at the airport than when there are no relocations. This airport station capacity corresponds to 8 parking spots, which is a realistic capacity for the airport parking lot. Without relocations, this number grows significantly. As a general conclusion, it can be said that there is a potential market for integrating round-trip and one-way carsharing services - at least for particular high demand generator sites. This is the case of an airport, where the carsharing company may find extra profit while also benefiting travelers by offering them another transportation option that is cheaper than other modes. Even if the carsharing company does not want to resort to a relocation system, providing a one-way service for a selected destination would seem to take advantage of idle vehicle stocks in many stations of a city. It is important to note that the cost to the clients should be lower than the cost of using other more comfortable transportation modes, such as taxi and private vehicles (Alfian et al., 2014), in order to make this service competitive. Nonetheless, they should also be high enough for the company to make profit. Our model also indicates which stations should be open to one-way trips. It was concluded that these stations should be those that have a potential demand (entries plus exists) that is higher than the average potential demand for all the stations, and those with a fleet of 2 or more vehicles.
A significant limitation of this study must be acknowledged, which is the fact that there is no model to relate demand to the price charged; hence, no elasticity of demand to price is incorporated. This is one of the improvements that can be added in the future. Moreover, future work should look at the possibility of increasing the capacity of existing stations in favorable locations to cope with the one-way carsharing service, as well as increasing the vehicle fleet. The interaction between several high demand generators in the city is also an interesting challenge. However, it is important to note that an increase in the number of significant generators of one-way trips will increase the size of the problem; there will be more possible origin-destinations station pairs, leading to an increased number of 𝑥 variables (and 𝑟 variables if we are
considering the scenario with relocations), and increased computational challenges. For each one-way high demand generator site considered, we are creating 56304 (391*2*72) 𝑥 decision variables. In the scenario with relocations, the increase in the number of variables 𝑟 is also equal to 56304.
Acknowledgements
The research on which this paper is based was carried out within the framework of a PhD thesis under the MIT Portugal Program. The authors wish to thank Fundação para a Ciência e a Tecnologia for financing this PhD project through the scholarship SFRH/BD/51328/2010. The work was also supported by the InnoVshare project (PTDC/ECM-TRA/0528/2012) financed by the same Institution. The authors also wish to thank Lourenço Dantas from Massport – Massachusetts Port Authority for providing essential data for accomplishing this work and Jóni Santos, a PhD student from the MIT Portugal Program who helped to gather all data needed for this study.
Disclaimer: This paper is the result of an analysis conducted on an existing carsharing service in the city of Boston, called Zipcar, however, the paper does not purport to represent the views of this company nor did this organization contribute to fund any component of this research. Moreover, this study was finished before Zipcar started to integrate both types of carsharing in Boston.
References
Alfian, G., Rhee, J., Yoon, B., 2014. A simulation tool for prioritizing product-service system (PSS) models in a carsharing service. Computers & Industrial Engineering 70, 59-73.
autos. autos.yahoo.com. Accessed April 20, 2013.
Balac, M., Ciari., F., 2014. Modelling Station-Based Carsharing in Switzerland, in 14th Swiss Transport Research Conference, Monte Verità/Ascona, Switzerland, 14-16 May 2014.
Barrios, J., Doig, J., 2014. Fleet sizing for flexible carsharing systems: a simulation-based approach. Transportation Research Board 93rd Annual Meeting, Washington D.C., 12-16 January 2014.
Barth, M., Shaheen, S., 2002. Shared-Use Vehicle Systems: Framework for Classifying Carsharing, Station Cars, and Combined Approaches. Transportation Research Record: Journal of the Transportation Research Board 1791, 105–112.
Barth, M., Todd, M., 1999. Simulation model performance analysis of a multiple station shared vehicle system. Transportation Research Part C 7(4), 237-259.
Barth, M., Todd, M., 2001. User Behavior Evaluation of an Intelligent Shared Electric Vehicle System. Transportation Research Record: Journal of the Transportation Research Board 1760, 145-152.
Barth, M., Todd, M., Xue, L., 2004. User-Based Vehicle Relocation Techniques for Multiple-Station Shared-Use Vehicle Systems, in 83rd Annual Meeting of the Transportation Research Board, Washington, D.C., USA, 11-15 January 2004.
BostonGasPrices. http://www.bostongasprices.com. Accessed June 18, 2014.
Boyaci, B., Zografos, K., Geroliminis, N., 2015. An optimization framework for the development of efficient one-way car-sharing systems. European Journal of Operational Research 240 (3), 718-733. Bureau of Labor Statistics. www.bls.gov/oes/current/oes_ma.htm. Accessed December 13, 2013. Bureau of Transportation. http://www.transtats.bts.gov. Accessed July 7, 2013.
Celsor, C., Millard-Ball, A., 2007. Where Does Carsharing Work?: Using Geographic Information Systems to Assess Market Potential. Transportation Research Record: Journal of the Transportation Research Board 1992, 61–69.
Cepolina, E., Farina, A., 2012. A new shared vehicle system for urban areas. Transportation Research Part C 21(1), 230-243.
Ciari, F., Bock, B., Balmer, M., 2014. Modeling station-based and free-floating carsharing demand: a test case study for Berlin, Germany. Emerging and Innovative Public Transport and Technologies. CD-ROM. Transportation Research Board of the National Academies, Washington, D.C., USA.
Correia, G., Antunes, A., 2012. Optimization approach to depot location and trip selection in one-way carsharing systems. Transportation Research Part E: Logistics and Transportation Review 48(1), 233-247.
Correia, G., Jorge, D., Antunes, D., 2014. The added value of accounting for users’ flexibility and information on the potential of a station-based one-way carsharing system: an application in Lisbon, Portugal. Journal of Intelligent Transportation Systems: Technology, Planning, and Operations 18(3), 299-308.
Costain, C., Ardron, C., Habib, K., 2012. Synopsis of users’ behaviour of a carsharing program: a case study in Toronto. Transportation Research Part A: Policy and Practice 46(3), 421-434.
Fan, W., Machemehl, R., Lownes, N., 2008. Carsharing: Dynamic Decision-Making Problem for Vehicle Allocation. Transportation Research Record: Journal of the Transportation Research Board 2063, 97-104.
Febbraro, A., Sacco, N., Saeednia, M., 2012. One-way carsharing: solving the relocation problem, in 91st Annual Meeting of the Transportation Research Board, Washington, D.C., USA, 22-26 January 2012, pp. 113-120.
FICO, 2014. Getting Started with Xpress, Release 7.7. Fair Isaac Corporation, Leamington Spa, UK. Firnkorn, J., Müller., M., 2011. What will be the environmental effects of new free-floating carsharing
systems? The case of car2go in Ulm. Ecological Economics 70(8), 1519-1528. Flightstats. www.flightstats.com. Accessed April 4, 2013.
George, D., Xia, C., 2011. Fleet-sizing and service availability for a vehicle rental system via closed queueing networks. European Journal of Operational Research 211(1), 198-207.
Google Maps. https://www.google.com/maps/dir///@37.0625,-95.677068,4z/data=!4m3!4m2!1m0!1m0. Accessed June 15, 2014.
Itoataxi. www.itoataxi.com/fare_info.htm. Accessed July 5, 2013.
Jorge, D., Correia, G., Barnhart, C., 2014. Comparing optimal relocation operations with simulated relocation policies in one-way carsharing systems. IEEE Transactions on Intelligent Transportation Systems 15(4), 1667-1675.
Kaspi, M., Raviv, T., Tzur, M., 2014. Parking reservation policies in one-way vehicle sharing systems. Transportation Research Part B 62, 35-50.
Kek, A., Cheu, R., Chor, M., 2006. Relocation Simulation Model for Multiple-Station Shared-Use Vehicle Systems. Transportation Research Record: Journal of the Transportation Research Board 1986, 81-88. Kek, A., Cheu, R., Meng, Q., Fung, C., 2009. A decision support system for vehicle relocation operations
in carsharing systems. Transportation Research Part E: Logistics and Transportation Review 45(1), 149-158.
Klincevicius, M., Morency, C., Trépanier, M., 2014. Assessing the impact of carsharing on household car ownership in Montreal. Emerging and Innovative Public Transport and Technologies. CD-ROM. Transportation Research Board of the National Academies, Washington, D.C., USA.
Krumke, S., Quilliot, A., Wagler, A., Wegener, J., 2013. Models and Algorithms for Carsharing Systems and Related Problems. Electronic Notes in Discrete Mathematics 44, 201-206.
Litman, T., 2000. Evaluating Carsharing Benefits. Transportation Research Record: Journal of the Transportation Research Board 1702, 31–35.
Lopes, M., Martinez, L., Correia, G., 2014. Simulating carsharing operations through agent-based modeling: an application to the city of Lisbon, Portugal. Transportation Research Procedia 3, 828-837. Martin, E., Shaheen, S., 2011. Greenhouse gas emission impacts of carsharing in North America. IEEE
Transactions on Intelligent Transportation Systems 12(4), 1074-1086.
Massport, 2010. Logan Airport Air Passenger Ground-Access Survey, Boston Logan Airport, 2010. Massport. http://www.massport.com/logan-airport/. Accessed August 15, 2014.
Mitchell, W., Borroni-Bird, C., Burns, L., 2010. Reinventing the Automobile: personal urban mobility for the 21st century, MIT Press, Cambridge, MA, USA, pp. 130-155.
Nair, R., Miller-Hooks, E., 2011. Fleet management for vehicle sharing operations. Transportation Science 45(4), 105-112.
Nair, R., Miller-Hooks, E., 2014. Equilibrium network design of shared-vehicle systems. European Journal of Operational Research 235(1), 47-61.
Nourinejad, M., Roorda, M., 2014. A dynamic carsharing decision support system. Transportation Research Part E 66, 36-50.
Papanikolaou, D., 2011. Optimizing Locations for a Vehicle Sharing System. Working paper.
Pfrommer, J., Warrington, J., Schildbach, G., Morari, M., 2014. Dynamic Vehicle Redistribution and Online Price Incentives in Shared Mobility Systems. IEEE Transactions on Intelligent Transportation Systems 15(4), 1567-1578.
Repoux, M., Boyaci, B., Geroliminis, N., 2014. An event-based simulation for optimising one-way carsharing systems, in 14th Swiss Transport Research Conference, Monte Verità/Ascona, Switzerland, 14-16 May 2014.
Rickenberg, T., Gebhardt, A., Breitner, M., 2013. A decision support system for the optimization of carsharing stations. Proceedings of the 21st European Conference on Information Systems, ECIS 2013 Completed Research. Paper 207.
Schmoller, S., Weikl, S., Muller, J., Bogenberger, K., 2014. Empirical data analysis of free-floating carsharing systems. In Emerging and Innovative Public Transport and Technologies. CD-ROM. Transportation Research Board of the National Academies, Washington, D.C., USA.
Schure, J., Napolitan, F., Hutchinson, R., 2012. Cumulative impacts of carsharing and unbundled parking on vehicle ownership & mode choice. Transportation Research Record: Journal of the Transportation Research Board 2319, 96–104.
Schuster, T., Byrne, J., Corbett, J., Schreuder, Y., 2005. Assessing the potential extent of carsharing - A new method and its applications. Transportation Research Record: Journal of the Transportation Research Board 1927, 174–181.
Shaheen, S., Cohen, A., Roberts., J., 2006. Carsharing in North America: Market Growth, Current Developments, and Future Potential. Transportation Research Record: Journal of the Transportation Research Board 1986, 116–124.
Shaheen, S., Sperling, D., Wagner., C., 1999. A Short History of Carsharing in the 90's. Journal of World Transport Policy and Practice 5(3), 16-37.
Sioui, L., Morency, C., Trépanier, M., 2013. How Carsharing Affects the Travel Behavior of Households: A Case Study of Montréal, Canada. International Journal of Sustainable Transportation 7(1), 52-69. Uesugi, K., Mukai, N., Watanabe, T., 2007. Optimization of Vehicle Assignment for Car Sharing System.
Knowledge-Based Intelligent Information and Engineering Systems 4693, 1105-1111.
Weikl, S., Bogenberger, K., 2013. Relocation Strategies and Algorithms for free-floating Carsharing Systems. IEEE Intelligent Transportation Systems Magazine 5(4), 100-111.
Zhou, S., 2012. Dynamic Incentive Scheme for Rental Vehicle Fleet Management. MSc Thesis, Massachusetts Institute of Technology, Cambridge MA, USA.
Zipcar(b). www.zipcar.com/boston. Accessed June 12, 2014.