Determining the Effects of Alloy Composition, Forging Technique, and Flux on the Strength of Forge Welds
by
Beatriz Andrea Gonzalez
Submitted to the
Department of Mechanical Engineering
in Partial Fulfillment of the Requirements for the Degree of Bachelor of Science in Mechanical Engineering
at the
Massachusetts Institute of Technology
June 2018
C 2018 Massachusetts Institute of Technology. All rights reserved.
Signature of Author:
Signature redacted
Depd{t'ment irPMechanical Engineering May 18, 2018
Signature redacted
Michael Tarkanian Certified by:
Senior Lecturer Department of Materials Science and Engineering Thesis Supervisor
Signature redacted
MASSACHUET INSUTE OF TECHNOLOGYSEP 132018
LIBRARIES
Rohit Karnik Professor of Mechanical Engineering Undergraduate Officer Accepted by:Determining the Effects of Alloy Composition, Forging Technique, and Flux on the Strength of Forge Welds
by
Beatriz Andrea Gonzalez
Submitted to the Department of Mechanical Engineering on May 11, 2018 in Partial Fulfillment of the
Requirements for the Degree of
Bachelor of Science in Mechanical Engineering
ABSTRACT
Welding is an essential manufacturing process in industries that require the joining of metal components such as the automotive and aerospace industries. While specialized techniques have developed for many of these industries, the process of welding remains fundamentality the same, and the effectiveness of these processes to securely join metal is always characterized by the material properties of the metal after welding. The tensile test performance of forge welds when made with different iron alloys, forge welding techniques, and fluxes was measured. The alloys used were 1018 steel, A36 steel and wrought iron. The forge welding techniques were the hydraulic press, the power hammer, and hand hammer. The fluxes were borax, fine silica sand, anti-borax, and no flux. Control tensile samples (un-welded) of each alloy, as received, were tested along with annealed samples. All testing was performed with an Instron 5984 Universal Testing Machine with 150kN capacity.
The results of the welded alloy tests showed that welded 1018 and A36 steel both had
considerably lower strength than their control annealed counterparts, whereas welded wrought iron remained just as strong. The results of the forge welding techniques test showed consistent welded A36 steel strengths across techniques used which may suggest that the effectiveness of particular techniques may be more dependent on experience and practice. The flux results show that silica sand and anti-borax work just as well as, if not better than, borax. Using no flux resulted in failed welding, revealing that achieving successful welds without flux requires more welding experience or a different method than the one performed by the welder of the samples for the present experiment. The results of the control alloys showed that 1018 and A36 steel both had considerably lower strength than their annealed counterparts, whereas wrought iron
remained just as strong.
Thesis Supervisor: Michael Tarkanian
ACKNOWLEDGEMENTS
I'd like to thank Michael Tarkanian and the rest of the Merton C. Flemings Materials Processing
Table of Contents
Abstract 2 Acknowledgements 3 Table of Contents 4 List of Figures 6 List of Tables 8 1. Introduction 9 2. Background 9 2.1 Steel Properties 92.2 Wrought Iron Properties 10
2.3 Forge Welding 11
2.4 Forge Welding Techniques 12
2.5 Difficulties in Creating Ideal Forge Welds 12
2.6 Steel Weldment Properties 13
2.7 Wrought Iron Weldment Properties 14
2.8 Flux Properties 15
2.9 ASTM Tensile Testing Procedure 15
3. Experimental Design 17
4. Results 20
4.1 Controls 20
4.2 Alloy Composition 29
4.4 Flux 37
5. Conclusion 40
6. Bibliography 41
List of Figures
Figure 2-1: Figure 2-2: Figure 2-3: Figure 2-4: Figure 4-1: Figure 4-2: Figure 4-3: Figure 4-4: Figure 4-5: Figure 4-6: Figure 4-7: Figure 4-8: Figure 4-9: Figure 4-10: Figure 4-11: Figure 4-12: Figure 4-13: Figure 4-14: Figure 4-15: Figure 4-16: Figure 4-17:Different forge welding configurations An example Stress-Strain curve
The standardized dimensions of a tensile test sample Photos of the tensile test sample preparation
Load-extension plot of cold-rolled and annealed 1018 steel Load-extension plot of hot-rolled and annealed A36 steel Microstructure of an untreated 1018 steel sample
Microstructure of an untreated A36 steel sample
Bar graph - Elastic Modulus of annealed and untreated 1018 and A3 6 Bar graph - Yield strength of annealed and untreated alloysl0l 8 and A36 Bar graph - Ultimate tensile strength of annealed and untreated 1018 and A3 6 Bar graph - Fracture point of annealed and untreatedi 018 and A36
Load-extension plot of the annealed alloys Bar graph - Yield strength of annealed alloys
Bar graph - Ultimate tensile strength of annealed alloys Bar graph - Fracture point of annealed alloys
Load-extension plot of the three welded alloys
Load-extension plot of welded and annealed 1018 steel Load-extension plot of welded and annealed A36 steel Load-extension plot of welded and annealed wrought iron Bar graph - Yield strength of welded and annealed alloys
Figure 4-18: Figure 4-19: Figure 4-20: Figure 4-21: Figure 4-22: Figure 4-23: Figure 4-24: Figure 4-25: Figure 4-26: Figure 4-27: Figure 4-28:
Bar graph - Ultimate tensile strength of welded and annealed alloys Bar graph - Fracture point of welded and annealed alloys
Load-extension plot of the welding techniques on 1018 steel Load-extension plot of the welding techniques on A36 steel Bar graph - Yield strength of welding techniques
Bar graph - Ultimate tensile strength of welding techniques Bar graph - Fracture point of welding techniques
Load-extension plot of the different fluxes Bar graph - Yield strength of different fluxes
Bar graph - Ultimate tensile strength of different fluxes Bar graph - Fracture point of different fluxes
32 33 34 34 35 36 36 37 38 38 39
List of Tables
Element composition comparison for welding steel Variables tested and constants
1. Introduction Table 2-1:
Table 3-1:
14
Welding is an essential manufacturing process in industries that require the joining of metal components such as the automotive and aerospace industries. While specialized techniques have developed for many of these industries, the process of welding remains fundamentality the same, and the effectiveness of these processes to securely join metal is always characterized by the material properties of the metal after welding. One of the simplest and oldest techniques is forge welding, typically done by blacksmiths. Forge welding consists of heating up two pieces of metal to a very high temperature and hammering them together. The combined action of heat and pressure allow the creation of chemical bonds between surfaces, allowing the joining of two components [1]. Forge welding is not typically used in manufacturing processes since it is impractical for large objects or complicated geometries. Because of its unsuitability to modern applications, there remains little scientific research on forge welding, despite strong dependence of weld quality on a wide range of variables.
Studies of these variables and their effects on weld quality may provide insight applicable to more modern techniques, such as arc welding or friction welding, while also helping close a gap in research of an older technique. The present work focuses on the individual effect of three variables of forge welding: the alloy being welded, the forging process, and the flux. These are some of the most important factors for welders to consider when make welds with strength requirements that vary from application to application. Determining the relationship between these variables and the strength of the weld will enable blacksmiths to make informed decisions relevant to both forge welding and conventional welding.
2. Background
2.1 Steel Properties
Every metal has distinct mechanical and chemical properties that originate from its composition and microstructure. Steels are composed of carbon, iron, and relatively small amounts of alloying elements and impurities, with typical weight percentage composition of 98% iron with 2% carbon and other elements. The two steels used in this study were A36 and 1018 steel. The classification of most steels based on their specific chemical composition has been standardized by a code developed by the AISI (American Iron and Steel Institute) [2]. The 1018
steel is classified through AISI by its chemical composition. On the other hand, A36 steel is designated through ASTM (American Society for Testing and Materials) by its mechanical properties, rather than by its chemical composition [3]. Thus, consistency for samples of 1018 and A36 is determined by the sample's particular designation; A36 samples will have consistent mechanical properties while 1018 samples will have consistent chemical composition. For this reason, 1018 steel is better suited as a control for some of the experiments performed, as the assumption is made that changes in chemical composition will vary forge welding properties more than changes in original mechanical properties.
Both of these steels are mild low carbon steels, meaning they have less than 0.3% carbon
by weight, and have similar chemical compositions. In spite of their similar chemical
composition, they have very significant mechanical property differences, attributable to differences in manufacturing process [4]. In order to create large steel products, a metal-forming rolling process is required in which stock metal is pressed down and shaped to a particular shape, such as bars or sheets. Rolling processes can be done at very high temperatures, known as hot rolling, or they can be done close to room temperature, known as cold rolling. Ultimately, cold rolling results in lower ductility, but higher hardness and strength qualities through the use of strain hardening in the process of stretching room-temperature metal [5]. Compared to hot-rolled
A36 steel, the cold-rolled 1018 steel studied in this thesis has higher tensile strength and yield
strength, and lower ductility and toughness. After welding, however, the mechanical properties of each metal will not remain the same. Through the process of forge welding, the metal will be heated up to a temperature at which annealing will occur and grain size will increase. The forging and welding process will also alter the microstructure and may introduce impurities.
2.2 Wrought Iron Properties
Besides these two steels, wrought iron was also used in this study. Wrought iron was the standard ferrous structural material for centuries, replaced by carbon steel made via the Bessemer
process in the late 19' and early 2 0th centuries [6]. In addition to elemental iron, wrought iron
contains 1-3% silicate slag by weight. The slag is introduced in the melting and production of the iron. Due to the very high temperatures required to melt and maintain pure iron in a furnace, the inner surface of the furnace itself reaches near melting temperatures and releases silicate
minerals (slag) that incorporates into the iron. Compared to steel, most wrought iron only has
0.02-0.03% of carbon per weight. The mechanical properties of wrought iron are close to what
would be expected of pure iron, but the embedded slag gives it very distinct characteristics such as directional preferences which mean higher tensile strength and ductility along the direction of the slag. Wrought iron is known for its resistance to corrosion, high ductility, and ability to resist fatigue failure [6]. Its uniqueness in microstructure and metallurgical properties, as well as its prevalence in blacksmithing history, make this an interesting subject of study especially in comparison with steel.
2.3 Forge Welding
Forge welding is one of the simplest and oldest welding processes. It consists of heating up two pieces of metal to a very high temperature and hammering them together. With high temperature and pressure, the two faces of metal fuse, creating a welded joint. Effective welding through this process occurs at around 80-90% of the melting temperature of the metal [7]. Selecting between the various configurations of the two pieces of metal as seen in Figure 2-1 depends on the intended function of the final product as each configuration will result in different weld properties. The general steps of forge welding are essentially the same for all types of metals. However, there may be variations in detailed techniques or machines used, as well as in added flux.
Jump
Lap C1 eft
Figure 2-1: Different forge welding configurations and their respective names [7]. The
2.4 Forge Welding Techniques
The most common forging techniques include hammering by hand, using a hydraulic press, and using a power hammer. Deciding which one to use often comes down to personal preference, application of the product, and the size and weight of the object being forged. Brief overviews of each technique are as follows:
1. Hammering by hand is the most intuitive and common technique. Fairly
self-explanatory, this technique only requires a hammer and an anvil. To forge weld, a blacksmith would support the hot metal against the anvil and use a hammer to strike down.
2. The hydraulic press is a common machine which uses a hydraulic piston to create large compressive forces. It is able to generate a large amount of pressure on an evenly distributed area to easily compress hot metal. One disadvantage is that the dies of the hydraulic press may act as a heat sink due to the slow speed at which they press down and high surface contact area.
3. The power hammer is another machine used to assist metalworking. It is a mechanical
forging hammer that uses stored potential energy to repeatedly hammer down on a piece. It can provide large amounts of force in powerful strikes which heat up the metal through the quick energy-releasing deformations. One disadvantage is the difficulty to control how much force or deformation is applied, which is particularly important when hammering with such powerful strikes.
2.5 Difficulties in Creating Ideal Forge Welds
While the process of forge welding appears very simple in theory, in reality there are many limitations for creating an ideal weld. From overheating and burning the metal to introducing impurities, these details have significant effects on the strength and microstructure of the welds. Some of the most common problems encountered in forge welding are:
* Burning the metal: Going above a metal's welding temperature may result in "burning the
metal", a phrase blacksmiths use to describe melting and oxidation. This rapid oxidation makes the resulting weld brittle.
" Introducing impurities: Impurities may be introduced in the welding process if the
surfaces are not thoroughly cleaned. These may inhibit or prevent the bonding process.
" Oxidation on surface: Oxidation on the surface of a metal may be the most problematic
condition, because a layer of surface oxidation on metal prevents welding..
" Low temperature: Not reaching an appropriate welding temperature may result in weak
welds or in an inability for the surfaces to join at all.
Several steps are usually taken to prevent these situations or decrease their effects. Forge welding, in particular, typically deals with high pressure and large plastic deformation that force surfaces closer together and allow the welding of imperfect surfaces. Using flux keeps surfaces from oxidizing and prevents impurities from incorporating in the metal. Ensuring the metal temperature stays in a good welding range falls to the attention and experience of the welder, although instrumentation such as thermocouples or pyrometers could be used to measure temperatures.
2.6 Steel Weldment Properties
Due to varying composition and structure, every metal has a different weldability, defMed as the unique penetration and weld fusion characteristics which affect the mechanical properties of resulting weld joints [8]. One of the main variables that affects weldability is the chemical composition of a metal. Besides iron, the most important element in steels is carbon, but other elements can have as big of an effect on weldability. In the United States and Europe, an empirically-determined equation supported by the International Institute of Welding (11W) is used to evaluate the weldability of steels by looking at the weight percentage of its element composition [8]:
CE I IIW=C++Mn Cu+i +Cr+Mo+V
6 15 5 (1)
Where CE is the carbon equivalent, and the chemical symbols indicate the weight percentage of each element in steel.
Other equations are used around the world to predict weldability, but the ranking is approximately the same. A high carbon equivalent (CE) reduces the weldability of steel. As
evident from the equation and expected from typical steel composition, carbon is found to have the largest effect. Low-carbon steels are considered very easily weldable, as well as mild steels. The two steels studied in these experiments fall in the low-mild carbon steels. Manganese, a common additional element in steel, also has a big influence in weld strength. Manganese, to an extent, increases the hardenability of welds and provides strengthening effects by grain refinement. Other elements, such as sulfur and phosphorus, also affect the resulting welds [9]. Table 1 compares the preferred and high element compositions of steel for ideal welding to the
1018 and A36 steels used in this experiment. It can be seen that A36 has the preferred
composition for all elements listed in the table, and 1018 has the preferred composition for all elements except Si, where it falls in the high range.
Table 2-1: Element percentages in the 1018 and A36 steels used for this experiment,
along with the preferred compositions for an ideal weld and the considered high percentages of each respective element. [9]
Element
_CompositionPreferred (%) High (%) 1018 Steel A36 Steel
Carbon 0.06-0.25 0.35 0.17 0.11
Manganese 0.35-0.80 1.40 0.78 0.35
Sulphur 0.035 or less 0.05 0.034 0.003
Phosphorus 0.030 or less 0.04 0.029 0.012
Silicon 0.10 or less 0.30 0.20 0.02
2.7 Wrought Iron Weldment Properties
Wrought iron differs from steel in many ways, including in its weldability. Most importantly, both in forging and in forge welding, wrought iron is worked at a higher temperature than steel (around 12600 C for forge welding steel and 13700 for wrought iron). Unlike steel, there is little possibility of burning wrought iron when forging due to its near inexistent carbon content. Also, oxidation is less likely to occur since a slag flux may automatically form at high temperatures on the wrought iron surface and protect it from oxidation [6]. According to literature, properly made welds in wrought iron will show ultimate tensile and yield strengths equal to, and usually greater than, those of the parent metal [6]. In general, wrought iron is
considered much easier to work with than steel, both in forging and forge welding. In fact, true wrought iron is such a slow and laborious process that it is no longer manufactured anymore for this reason. There are, however, not many studies comparing the effectiveness of welds and weldability between these iron alloys.
2.8 Flux Properties
Fluxes are typically used in the process of forge welding. A flux is a chemical agent which cleans the welding surfaces for effective joining. Fluxes prevent oxidation from occurring on the surface of a heated metal by dissolving the undesired iron oxide and acting as a layer of protection from further oxidation [10]. Hammering down the metal then allows the dissolved iron oxide and flux to stream out of the way from the welding surfaces. Iron oxide is detrimental to a weld because it is itself un-weldable, and thus metals with thick enough layers of oxide on their surface will also be un-weldable without its removal. One of the oldest fluxes known to be used on forge welds is silica sand [10]. Nowadays, borax remains one of the most popular options among blacksmiths. There is, however, little scientific research on the resulting weld's properties with various types of fluxes. This thesis looked at welds' strength and toughness when fluxed with borax, silica sand, a commercial proprietary flux, and no flux.
2.9 ASTM Tensile Testing Procedure
Tensile testing is one of the simplest and most common mechanical tests performed to measure material properties. It consists of pulling a sample under a controlled uniaxial load until failure of the sample. By looking at how the material elongates under tensile loading and creating a stress-strain curve, several properties can be determined, such as:
" Yield strength - the stress at which the material begins to plastically deform
" Young's Modulus, or Modulus of Elasticity - the slope of the elastic region which indicates the elastic relationship between stress and strain.
* Toughness - the energy needed to fracture a material - often approximated as the integration of the area of stress-strain curve, but more properly as a Charpy or Izod impact test.
These properties can be determined from the stress-strain curve in a method similar to that shown in Figure 2-2.
Strain to fracture -Uniform strain-Necking begins Ofst yield strengthTe Tse strOngthsile Fracture Stress Fracture Engineering strain, e
Figure 2-2: An example Stress-Strain curve showing the process a sample undergoes in a tensile test until failure. It also shows how to extract the material's properties from the
curve [11].
The process of tensile testing has been standardized by the ASTM. The procedure for testing welded joints is essentially the same as that for un-welded samples. These follow ASTM
E8 / E8M - 16a Standard Test Methods for Tension Testing of Metallic Materials. ASTM E
646-98 provides the standard tensile testing specimen in millimeters. These dimensions are shown in
Figure 2-3 and were the dimensions used for the samples in this paper.
C SU
50. M10
R13
20 - - - - ---
-500
200
Figure 2-3: The standardized dimensions of a tensile test sample in millimeters, according to ASTM E 646-98. This is the geometry and dimensions used for the samples in this paper.
3. Experimental Design
This thesis focused on three independent studies looking at three variables in forge welding: the alloy composition, the forge welding process, and the flux. The study of alloy composition considered three different metals which were 1018 steel, A36 steel, and wrought iron. The forging processes were hand hammering, using a hydraulic press, and using a power hammer. The fluxes used were borax, fine silica sand, a commercial proprietary flux, and no flux. Each of these variables was studied independently. The reference conditions were using
1018 steel, hydraulic press, and borax which were initially hypothesized to provide the most
consistent and repeatable conditions. For each experiment of a specific variable, the other two variables remained constant at the reference values. There were three samples for each condition. This is represented on Table 3-1.
Table 3-1: Variables tested and variables that remained constant. 1018 steel, borax, and
the hydraulic press were the reference conditions due to their expected consistency and repeatability. There were three samples for each condition.
Study
Alloy composition Forging Process Flux
Borax
Variables 1018 steel Hand hammering Silica sand
Tested A36 steel Hydraulic press Commercial flux
Wrought iron Power hammer
____ ___ ___ ___ ___ ____ __ ___ ___ ___ ___No flux
Constants Hydraulic press 1018 steel 1018 steel
The sample geometries followed the ASTM standards for tensile testing. The standardized design is that of a typical tensile "dog bone" shape with geometry and dimensions as shown in Fig.
2-3. In order to forge weld this shape, the first step was water-jetting half dog-bones. Each end was then tapered through forging. Two tapered pieces were placed on top of each other to create a scarf joint and were then connected with a small gas metallic arc welding (GMAW) weld at each end. These spot welds allowed the two pieces to stay in place in relation to each other while forge welding. The steps are shown in Figure 2-4. The forge welding differences included adding different fluxes before welding, using a different metal, and using different techniques. These individual processes were detailed in the Background section. The forge welded tensile specimens then underwent tensile testing on an Instron testing machine. The Instron program measured force and extension and provided stress-strain curves for each specimen.
a)
b)
c)
d)
Figure 2-4: Photographs of the tensile test samples being prepared for forge welding. a) Halves were created by waterjet machining. b) The ends were tapered down through forging c) and d) Lastly, the two halves were placed on top of the other and as scarf joints and connected with a small GMAW weld at the intersections. These welds allow the two pieces to stay together in place throughout the forge welding process.
For the purpose of differentiating the caused by heating metal from the effects of welding, full size (single-piece) control specimens were waterjet cut to be tested without welding. Some were tested as is after fabrication and the rest were heated to welding temperature three separate times before testing. These samples underwent the same tensile testing on the Instron machine as the welded samples.
The brands for each flux are the following: * Borax: 20 Mule Team brand
" Anti-Borax: EZ-Weld brand
" Silica sand: AFS 100 fine foundry sand
The details and specifications for each machine are the following:
* Hydraulic press: 25-ton "Imagination XPress" model
" Power hammer: Anyang 25 kg Pneumatic Power Hammer
The details and specifications for the Instron machine are the following:
* Instron Ultimate Testing Machine:
o Model: Instron 5984 with 150 kN capacity
o Speed of Instron cross-head: 2 mm/min (ASTM tensile test standard) o Force resolution: 15 N
4. Results
The analysis of the resulting data provides thorough insight into the advantages and disadvantages of each experiment variable. Both 1018 steel and A36 steel had lower yield strength when welded compared to their annealed counterparts. This was not true for wrought iron, whose strength did not vary significantly. Although there was a lot of variation for 1018 steel with different welding techniques, the A36 data was fairly consistent. This shows that the results of using a particular technique may be more dependent on experience and practice using that particular technique. Although borax, the most commonly used flux, did not have the highest yield strength, all three fluxes had very close strengths. The no flux samples did not effectively weld, but knowing that not using flux is common practice for some blacksmiths, this can be attributed to inexperience.
4.1 Controls
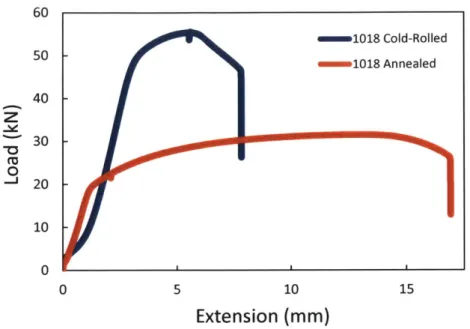
Normal flat tensile specimens ("dog bones") of "as-received" controls as well as matching samples that had been heated to welding temperature and cooled three times were tensile tested. The data of a normal sample and an annealed sample of each metal (1018 steel and A36 steel) are compared below on Figures 4-1 and 4-2. From these plots, further information about each sample's mechanical properties was extracted, in particular the Young's Modulus, yield strength, ultimate tensile strength, and fracture points. The Young's Modulus was obtained by averaging the slope of the initial elastic portion of the plot. The yield strength and ultimate tensile strength were measured through the Instron tensile testing program. The yield strength was the stress at which the material begins to deform plastically, and the ultimate yield strength was the maximum stress reached. The fracture point was the strain at which the sample fractured.
5 60 50 40 30 20 10 0 15
Figure 4-1: Load-extension plot of cold-rolled 1018 steel and annealed 1018 steel. The
plot shows a drastic increase in ductility along with a large decrease in yield and ultimate tensile strength. 10 15 Extension (mm) -A36 Annealed mA36 Hot-Rolled 20
Figure 4-2: Load-extension plot of hot-rolled A36 steel and annealed A36 steel. The plot
shows an increase in ductility (though not as large as that of 1018 steel), a slight increase in ultimate tensile strength, and no noticeable change in yield strength.
As discussed in the background section, the mechanical properties of 1018 and A36 steel change when annealed. The results from the tensile tests confirm a change in mechanical
z -o 0 _j 10
Extension (mm)
i1018 Cold-Rolled i1018 Annealed U 0 35 30 25 z 20 -o 15 0 -I 10 5 0 0 5 I __ - 1properties. For the metals tested (1018 and A36), the annealed samples showed a decrease in the yield strength and an increase in ductility. Therefore, the annealed samples became easier to deform and could elongate more than their counterparts, as a function of annealing and grain growth. Young's Modulus, a measure of the elasticity, should remain constant because it is an atomic-level property. As long as the steel maintains its body centered cubic (bcc) microstructure, the Young's Modulus will not change.
The increase in ductility is evident from the two plots, particularly on the 1018 steel which had a larger increase between fracture points than the A36 steel. The 1018 steel plot also highlights the drastic decrease in yield and ultimate tensile strength between the cold-rolled 1018 steel and the annealed one. Interestingly, the A36 hot-rolled samples had a higher yield and ultimate tensile strength than the annealed samples. This may be due to the shorter cooling cycles of the small annealed sample in the forge, compared to the very slow cooling that large rolls of hot-rolled steel go through. Thus, while any heating will soften cold-rolled steel, this may not be necessarily true for the hot-rolled steel.
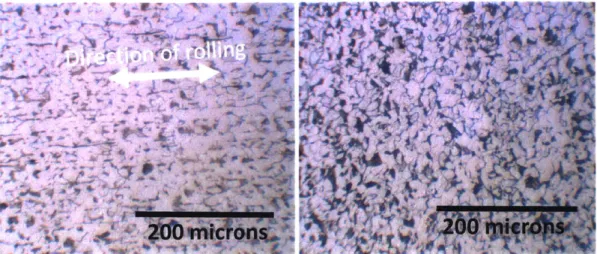
These differences make sense when considering that the original 1018 steel was cold rolled. The grain of the cold rolled steel is highly deformed, as shown on Figure 4-3 below. The picture on the left is the side view of a sample, and the right is the top view. Comparing the two, one can deduce the direction of rolling based on the deformation of the grain. The elongated grains from the side view indicate the rolling occurred in a way such that they became compressed and stretched out. Cold-rolling puts the grain in a high state of stress. When heated up to a high enough temperature, and with enough time, these stresses can be relieved, and grains can grow to be more equiaxed rather than deformed in the direction of rolling.
-mo
Figure 4-3: Images of the microstructure of an untreated 10 18 steel sample taken with an Olympus Universal Research Microscope, Model VANOX. The left image is a side view while the right one is a top view. The directional orientation of the grains on the first image, compared to the second one, indicate that this was the direction of rolling. Cold-rolling
highly deforms the grain structure and creates a high level of stress from this deformation.
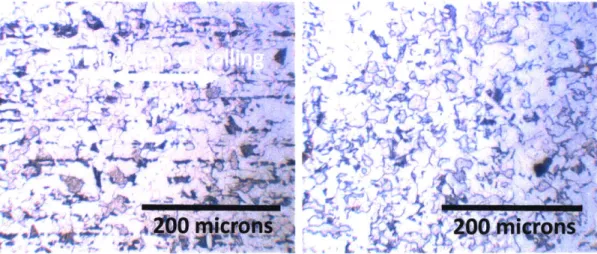
The hot-rolled A36 sample shows a different scenario. The grain structure of normal A36 is created by the metal being heated to very high temperatures during to the hot-rolling process. The difference between welding temperature and these rolling temperatures is not as big as the temperature differences when cold-rolling. As seen on Figure 4-4, these deformations of the grain structure are not as pronounced as with the 1018 steel. Nevertheless, one can still extract the direction of rolling by comparing the two images, the side and top views.
03 1E .~*4 1~.
;1P
t '.,40hie
Figure 4-4: Images of the microstructure of an untreated A36 steel sample taken with an
Olympus Universal Research Microscope, Model VANOX. Like the 1018 steel images above, the left image here is a side view and the right one is a top view. The elongation lines indicate the direction of rolling. Hot-rolling does not create as big of an internal stress through deformation in the grain structure as cold-rolling does.
These property changes are evident when comparing the calculated cold- and hot-rolled results with those of the annealed samples through tensile testing. The results are shown in Figures
4-5, 4-6, 4-7, and 4-8 below which compare the change in Young's Modulus, yield strength,
ultimate tensile strength, and fracture point in the 1018 and A36 samples. The exact number can be found on Appendix A. The results confirm a general decrease in yield strength, particularly in the 1018 steel, and increase in ductility for both metals. Although the Young's Modulus decreases between the normal and annealed samples, this is a property that should not be changing. The Young's Modulus measures the atomic bonding forces within the metal. Since the two samples remain in a bcc crystal structure, the atomic forces should remain the same.
* 1018 Cold-Rolled
I
1018 Annealed 0 A36 Hot-Rolled E A36 Annealed
I.I.
Figure 4-5: Bar graph comparing the Elastic Modulus of the cold-rolled 1018 steel, annealed 1018 steel, hot-rolled A36 steel, and annealed A36 steel. The error bars indicate the 95 % confidence interval.
a 1018 Cold-Rolled 1018 Annealed E A36 Hot-Rolled a A36 Annealed
I
I
I
Figure 4-6: Bar graph comparing the yield strength of the cold-rolled 1018 steel, annealed
1018 steel, hot-rolled A36 steel, and annealed A36 steel. The error bars indicate the 95 %
confidence interval. 350 300 CL 250 200 0 150 *Z; 100 50 0 700 600 W500 -t400 C 300 41-J 200 100 0
a 1018 Cold-Rolled I1
1018 Annealed 0 A36 Hot-Rolled m A36 Annealed
I
Figure 4-7:-Bar graph comparing the ultimate tensile strength of the cold-rolled 1018 steel,
annealed 1018 steel, hot-rolled A36 steel, and annealed A36 steel. The error bars indicate the 95 % confidence interval.
* 1018 Cold-Rolled 1018 Annealed U A36 Hot-Rolled * A36 Annealed
Figure 4-8: Bar graph comparing the fracture point of the cold-rolled 1018 steel, annealed 1018 steel, hot-rolled A36 steel, and annealed A36 steel. The error bars indicate the 95 %
confidence interval. 800 700 600 500 400 300 200 100 0 .C (V -0Ca> . 0.45 r_9 0.4 C 0.35 . 0.3 0.25 0 0.2 2 0.15 4-J 0.1 L.. L 0.05 0
The 1018 steel had the biggest differences in mechanical properties after annealing. The yield strength decreased by 45% and the fracture point increased by 216%. The samples were able to elongate on average 4% more after being heated. The A36 samples did not change as much as the 1018 ones when annealed. Also, while the yield and ultimate tensile strength of the 1018 steel samples increased when annealed, the A36 steel strengths decreased. The A36 hot-rolled samples may have had higher yield and ultimate tensile strengths due to their longer cooling cycles when processed as large rolls. The annealed samples made in the forge may have had a much shorter cooling cycle. Thus, while any heating will soften the cold-rolled steel, this may not be true for hot-rolled steel.
The wrought iron was also tested with normal flat tensile specimens. Unlike the 1018 and
A36 steels, the wrought iron was only tested annealed, because wrought iron cannot be obtained
in sheets as cold- or hot-rolled. Instead, the samples were obtained by repurposing an old piece of wrought iron which was forged down and waterjet to the appropriate tensile specimen dimensions. The tensile test load-extension plots of the three annealed metal samples (1018, A36, and wrought iron) are compared in Figure 4-9 below. From these plots, their yield strength, ultimate tensile strength, and fracture points were extracted in the same methods as above.
45 40
-35
-30 - m A36 Annealed
"5 25 - ==1018 Annealed
M 20 - --- Wrought Iron Annealed
0 - 15 -10 -5 0 0 5 10 15 20 Extension (mm)
Figure 4-9: Load-extension plot comparing the annealed alloys tested: 1018 steel, A36
steel, and wrought iron. The annealed 1018 steels had the highest yield and ultimate tensile strength, while the A36 steel had the largest fracture point. Wrought iron had the lowest strength and ductility of the three.
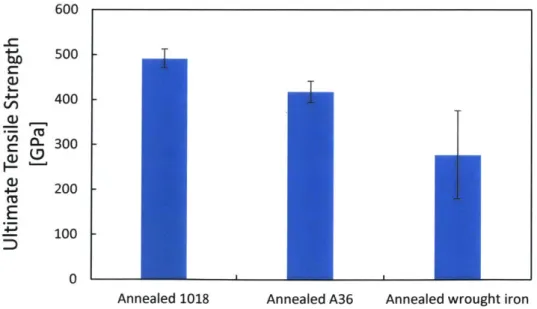
The properties of each alloy are compared on Figures 4-10, 4-11, and 4-12 below. The exact number can be found on Appendix A. As seen, wrought iron had the worst properties out of the three metals, with the lowest yield and ultimate tensile strengths and fracture point. The annealed 1018 steel had the highest strengths, and the annealed A36 had the best ductility, having the largest fracture point.
_c C 4GJ 400 350 300 250 200 150 100 50 0 T
T
I
Annealed 1018 Annealed A36 Annealed wrought iron
Figure 4-10: Bar graph comparing the yield strength of the annealed iron alloys (1018 steel, A36 steel, and wrought iron). The error bars indicate the 95 % confidence interval.
600 500 400 0- 300 200 100 0 T
I
Annealed 1018 Annealed A36 Annealed wrought iron
Figure 4-11: Bar graph comparing the ultimate tensile strength of the annealed iron alloys
(1018, A36, and wrought iron). The error bars indicate the 95 % confidence interval.
-0 C
C
E
+j-40 35 . 30 +j L 25 4_I .C 20 15- 10-L- 5-0
Annealed 1018 Annealed A36 Annealed wrought iron
Figure 4-12: Bar graph comnparing the fracture point of the annealed iron alloys (1018 steel, A36 steel, and wrought iron). The error bars indicate the 95 % confidence interval. 4.2 Alloy composition
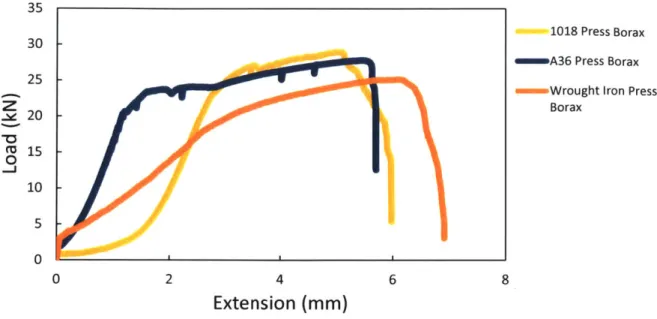
The alloy experiment takes two factors into consideration: the weld properties of each iron alloy in comparison to the others', and the extent of change in properties between the alloys' welded samples and the control samples. The strain-extension plots of a single test from each alloy are seen on Figure 4-13 for visual comparison. Looking at all three welds, the 10 18 welds are the strongest, followed by A3 6 and wrought iron. While wrought iron had the lowest yield and ultimate tensile strengths, it was the most ductile alloy, having the largest fracture point. Nevertheless, comparing the plots together, one can see that they are all relatively similar to each other. The welded alloys do not differ as drastically between each other as the annealed alloys did (shown above on Figure 4-9).
4
Extension (mm)
1018 Press Borax mA36 Press Borax
-Wrought Iron Press
Borax 8 30 25 20 15 0 10 5 0
Figure 4-13: Load-extension plot comparing the three welded alloys, made using the
hydraulic press and borax flux.
Each welded alloy was also compared to its annealed tensile specimen counterparts. The strain-extension plots of each alloy comparison are below on Figures 4-14, 4-15, and 4-16 for visual comparison. From these plots, one can easily see the superiority of the annealed samples, particularly for the 1018 and A36 steels. The load-extension plots were analyzed to extract several mechanical properties: the yield strength, the ultimate tensile strength, and the fracture point.
5 10
Extension (mm)
Figure 4-14: Load-extension plot comparing the
press and borax flux) and the 1018 annealed steel.
15
1018 Press Borax i1018 Annealed
20
welded 1018 steel (using the hydraulic
35 6 0 2 45 40 35 30 25 20 15 10 5 0 Z 0 -j 0 0 2
10
Extension (mm)
mA36 Press Borax iA36 Annealed 20 30 25 20 -o 15 0 10 5 0
Figure 4-15: Load-extension plot comparing the welded A36 steel (using the hydraulic
press and borax flux) and the A36 annealed steel.
2 4 6 8
Extension (mm) 10
Figure 4-16: Load-extension plot comparing the welded wrought
press and borax flux) and the annealed wrought iron.
-Wrought Iron Press Borax
- Wrought Iron Annealed
12
iron (using the hydraulic
Each of the calculated mechanical properties is compared among alloys below on Figures 4-17, 4-18, and 4-19. The exact number can be found on Appendix A. Both welded 1018 steel and welded A36 steel had a noticeable decrease in yield strength and a larger decrease in ultimate yield strength. These two welded alloys also had a large reduction in their fracture points compared to
35
L
15 0 5 40 35 30 25 20 15 10 5 0 i 0 -j 0---their annealed counterparts. Wrought iron had a much smaller decrease in all of these three parameters: yield strength, ultimate tensile strength, and fracture point. While this may indicate a superior weldability of wrought iron since its mechanical properties when welded are closer to those when it is not welded, its properties still remain slightly lower to those of the other two metals.
I
I
1018 " Welded " Annealed Wrought Iron A36 AlloyFigure 4-17: Bar graph comparing the yield strength of the welded and annealed iron alloys (1018 steel, A36 steel, and wrought iron). The error bars indicate the 95 %
confidence interval. 4c -0 M E 40 SI .i) 600 500 400 0- 300 200 100 0 T 1018 A36 Alloy m Welded m Annealed Wrought Iron
Figure 4-18: Bar graph comparing the ultimate tensile strength of the welded and annealed iron alloys (1018, A36, and wrought iron). The error bars indicate the 95 % confidence interval.
-I
.. " -c 400 350 300 250 200 150 100 50 040 35 M Welded -30 -N Annealed .- 25 20 0. e 15 10
I
LL-01018 A36 Wrought Iron
Alloy
Figure 4-19: Bar graph comparing the fracture point of the welded and annealed iron alloys (1018, A36, and wrought iron). The error bars indicate the 95 % confidence interval.
4.3 Welding Technique
The welding technique experiment tested both 1018 steel and A36 steel with the three technique variables: the hydraulic press, hand hammering, and the power hammer. The strain-extension plots of a single test from each technique are seen on Figure 4-20 and 4-21 for the 1018 steel and A36 steel samples respectively. From the 1018 plot, it may appear that the power hammer had the best results. Looking at the A36 plot, however, it is not so clear which forge welding technique was most effective. From these plots, the mechanical properties of each weld created through different techniques were extracted.
2 4 Extension (mm) 40 35 30 25 20 15 10 5 0 -1018 Press Borax 1018 Power Hammer i1018 Hand Hammer
8
Figure 4-20: Load-extension plot comparing the three different welding techniques
(hydraulic press, power hammer, and hand hammer) on 1018 steel using borax as flux.
2 4
Extension (mm)
Figure 4-21: Load-extension plot comparing the
(hydraulic press, power hammer, and hand hammer)
m A36 Press Borax
A36 Power Hammer mA36 Hand Hammer
8
6
three different welding techniques on A36 steel using borax as flux.
The calculated mechanical properties (yield strength, ultimate tensile strength, and fracture point) are compared below on Figures 4-22, 4-23, and 4-24. The exact number can be found on Appendix A. While the results reveal significant distinctions in weld quality between the techniques using 1018 steel, the A36 steel results had lower variations between each technique.
6 -c 0 _j 0 30 25 20 15 10 0--c 0 _j 5 0 0 I I
Nevertheless, in both cases the power hammer produced the best results with higher strength and ductility. This may result from the power hammer's powerful fast strikes which help keep the metal hot. The hand technique was the least effective. For both metals, it had the lowest strength and ductility. This may have resulted from the welder's lack of experience or inability to produce as strong blows as the other two machines. The hydraulic press results were closely behind those of the power hammer. The press also produced the most consistent results, having the lowest standard deviation. As the most controlled process, on factors such as applied pressure, pressed deformation, and pressing speed, this advantage in consistency was expected.
Cu 0~
w
-c C U) L. 4-, Lf) V a) 400 350 300 250 200 150 100 50 0Hydraulic Press Power Hammer
Technique
Hand Hammer
Figure 4-22: Bar graph comparing the yield strength of welded 1018 and A36 steel using
different forge welding techniques (hydraulic press, power hammer, and hand hammer). The error bars indicate the 95 % confidence interval.
1018 Steel
-0
600 1018 Steel 500 -0 A36 Steel 4I-JI 400 -300 -200 -E 100 --0
Hydraulic Press Power Hammer Hand Hammer
Technique
Figure 4-23: Bar graph comparing the ultimate tensile strength of welded 1018 and A36
steel using different forge welding techniques (hydraulic press, power hammer, and hand hammer). The error bars indicate the 95 % confidence interval.
25 * 1018 Steel C 20 - MA36 Steel 4-1 15 -4- 0 -5 -C 0 10
Hydraulic Press Power Hammer Hand Hammer
Technique
Figure 4-24: Bar graph comparing the fracture point of welded 1018 and A36 steel using
different forge welding techniques (hydraulic press, power hammer, and hand hammer). The error bars indicate the 95 % confidence interval.
Due to the individuality of each technique, it is difficult to quantify the effectiveness of one against the other. Experience and practice may ultimately be the most significant factor in determining which technique produces the best results. It may be possible that an experienced
blacksmith would produce more consistent results than the hydraulic press or may create stronger, more accurate blows than the power hammer.
4.4 Flux
The flux experiment tested 1018 steel using the hydraulic press and adding different fluxes before forge welding: borax, silica sand, anti-borax, and no flux. As the most popular and commonly used flux, borax was a particularly interesting variable to test, along with silica sand which is the oldest known flux to be used. The strain-extension plots of a single test from each flux sample are seen on Figure 4-25 for 1018 steel. There are interesting differences between the plots created by each flux. The three fluxes seem to have similar yield strengths, yet their fracture points vary. The silica sand plot is particularly interesting since the sample appears to mostly elastically deform with very little plastic deformation, indicating a brittle nature of the weld.
35 30 25 20 15 10 5 0 0 12 3 45 67 Extension [mm]
Figure 4-25: Load-extension plot comparing the four different flux va sand, anti-borax, and no flux) on 1018 steel using the hydraulic press.
ria
-1018 Press Borax
-1018 Press Silica
-1018 Press Anti-Borax
1018 No Flux
bles (borax, silica
The calculated mechanical properties (yield strength, ultimate tensile strength, and fracture point) are compared below on Figures 4-26, 4-27, and 4-28. The exact number can be found on Appendix A. Surprisingly, borax had a lower yield strength compared to silica sand and anti-borax. Borax did, however, have the highest ultimate tensile strength and fracture point. Anti-borax had the highest yield strength followed by silica sand. Using no flux had the worst properties; the two halves of the tensile specimen essentially did not weld.
0
I
Borax I SilicaI,
350 300 0 250 -c 200 C L_ 150 100 50 0 FluxFigure 4-26: Bar graph comparing the yield strength of welded 1018 steel using different
fluxes in the forge welding process (borax, silica sand, anti-borax, and no flux). The error bars indicate the 95 % confidence interval.
450 400 350 300 250 200 150 100 I
--T
50M M . MBorax Silica Anti-Borax No Flux
Flux
Figure 4-27: Bar graph comparing the ultimate tensile strength of welded 1018 steel using
different fluxes in the forge welding process (borax, silica sand, anti-borax, and no flux). The error bars indicate the 95 % confidence interval.
Anti-Borax No Flux -c C a) I-.e-J Li, a) U) C H-a) .I-J
E
.4-J Co 0.w
14 12 -10 - 4--L -8 06 40 U
Borax Silica Anti-Borax No Flux
Flux
Figure 4-28: Bar graph comparing the fracture point of welded 1018 steel using different
fluxes in the forge welding process (borax, silica sand, anti-borax, and no flux). The error bars indicate the 95 % confidence interval.
Despite these results, there may be other reasons why borax is preferred over silica sand or anti-borax. Anti-borax is composed of 40% metal which allows for welding at a lower temperature than normally required [12]. It is these extra metal bits that some blacksmiths dislike, since they may result in a different color or texture along the weld line. There was, however, no noticeable difference in weld lines on the samples of these experiments. Regarding silica sand, the main issue arises from the fact that the metal must be at a much higher temperature than for the other fluxes in order for the silica sand to stick. Silica sand is also more difficult to source compared to borax which can be obtained in any supermarket. Furthermore, although no flux did not weld, it is known to work and is in fact the standard for many blacksmiths. According to Mark Aspery, a professional blacksmith, forge welding without flux is "not too difficult but like most things requires practice"
[13]. The drastic differences between using flux or not may thus have been caused by the
inexperience of the welder. It does show, however, how much easier it is to achieve a quality weld when using flux.
5. Conclusion
The experiments performed discovered correlations between alloy composition, forge welding technique, and flux with the strength of welds. Specifically, the analysis found preferences of particular welding variables for alloy, technique, and flux selection. Both 1018 steel and A36 steel had lower yield strength when welded compared to their annealed counterparts. This was not true for wrought iron, whose strength did not vary significantly. Although there was a lot of variation for 1018 steel with different welding techniques, the A36 data was fairly consistent. This shows that the results of using a particular technique may be more dependent on experience and practice using that particular technique. Although borax, the most commonly used flux, did not have the highest yield strength, all three fluxes had very close strengths. The no flux samples did not effectively weld, but knowing that not using flux is common practice for some blacksmiths, this can be attributed to inexperience. A particular limitation to this study is the person performing the welding. The experience and personal preferences of the welder may greatly change the effectiveness of particular variables, especially the forge welding techniques which require practice to master. Nevertheless, this experiment challenges modem blacksmithing conventions
by providing data and analysis that reveal the benefits and drawbacks of several welding variables.
These results could prove useful to current blacksmiths, who may use these results to improve or revise their forge welding performance.
6. Bibliography
[ 1 ] Messler, Robert W. Principles of Welding: Processes, Physics, Chemistry, and Metallurgy.
Wiley-VCH, 2004.
[2] Prepared under the direction of the ASM International Handbook Committee. ASM Handbook. Volume 6, Welding, Brazing and Soldering. Selection of Carbon and Low-Alloy Steels. Influence of Welding on Steel Weldment Properties. Materials Park, Ohio :ASM International, 1996. Print.
[3] "Grade Guide: A36 Steel." Metal Supermarkets, 14 Nov. 2017,
www.metalsupermarkets.com/grade-guide-a36-steel/. [4] "The OnlineMetals Guide to Steel." OnlineMetals, www.onlinemetals.com/productguides/steelguide.cfin.
[5] "Materials 101: Hot Rolled Steel vs Cold Rolled Steel." Mid City Steel, 21 Mar. 2013, midcitysteel.com/materials-101-hot-rolled-steel-vs-cold-rolled-steel/.
[6] Aston, James, and Edward B. Story. Wrought Iron: Its Manufacture, Characteristics and Applications. A. M. Byers Company, 1939
[7] Prepared under the direction of the ASM International Handbook Committee. ASM
Handbook. Volume 6, Welding, Brazing and Soldering. Solid-State Welding, Brazing, and Soldering Processes. Forge Welding. Materials Park, Ohio :ASM International, 1996. Print.
[8] Prepared under the direction of the ASM International Handbook Committee. ASM
Handbook. Volume 6, Welding, Brazing and Soldering. Weld Procedure Qualification.
Limitations on Procedure Qualification. Materials Park, Ohio :ASM International, 1996. Print. [9] "Carbon Equivalent." Leong Huat Hardware , www.leonghuat.com/articles/carbon
equivalent.htm.
[10] Carter, Murray. Bladesmithing: Modern Application of Traditional Techniques. Krause,
2011.
[11] Prepared under the direction of the ASM International Handbook Committee. ASM
Handbook. Volume 6, Welding, Brazing and Soldering. Weld Procedure Qualification. Types of Tests. Materials Park, Ohio :ASM International, 1996. Print.
[12] "Forge Welding Fluxes." Superior Flux & Mfg. Co.,
www.superiorflux.com/forge-welding-flux/.
[13] Private communication, Mark Aspery. April 26, 2018.
7. Appendix A
Table 7-1: Tensile testing results comparing the cold- and hot-rolled mechanical
properties measured for each metal, 1018 steel and A36 steel. 95% confidence.
1018 Cold 1018 A36 Hot A36
Rolled Annealed Rolled Annealed
Young's 292 10 216 60 223 11 180 120 Modulus [MPaj Yield Strength 549 27 305 13 234.8 9.1 254 81 [MPaj Ultimate Tensile 692 11 492 21 394.0 2.2 417 24 Strength [MPa] Fracture point 13.5 1.8 29.1 5.8 28.4 0.4 33.2 4.4 [strain %]
Table 7-2: Tensile testing results comparing the mechanical properties measured for
each annealed iron alloy: 1018 steel, A3 6 steel, and wrought iron.
1018 Annealed A36 Annealed Wrought Iron
Annealed Yield Strength 304.9 5.1 254 33 193 21 [MPaj Ultimate Tensile 491.7 8.5 417.4 9.6 278 39 Strength [MPaj Fracture Point 29.1 5.8 33.2 4.4 16.3 9.9 [strain %]
Table 7-3: Tensile testing results comparing the mechanical properties measured for each
iron alloy: 1018 steel, A36 steel, and wrought iron.
1018 Press A36 Press Wrought Iron
Borax Borax Press Borax
Yield Strength 254 58 215 32 199 22 [MPa] Ultimate Tensile 315 51 287 31 266.5+4.3 Strength [MPaj Fracture point 10.0 2.9 10.2 2.4 11.81 0.99 [strain %]
Table 7-4: Tensile testing results comparing the mechanical properties measured for each
welded alloy (using the hydraulic press and borax flux) and their annealed specimen counterparts. All welded samples have lower yield strength, ultimate tensile strength, and fracture points, although 1018 steel and A36 steel have much larger decreases than wrought iron.
1018 Press 1018 A36 Press A36 Wrought Wrought
Iron Press Iron
Borax Annealed Borax Annealed
Borax Annealed Yield Strength 254 58 304.9 5.1 215 32 254 33 199 22 193 21 [MPaj Ultimate Tensile 315 51 491.7 8.5 287 31 417.4 9.6 266.5 4.3 278 39 Strength [MPaj Fracture 11.81 point 10.0 2.9 29.1 5.8 10.2 2.4 33.2 4.4 16.3 9.9 0.99 [strain %J _____ _ _ _ _ _ _ _ _ _ _ _ _ _ _ _ _ _ _ _ _ _ _ _ _ _
Table 7-5: Tensile testing results comparing the mechanical properties measured for each
welding technique on 1018 steel: hydraulic press, hand hammer, and power hammer.
1018 Steel with borax flux
Hydraulic Press Power Hammer Hand Hammer
Yield Strength [MPa] 254 58 289 74 110 111
Ultimate Tensile 315 51 420 110 210 110 Strength [MPaj Fracture point 10.0 2.9 12 11 4.3 4.2 [strain %]
Table 7-6: Tensile testing results comparing the mechanical properties measured for each
welding technique on A36 steel: hydraulic press, hand hammer, and power hammer.
A36 Steel with borax flux
Hydraulic Press Power Hammer Hand Hammer
Yield Strength [MPa] 215 32 225 16 205 26
Ultimate Tensile 287 31 289 19 264 95 Strength [MPa] Fracture point 10.2 2.4 11.9 4.2 9.7 3.8 [strain %]
Table 7-7: Tensile testing results comparing the mechanical properties measured for each flux variable on 1018 steel: borax, silica sand, anti-borax, and no flux.
Borax Silica Sand Anti-Borax No Flux
YieldStrength 254 58 257 42 278 36 15 18 [MPaj Ultimate Tensile 315 51 255 150 300 35 18 23 Strength [MPa] Fracture point 10.0 2.9 8.1 3.5 7.6 1.3 1.57 0.84 [strain %]