HAL Id: insu-00409820
https://hal-insu.archives-ouvertes.fr/insu-00409820
Submitted on 13 Aug 2009HAL is a multi-disciplinary open access archive for the deposit and dissemination of sci-entific research documents, whether they are pub-lished or not. The documents may come from teaching and research institutions in France or abroad, or from public or private research centers.
L’archive ouverte pluridisciplinaire HAL, est destinée au dépôt et à la diffusion de documents scientifiques de niveau recherche, publiés ou non, émanant des établissements d’enseignement et de recherche français ou étrangers, des laboratoires publics ou privés.
Controls on magma permeability in the volcanic conduit
during the climactic phase of the Kos Plateau Tuff
eruption (Aegean Arc)
Wim Degruyter, Olivier Bachmann, Alain Burgisser
To cite this version:
Wim Degruyter, Olivier Bachmann, Alain Burgisser. Controls on magma permeability in the volcanic conduit during the climactic phase of the Kos Plateau Tuff eruption (Aegean Arc). Bulletin of Vol-canology / Bull Volcanic Eruptions, 2010, 72, pp.63-74. �10.1007/s00445-009-0302-x�. �insu-00409820�
Controls on magma permeability in the
volcanic conduit during the climactic phase
of the Kos Plateau Tuff eruption (Aegean
Arc)
W. Degruyter a,*, O. Bachmann b, A. Burgisser c
a Section des Sciences de la Terre, Université de Genève, 13 rue des Maraîchers, 1205
Genève, Switzerland
b Department of Earth and Space Sciences, University of Washington, mailstop 351310,
Seattle, WA 98195-1310, USA
c Institut des Sciences de la Terre d’Orléans, CNRS - Université d’Orléans, 1A rue de la
Férollerie, 45071 Orléans Cedex 2, France
*Corresponding author
Email addresses: wim.degruyter@unige.ch, bachmann@u.washington.edu, burgisse@cnrs-orleans.fr,
Tel. No: +41223796660, Fax No: +41223793210 Manuscript for: Bulletin of Volcanology
Reviewed version: April 9, 2009
Abstract
We applied X-ray microtomography (µCT) to pumices from the largest quaternary explosive eruption of the active South Aegean Arc (the Kos Plateau Tuff; KPT) in order to better understand magma permeability within volcanic conduits. We selected for µCT imaging two different types of pumices (one with highly elongated bubbles, tube pumice; and the other with near spherical bubbles, frothy pumice) produced synchronously and with identical chemical composition to obtain porosity, tortuosity, bubble size and throat size distributions. We quantify how shear creates straightened paths in the direction of elongation (tortuosity drops on average from 2.2 to 1.5). Bubble size and throat size distributions provide estimates for mean bubble size (~93-98 μm) and mean throat size (~23-29 μm). Using a modified Kozeny-Carman equation, variations in porosity, tortuosity, and throat size observed in KPT pumices explain the spread found in laboratory measurements of the Darcian permeability. Measured difference in inertial permeability between tube and frothy pumices can also be partly explained by the same variables but require an additional parameter related to the internal roughness of the porous medium (friction factor f0). Constitutive equations for both types of permeability
allow the quantification of laminar and turbulent gas escape during ascent of rhyolitic magma in volcanic conduits. Keywords: µCT, pumice, permeability, tortuosity, strain, volcanic conduit, outgassing
1 Introduction
Understanding the behavior of magma ascent through volcanic conduits is paramount to predict the outcome of an eruption (Gonnermann and Manga 2007). In
will govern the transition between effusive and explosive eruptions (e.g., Eichelberger et al. 1986; Mueller et al. 2008; Namiki and Manga 2008). This process has been termed outgassing (Gonnermann and Manga 2007). Yet, exposed conduits are a rarity in the field (e.g., Stasiuk et al. 1996) and means of investigation are restricted to (a) experimental work (e.g., Burgisser and Gardner 2005; Okumura et al. 2006; Mueller et al. 2008; Namiki and Manga 2008), (b) numerical simulations (e.g., Papale 1999; Gonnermann and Manga 2003; Dufek and Bergantz 2005; Mastin 2005; Melnik et al. 2005), and (c) the study of juvenile pyroclasts, which provide the only natural record of the state of magma prior to fragmentation (e.g., Klug and Cashman 1996; Marti et al. 1999; Saar and Manga 1999; Polacci et al. 2003; Rust et al. 2003; Rosi et al. 2004; Mueller et al. 2005; Gualda and Rivers 2006; Wright et al. 2006; Bernard et al. 2007; Bouvet de Maisonneuve et al. 2008).
Using pore space reconstruction by X-ray computed microtomography (µCT), this study focuses on characterizing natural pyroclasts (pumices), produced by the well-studied Kos Plateau Tuff (KPT) eruption (Allen and Cas 1998; Allen et al. 1999; Allen 2001; Allen and Cas 2001; Allen and McPhie 2001; Bouvet de Maisonneuve et al. 2008) in order to validate constitutive equations of permeability in volcanic samples. The KPT pumices are particularly prone to such an examination because the high viscosity (rhyolitic melt composition + high crystallinity) allowed preserving information on the state of the magma immediately prior to fragmentation since such silicic pumices record the geometry of the bubble network at fragmentation (Thomas et al. 1994). Therefore, their Darcian and inertial permeability indicate the volatile outgassing efficiency of an
erupting magma in the upper part of the conduit (e.g., Eichelberger et al. 1986; Klug and Cashman 1996; Rust and Cashman 2004; Mueller et al. 2005).
The KPT pumices display macroscopic textures ranging from tubular (i.e., tube pumice) to near-spherical (i.e., frothy pumice) networks of bubbles, suggesting that the magmatic foam in different parts of the conduit was exposed to variable strain (Marti et al. 1999; Polacci et al. 2003; Rosi et al. 2004; Wright et al. 2006) during ascent. A previous study on the KPT eruption (Bouvet de Maisonneuve et al. 2008) reported highly variable permeabilities (variations over several orders of magnitude) of tube and frothy pumices for given porosities, implying that parameters other than porosity exerts a strong control on magma outgassing. Using high-resolution µCT and numerical pore space reconstruction in 3D, we were able to measure the most important geometrical parameters that control gas flow in pumices. These are: (a) connected porosity (see Fig. 3 of Gonnermann and Manga 2007 for an overview and references therein), (b) (hydraulic) tortuosity, and (c) bubble aperture or throat diameter (Saar and Manga 1999; Blower 2001; Costa 2006; Bernard et al. 2007; Bouvet de Maisonneuve et al. 2008).
2 Samples
The KPT pumices can be subdivided in four categories according to their macroscopical characteristics (Allen 2001; Bouvet de Maisonneuve et al. 2008): (1) tube pumices, (2) frothy pumices, (3) microvesicular pumices, and (4) gray-banded pumices. In this study, we focused on the tube and frothy type, which were produced synchronously (found in same pyroclastic flow units; Fig. 1 and 2) during the climactic phase of the eruption. Both tube and frothy pumices have the same rhyolitic composition and crystal volume fraction of about 24 % , and differ only in bubble morphology. The Figure 1
tube pumices are the most abundant type (90-95 vol.% of all pumices). They contain deformed bubbles that are highly elongated in the direction of clast elongation (Fig. 1a, b, c and 2). The frothy type pumices make up roughly 5-10 vol.% of the deposit and mostly have sub-spherical bubbles (Fig. 1d, e, f and 2). Such types of pumices are frequently observed in deposits of explosive caldera-forming silicic eruptions (Marti et al. 1999; Polacci et al. 2003; Polacci 2005; Wright et al. 2006).
3 Methods
3.1 X-ray computed microtomography
Cylindrical cores were drilled from large pumice clasts (10 to 15 cm longest diameter) for µCT scanning as cylinders are isotropic in the scan plane, and thus the best geometry to capture the most volume (Ketcham and Carlson 2001). For each type we took two different clasts, and drilled two cores of 5 and 15 mm in one clast and one of 5 mm in the other. The µCT scanner has an X-ray tube, which is an open type Feinfocus tube. We scanned these six cores at the UGCT Facility at the University of Ghent. We used a Rad-Eye EV CMOS flat panel detector with field of view 512 x 1024 pixels. During data acquisition, samples were rotated 360 degrees around an axis perpendicular to the incident beam. Projections were recorded at each 0.45 degree. Reconstruction, the process by which X-ray projections are converted to a stack of gray-scale images, was done using the software package Octopus developed at the UGCT Facility. The voxel (3D pixel) size of the images depends on the size of the samples and the detector used. The images of the 5 mm cores had a voxel size of ~6 µm, the ones of the 15 mm cores a voxel size of ~15 µm (Table 1).
Figure 2
3.2 3D Image analysis
Three different existing softwares were used for image analysis. The commercial software package VGstudio was used for 3D rendering of the scans (Fig. 1). To discard the edges of the scanned sample, we cropped cubes from our obtained images using ImageJ. For quantitative 3D image analysis, we used 3DMA-rock (Lindquist and Venkatarangan 1999; Oh and Lindquist 1999; Lindquist et al. 2000; Song et al. 2001; Shin et al. 2005; Prodanovic et al. 2006), and Blob3D (Ketcham 2005b, a).
Segmentation converts a gray-scale image into a binary (black and white) image.
The purpose of segmentation is to extract the object that one wants to analyze (bubble network in our case). Common practice is to choose a simple global threshold, which is often set to match a predetermined bulk measurement of porosity. However, due to the unavoidable blurring in our µCT images, a double threshold method was taken for segmentation to limit biasing in dividing the 3D volume up into bubbles and material. For these reasons, the indicator kriging method (Oh and Lindquist 1999) was compared with the seeded threshold filter (Ketcham 2005b). Once binary images are obtained, we can determine a numerical porosity (amount of white voxels divided by the total amount of voxels).
The medial axis or skeleton is a 1D representation of the bubble network constructed by erosion of the bubble network voxels, layer by layer, while preserving its topological and geometrical properties (Lindquist and Venkatarangan 1999). This reduced representation of the bubble network makes it easier to do further analysis. It allows us looking for pathways on the medial axis that connect two end faces and determine (hydraulic) tortuosity.
Separation allows dismantling partially coalesced bubbles into individual bubbles.
Separation algorithms rely on the assumption that individual bubbles are connected through a distinct waist configuration (Shin et al. 2005). 3DMA-rock’s algorithms calculate throats, which are minimal cross sectional surfaces between bubbles (Lindquist et al. 2000; Shin et al. 2005; Prodanovic et al. 2006), i.e. bubble apertures or throats. A distance label is given to each voxel on the medial axis, which is the distance to the nearest material voxel. Then the medial axis is used as a search path for local minima of the distance label. A throat is the surface joining a local minimum to the adjacent material voxels. We used the aggressive throat computation procedure since we were dealing with highly porous material (>40% porosity) which is a combination of the three throat calculating algorithms available (Prodanovic et al. 2006). This automatic method can lead to the definition of some non-physical throats (e.g., it overestimates throats in bubbles showing numerous cusps, because of the increase in minima in such a region). Blob3D on the other hand uses a more reliable, yet, more labour-intensive method by which the user manually picks the individual bubbles from bubble clusters by iteratively using erosion and dilation based on the peeling method developed in Proussevitch and Sahagian 2001 .
4 Results
4.1 Qualitative observations
The tube pumice samples 25_5mm, 34_5mm and KPT06-34_15mm shown in Fig. 1 (a,b,c) have in general the configuration of a volume stacked with capillary tubes partly bent or interrupted by crystals. They are heterogeneous in porosity and crystallinity at the scale of the 5 mm scanned samples. KPT06-25_5mm has a large crystal and a cavity, while KPT06-34_5mm has a large amount of broken crystals
making up most of the scan surrounded by the melt with stretched bubbles. The 15 mm core shows regions with pockets of broken crystals. Images for the frothy pumice, KPT06-27_5mm, KPT06-33_5mm and KPT06-33_15mm, (Fig. 1d, e, f) show a configuration of densely packed, coalesced spheres (Fig. 2).
4.2 Porosity and tortuosity
When compared to porosity measured in the lab (Bouvet de Maisonneuve et al. 2008), image porosity can be used to evaluate the quality of our images and the methods used for segmentation (either by indicator kriging with 3DMA-rock or seeded threshold filter with Blob3D; Table 1). The larger cores show lower image porosity values (tube 25-34%; frothy 60%) than the 5 mm samples (tube 40-50%; frothy 72-76%). The 5 mm samples compare better to lab porosities than the 15 mm samples especially for the frothy with a porosity only differing a few percent from the lab values. We could not see any systematic advantage between the two segmentation algorithms and we applied further analysis on the binary images obtained with indicator kriging. The 15 mm tube sample (KPT06-34_15mm) was eliminated for further analysis because of the large discrepancy between the two segmentation methods.
Measuring the length of pathways found with the medial axis and dividing it by the length between the two end faces provides the tortuosity (Table 1). In the 5 mm tube pumice (measured in the direction of elongation) tortuosity is around 1.5, while, perpendicular, values range between 1.7 and 2. The paths through the frothy type have higher tortuosity, ranging from 1.6 up to 2.8 in the 5 mm cores and no percolating paths in the y-direction of KPT06-27_5mm. Thus, the tube pumices have less convoluted
pathways than the frothy pumices, despite lower image porosity, leading to lower tortuosity (Fig. 3).
4.4 Bubble and Throat sizes
Bubble Number Densities (BND) and Bubble Size Distributions (BSD) were calculated solely for the frothy type (resolution on images for tube pumices not good enough to capture the smallest bubbles, see section 5.1). A BND of ~1011-1012 m-3 was measured relative to the melt+crystals volume, because it needs to remain constant when bubbles grow (Proussevitch et al. 2007a; Proussevitch et al. 2007b; Table 1). Next, BSDs were generated (Fig. 4) following the method described in Proussevitch et al. 2007a; Proussevitch et al. 2007b, where number density is plotted against the bubble volume using logarithmic bins (results are converted to diameter of equivalent spheres for simplicity). The plots are not strongly affected by size cut-offs and thus are the most useful for population observations. The distributions were made such that the (bubble or throat) diameter and the bin size are at least 2 voxels in size for the smallest bubbles. A histogram of the number density,fˆ , is defined as
( )
V n v V f i m i = Δ 1 ˆ , (1)Where vm is the observed total melt volume, n the number of bubbles counted in each bin i
and ΔVis the bin width. Functions were fitted using the program of Proussevitch et al. 2007a; Proussevitch et al. 2007b and the best function fit (lowest chi square value) was found with a log normal distribution fit for all the BSD’s.
The peeling method (Blob3D) was performed for comparison on KPT06-33-5mm and gives a similar result with a mean bubble diameter of 87 µm (Fig. 4a). It was more Figure 4
efficient in separating bubbles, but the BND stayed within the same order of magnitude between 1011 m-3 and 1012 m-3. Comparing the results between the 5 mm and 15 mm cores (Fig. 4b), we see that bubbles larger than 1 mm in diameter are rare. Therefore, the 5 mm cores provide a good approximation to the real distribution while the 15 mm cores overestimate the fraction of larger bubbles because the resolution is not high enough to take into account the smaller bubbles. The means of the distributions of the 5 mm cores yield diameters of equivalent spheres of 98 µm and 93 µm (Fig. 4c).
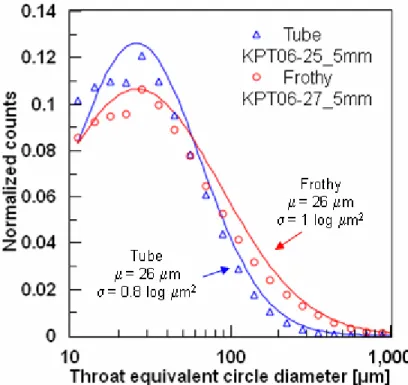
We calculated Throat Size Distribution (TSD) for both pumice types, as we are looking for minimum apertures of the flow paths. The same method as for the BSD’s was used. This allowed us to put constraints on the minimum aperture of the tubular flow paths, which we were able to use for permeability measurements (see below). Fig. 5 shows the normalized counts versus throat area for one tube sample (KPT06-25_5mm) and one frothy (KPT06-33_5mm). The TSD’s of the other samples follow closely their respective type. The tube and frothy pumice display similar TSD’s with means between 23 µm and 29 µm for the 5mm samples (Table 1).
5 Discussion
5.1 Image quality
This study complements previous studies exploring the potential of µCT to quantify textures of volcanic rocks (Song et al. 2001; Shin et al. 2005; Gualda and Rivers 2006; Okumura et al. 2006; Polacci et al. 2006; Wright et al. 2006; Gualda and Anderson 2007; Proussevitch et al. 2007a; Proussevitch et al. 2007b; Bai et al. 2008; Okumura et al. 2008; Polacci et al. 2008; Okumura et al. 2009; Polacci et al. 2009). In addition to the Figure 5
heterogeneous material (Ketcham and Carlson 2001), µCT enables us to measure geometrical features of the bubble space, such as tortuosity, which were previously inaccessible to 2D techniques. However, caution should be taken when interpreting results, as the volume-resolution trade-off can create errors Shin et al. 2005; Gualda 2006; Wright et al. 2006. The resolution of an image determines in how much detail an object can be seen. This combination of voxel size and image contrast can be assessed qualitatively by visualizing the images.
Disagreement between porosity measurements in the lab and by image analysis can be due to (a) an heterogeneous porosity at the scale of the scanned volume, which means that the scanned volume is not a representative elementary volume (REV; Bear 1972) and/or (b) an insufficient resolution unable to capture the smallest bubbles, which leads to underestimation of the image porosity. While the resolution obtained on our images is generally good enough for the frothy pumices, it is not sufficient to obtain complete characterization of the bubble network in tube pumices. We see that the images with the best qualitative observed resolution (frothy, 5 mm) are insensitive to the choice of segmentation method and compare well to the obtained lab porosities (Table 1). In contrast, numerical porosity for the lowest quality images (tube, 15 mm) is very sensitive to the segmentation method and compares poorly to the lab measurements. Images of tube pumices are more affected by the REV vs. resolution trade-off because of both the heterogeneity at the 5 mm scale and the existence of bubbles smaller than the voxel size (~6 µm). The blurriness of the images hinders segmentation efficiency, independently of the method used, and can induce losses of >30% in porosity. However, the difference between lab and numerical porosity is mainly due to loss of the smallest bubbles (<10 µm
in diameter) on the images, and important information about the flow properties in the porous medium can still be gathered on the whole bubble volume, as flowage is governed by the pathways with largest throat diameters (in a Poiseuille flow, permeability scales with throat diameter squared and mass flux with throat diameter to the 4th power). Slight disagreements between numerical and lab porosities (<10%) are also present in frothy pumices, but we believe that the loss of some pore space of the frothy pumice is mainly due to the under-sampling of the largest (> ~1 mm) bubbles.
Qualitative investigation on thin sections of the different pumice types showed that frothy has orifice shaped throats, while tube pumice has venturi shaped throats (Bouvet de Maisonneuve et al. 2008). Therefore, the throats in the frothy pumice are easily recognized as ruptured bubble walls, and yielded robust BSD’s (Fig. 4). Because of the venturi shaped throats in tube pumice, the assumption that each minimum aperture is related to the end of a bubble can not be made, and BSD’s were omitted. We conclude that KPT tube pumice does not record bubble sizes accurately, as the bubble coalescence history is largely obliterated due to the intense deformation.
5.2 Darcian and inertial permeability
Recent compilations of (Darcian) permeability-porosity (k-φ) measurements on silicic pumices display a very scattered data set (Mueller et al. 2005; Gonnermann and Manga 2007), indicating that permeability is clearly not solely a function of porosity. As previously established (Saar and Manga 1999; Blower 2001; Mueller et al. 2005; Costa 2006; Bernard et al. 2007); including in the KPT pumices (Bouvet de Maisonneuve et al. 2008), both (a) the tortuosity of degassing pathways and (b) throat size, and shape play an important role in determining permeability.
The commonly used capillary channel-based Kozeny-Carman relationship (Saar and Manga 1999; Mueller et al. 2005; Costa 2006; Wright et al. 2006; Bernard et al. 2007) combines all parameters (porosity, tortuosity, throat diameter and shape) and may provide a robust analytical expression to determine permeability in pumices
2 2 16χτ φd
k = , (2)
where χ is the cross section shape factor, and d is the throat diameter. Tortuosity τ is related to connected porosity through Archie’s law, which states that tortuosity behaves as a fractal with connected porosity (Archie 1942; Le Pennec et al. 2001; Costa 2006)
m c F =φ− and c F φ τ2 = (3) m c− = 1 2 φ τ , (4)
where F is the formation factor and m is the cementation or tortuosity factor. F is a
concept derived from electrical measurements in porous material, and it describes the effect of the porous medium geometry on the macroscopic electrical flow. Following Bernard et al. 2007, we assume that the electrical current roughly follows the hydraulic flow, and thus that the formation factor also applies to hydraulic permeability, and we set
c
φ =φ. Equation (2) thus becomes:
χ φ 16 2 d k m c = . (5)
Note that equation (5) turns into the Poiseuille flow permeability for straight circular pipes m=τ=1, and χ=2. We point out that permeability will deviate from equation (5) near the percolation threshold where it has a (φ-φcrit)m behavior and at very high
porosities (>~0.8) where it will follow a 1/(1-φc) trend (Blower 2001; Celzard and Mareche 2002; Costa 2006).
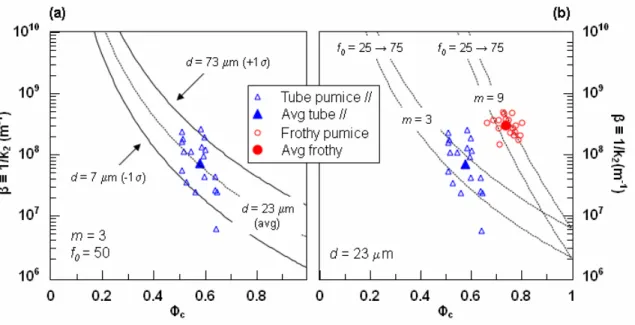
To test whether equation (5) provide a robust analytical model for pumice permeability, we used: (a) the range of connected porosity measured in the lab (Bouvet de Maisonneuve et al. 2008), (b) the tortuosity measured with our 3D image analysis, and (c) the average throat sizes measured by µCT. Table 2 shows the range of the tortuosity factor m we found through equation (4). Fig. 6 combines all the data with equation (5).
Fig 6a shows the spread within all measured tube // (parallel to elongation) and how the variation of throat size (using 1 standard deviation from the mean) can explain it for fixed
m=3 and χ=2 (i.e., assuming circular cross sections). The spread within the frothy type and tube ┴ (perpendicular to elongation) is smaller and can also be explained by throat size variations. The difference in average permeability between tube pumice // to elongation and frothy pumice is explained by variation in tortuosity (m, Fig. 6b) for fixed
d=23µm and χ=2, while the difference in average permeability between tube ┴ and the other types requires a combination of m and throat shape χ. A change in throat shape from circular to ellipse shape due to stretching of throats ┴ to elongation influences χ as follows (Mortensen et al. 2005; Costa 2006) tube ┴
⎟⎟ ⎠ ⎞ ⎜⎜ ⎝ ⎛ + = 22 22 r l l r χ , (6)
with l the throat major axis and r the equivalent circle radius. This can make the
permeability drop dramatically (Fig. 6c). Figure 6
Permeability of tube pumice // to elongation and frothy pumice, which dominates magma outgassing (tube ┴ are 10-50 times less permeable), are well described by equation (5) for circular throats
32 2 d k m c φ = , (7)
using measured porosities, throat sizes and tortuosities. This equation improves on previous attempts to model permeability in natural volcanic samples (Klug and Cashman 1996; Saar and Manga 1999; Blower 2001; Mueller et al. 2005; Costa 2006) as it does not contain any fitting parameters, and can be used directly as a constitutive equation in conduit models.
The permeable outgassing can become turbulent in the upper part of the volcanic conduit (Yoshida and Koyaguchi 1999; Rust and Cashman 2004) and Darcy’s law has to be extended to Forchheimer’s law (Rust and Cashman 2004). Therefore, a second material parameter, the inertial permeability k2 or its reciprocal, the beta factor, β, is
introduced 2 2 v k v k L P = μ + ρ Δ . (8) For straight pipes:
2 0 2 2 1 φ β d f k ≡ = , (9)
with f0 being an empirical derived constant related to surface roughness (e.g., Mastin and
Ghiorso 2000). The inertial permeability is also a function of tortuosity (Ruth and Ma 1990 + Table 1, Rust and Cashman 2004). Therefore, we introduce the tortuosity in (8), equivalent to the development of Carman 1937 for the Darcian permeability, i.e. (a) the
macroscopic velocity is adjusted with a factor of τ, and (b) the pressure gradient is adjusted with a factor 1/τ. As a result the Darcian permeability has to be adjusted with a factor of τ2 (see equation (2)). The inertial permeability changes with a factor of τ3, giving
2 3 0 2 2 1 c d f k φ τ β ≡ = , (10)
and becomes together with Archie’s law (4)
2 3 1 0 2 2 1 m c d f k = + ≡ φ β . (11)
Using equation (11) with average throat diameter and tortuosity factors determined on the KPT pumices (Fig. 7a and b), we fitted the inertial permeability data determined on tube // and frothy pumices (Bouvet de Maisonneuve et al. 2008). This provides a rough estimate for the friction coefficient f0 ~25-75.
Using equations (7) and (11), would it be possible to calculate a dynamic Darcian and inertial permeability in conduit flow models? Both the porosity and the average throat diameter can be obtained by using bubble growth models (e.g., Proussevitch and Sahagian 1998). Throat sizes can be estimated by knowing the bubble sizes from the throat-bubble ratio that is roughly estimated to be between 0.1 and 0.2 (Saar and Manga 1999, and our results). In order to track dynamic permeability using a conduit flow model, an expression relating the tortuosity τ to applied strain ε in the conduit must also
be derived (see, e.g., Scholes et al. 2007).
Volcanological implications
The presence of spherical (frothy) and elongated (tube) bubbles in pumices erupted synchronously during magma ascent records zones with respectively low and Figure 7
et al. 2003; Bouvet de Maisonneuve et al. 2008). As a result of higher (darcian and inertial) permeability in the direction of elongation, magma outgassing will be more efficient in strongly sheared areas (Okumura et al. 2009). Although it has been suggested that very high strain rates can lead to magma fragmentation by brittle fracturing (Dingwell 1996; Papale 1999; Gonnermann and Manga 2003) the buffering effects of (a) viscous dissipation (Polacci et al. 2001; Mastin 2005), (2) lower mixture viscosity (Llewellin and Manga 2005), (3) enhanced coalescence and permeability (Okumura et al. 2006; Okumura et al. 2009) may prevent brittle fragmentation from occurring.
6 Concluding
remarks
µCT emerges as a powerful tool to obtain quantitative measurements of the geometry of bubble networks inside pumices (e.g., Shin et al. 2005; Okumura et al. 2006; Prodanovic et al. 2006; Wright et al. 2006). We took full advantage of the 3D information by measuring porosity and averages for tortuosity, bubble and throat sizes, which control permeability, a key parameter in eruption dynamics.
To increase our understanding on the synchronous production of different types of pumices (e.g., Polacci 2005), 2D conduit models will be needed to determine the presence and effects of co-existing high and low strain rate zones (Ramos 1999; Dufek and Bergantz 2005). We provide constitutive equations (7) and (11) to calculate dynamic Darcian and inertial permeability in such models.
ACKNOWLEDGMENTS. This project was supported by the Swiss NSF grant
#200021-111709/1 to WD and OB. WD greatly acknowledges the UGCT team at the University of Ghent (B. Masschaele, V. Cnudde, J. Vlassenbroeck, M. Dierick and L. Van Hoorebeke) and kindly thanks B. Lindquist, R. Ketcham and A. Proussevitch for the
use of their respective softwares and quick response to questions. We are grateful for constructive comments from two anonymous reviewers.
References
Allen SR, Cas RAF (1998) Rhyolitic fallout and pyroclastic density current deposits from a phreatoplinian eruption in the eastern Aegean Sea, Greece. J Volcanol Geotherm Res 86:219-251. doi:
Allen SR, Stadlbauer E, Keller J (1999) Stratigraphy of the Kos Plateau Tuff: product of a major Quaternary explosive rhyolitic eruption in the eastern Aegean, Greece. International Journal of Earth Sciences 88(1):132-156. doi:
Allen SR (2001) Reconstruction of a major caldera-forming eruption from pyroclastic deposit characteristics: Kos Plateau Tuff, eastern Aegean Sea. J Volcanol Geotherm Res 105(1-2):141-162. doi:
Allen SR, Cas RAF (2001) Transport of pyroclastic flows across the sea during the explosive, rhyolitic eruption of the Kos Plateau Tuff, Greece. Bull Volcanol 62(6-7):441-456. doi: 10.1007/s004450000107
Allen SR, McPhie J (2001) Syn-eruptive chaotic breccia on Kos, Greece, associated with an energetic pyroclastic flow. Bull Volcanol 63(6):421-432. doi: 10.1007/s004450100162 Archie GE (1942) The electrical resistivity log as an aid in determining some reservoir characteristics. Trans Am Inst Mineral Meteorol 146:54-62. doi:
Bai L, Baker DR, Rivers M (2008) Experimental study of bubble growth in Stromboli basalt melts at 1 atm. Earth Planet Sci Lett 267(3-4):533-547. doi: 10.1016/j.epsl.2007.11.063
Bear J (1972) Dynamics of fluids in porous media. Dover, New York
Bernard ML, Zamora M, Geraud Y, Boudon G (2007) Transport properties of pyroclastic rocks from Montagne Pelee volcano (Martinique, Lesser Antilles). J Geophys Res 112:B05205. doi: 10.1029/2006JB004385
Blower JD (2001) Factors controlling permeability-porosity relationships in magma. Bull Volcanol 63(7):497-504. doi: 10.1007/s004450100172
Bouvet de Maisonneuve C, Bachmann O, Burgisser A (2008) Characterization of juvenile pyroclasts from the Kos Plateau Tuff (Aegean Arc): insights into the eruptive dynamics of a rhyolitic caldera-forming eruption. Bull Volcanol. doi: 10.1007/s00445-008-0250-x Burgisser A, Gardner JE (2005) Experimental constraints on degassing and permeability in volcanic conduit flow. Bull Volcanol 67(1):42-56. doi: 10.1007/s00445-004-0359-5 Carman PC (1937) Fluid flow through a granular bed. Trans Inst Chem Eng London 15:150-156. doi:
Celzard A, Mareche JF (2002) Fluid flow in highly porous anisotropic graphites. J Phys Condens Matter 14(6):1119-1129. doi:
Costa A (2006) Permeability-porosity relationship: A reexamination of the Kozeny-Carman equation based on a fractal pore-space geometry assumption. Geophysical Research Letters 33(2):L02318. doi: 10.1029/2005GL025134
Dingwell DB (1996) Volcanic dilemma: Flow or blow? Science 273(5278):1054-1055. doi:
Dufek J, Bergantz GW (2005) Transient two-dimensional dynamics in the upper conduit of a rhyolitic eruption: A comparison of closure models for the granular stress. J Volcanol Geotherm Res 143(1-3):113-132. doi: 10.1016/j.jvolgeores.2004.09.013
Eichelberger JC, Carrigan CR, Westrich HR, Price RH (1986) Non-explosive silicic volcanism. Nature 323:598-602. doi:
Gonnermann HM, Manga M (2003) Explosive volcanism may not be an inevitable consequence of magma fragmentation. Nature 426(6965):432-435. doi:
Gonnermann HM, Manga M (2007) The fluid mechanics inside a volcano. Annu Rev Fluid Mech 39:321-356. doi: 10.1146/annurev.fluid.39.050905.110207
Gualda GAR (2006) Crystal size distributions derived from 3D datasets: Sample size versus uncertainties. J Petrol 47(6):1245-1254. doi: 10.1093/petrology/egl010
Gualda GAR, Rivers M (2006) Quantitative 3D petrography using X-ray tomography: Application to Bishop Tuff pumice clasts. J Volcanol Geotherm Res 154(1-2):48-62. doi: 10.1016/j.jvolgeores.2005.09.019
Gualda GAR, Anderson AT (2007) Magnetite scavenging and the buoyancy of bubbles in magmas. Part 1: Discovery of a pre-eruptive bubble in Bishop rhyolite. Contrib Mineral Petrol 153(6):733-742. doi: 10.1007/s00410-006-0173-5
Ketcham RA, Carlson WD (2001) Acquisition, optimization and interpretation of X-ray computed tomographic imagery: applications to the geosciences. Comput Geosci 27(4):381-400. doi:
Ketcham RA (2005a) Three-dimensional grain fabric measurements using high-resolution X-ray computed tomography. Journal of Structural Geology 27(7):1217-1228. doi: 10.1016/j.jsg.2005.02.006
Ketcham RA (2005b) Computational methods for quantitative analysis of three-dimensional features in geological specimens. Geosphere 1(32-41). doi: doi: 10.1130/GES00001.1
Klug C, Cashman KV (1996) Permeability development in vesiculating magmas: Implications for fragmentation. Bull Volcanol 58(2-3):87-100. doi:
Le Pennec JL, Hermitte D, Dana I, Pezard P, Coulon C, Cocheme JJ, Mulyadi E, Ollagnier F, Revest C (2001) Electrical conductivity and pore-space topology of Merapi lavas: implications for the degassing of porphyritic andesite magmas. Geophysical Research Letters 28(22):4283-4286. doi:
Lindquist WB, Venkatarangan A (1999) Investigating 3D geometry of porous media from high resolution images. Phys Chem Earth Part A 24(7):593-599. doi:
Lindquist WB, Venkatarangan A, Dunsmuir J, Wong TF (2000) Pore and throat size distributions measured from synchrotron X-ray tomographic images of Fontainebleau sandstones. J Geophys Res 105(B9):21509-21527. doi:
Llewellin EW, Manga A (2005) Bubble suspension rheology and implications for conduit flow. J Volcanol Geotherm Res 143(1-3):205-217. doi: 10.1016/j.jvolgeores.2004.09.018 Marti J, Soriano C, Dingwell DB (1999) Tube pumices as strain markers of the ductile-brittle transition during magma fragmentation. Nature 402(6762):650-653. doi:
Mastin LG, Ghiorso MS (2000) A numerical program for steady-state flow of magma-gas mixtures through vertical eruptive conduits. U.S. Geological Survey Open-File Rep, 00-209, pp 55
Mastin LG (2005) The controlling effect of viscous dissipation on magma flow in silicic conduits. J Volcanol Geotherm Res 143(1-3):17-28. doi:
Melnik O, Barmin AA, Sparks RSJ (2005) Dynamics of magma flow inside volcanic conduits with bubble overpressure buildup and gas loss through permeable magma. J Volcanol Geotherm Res 143(1-3):53-68. doi: 10.1016/j.jvolgeores.2004.09.010
Mortensen NA, Okkels F, Bruus H (2005) Reexamination of Hagen-Poiseuille flow: Shape dependence of the hydraulic resistance in microchannels. Physical Review E 71(5). doi: 10.1103/PhysRevE.71.057301
Mueller S, Melnik O, Spieler O, Scheu B, Dingwell DB (2005) Permeability and degassing of dome lavas undergoing rapid decompression: An experimental determination. Bull Volcanol 67(6):526-538. doi: 10.1007/s00445-004-0392-4
Mueller S, Scheu B, Spieler O, Dingwell DB (2008) Permeability control on magma fragmentation. Geology 36(5):399-402. doi: 10.1130/G24605A.1
Namiki A, Manga M (2008) Transition between fragmentation and permeable outgassing of low viscosity magmas. J Volcanol Geotherm Res 169(1-2):48-60. doi: 10.1016/j.jvolgeores.2007.07.020
Oh W, Lindquist WB (1999) Image thresholding by indicator kriging. Ieee Transactions on Pattern Analysis and Machine Intelligence 21(7):590-602. doi:
Okumura S, Nakamura M, Tsuchiyama A (2006) Shear-induced bubble coalescence in rhyolitic melts with low vesicularity. Geophysical Research Letters 33(20):L20316. doi: 10.1029/2006GL027347
Okumura S, Nakamura M, Tsuchiyama A, Nakano T, Uesugi K (2008) Evolution of bubble microstructure in sheared rhyolite: Formation of a channel-like bubble network. J Geophys Res 113:B07208. doi: 10.1029/2007JB005362
Okumura S, Nakamura M, Takeuchi S, Tsuchiyama A, Nakano T, Uesugi K (2009) Magma deformation may induce non-explosive volcanism via degassing through bubble networks. Earth Planet Sci Lett. doi: 10.1016/j.epsl.2009.02.036
Papale P (1999) Strain-induced magma fragmentation in explosive eruptions. Nature 397:425-428. doi:
Polacci M, Papale P, Rosi M (2001) Textural heterogeneities in pumices from the climactic eruption of Mount Pinatubo, 15 June 1991, and implications for magma ascent dynamics. Bull Volcanol 63(2-3):83-97. doi: 10.1007/s004450000123
Polacci M, Pioli L, Rosi M (2003) The Plinian phase of the Campanian Ignimbrite eruption (Phlegrean Fields, Italy): evidence from density measurements and textural characterization of pumice. Bull Volcanol 65(6):418-432. doi: 10.1007/s00445-002-0268-4
Polacci M (2005) Constraining the dynamics of volcanic eruptions by characterization of pumice textures. Ann Geophys 48(4-5):731-738. doi:
Polacci M, Baker DR, Mancini L, Tromba G, Zanini F (2006) Three-dimensional investigation of volcanic textures by X-ray microtomography and implications for conduit processes. Geophysical Research Letters 33(13):L13312. doi: 10.1029/2006GL026241
Polacci M, Baker DR, Bai LP, Mancini L (2008) Large vesicles record pathways of degassing at basaltic volcanoes. Bull Volcanol 70(9):1023-1029. doi: 10.1007/s00445-007-0184-8
Polacci M, Baker DR, Mancini L, Favretto S, Hill RJ (2009) Vesiculation in magmas from Stromboli and implications for normal Strombolian activity and paroxysmal explosions in basaltic systems. J Geophys Res 114:B01206. doi: 10.1029/2008JB005672 Prodanovic M, Lindquist WB, Seright RS (2006) Porous structure and fluid partitioning in polyethylene cores from 3D X-ray microtomographic imaging. J Colloid Interface Sci 298(1):282-297. doi: 10.1016/j.jcis.2005.11.053
Proussevitch AA, Sahagian DL (1998) Dynamics and energetics of bubble growth in magmas: Analytical formulation and numerical modeling. J Geophys Res 103(B8):18223-18251. doi:
Proussevitch AA, Sahagian DL (2001) Recognition and separation of discrete objects within complex 3D voxelized structures. Comput Geosci 27(4):441-454. doi:
Proussevitch AA, Sahagian DL, Carlson WD (2007a) Statistical analysis of bubble and crystal size distributions: Application to colorado plateau basalts. J Volcanol Geotherm Res 164(3):112-126. doi: 10.1016/j.jvolgeores.2007.04.007
Proussevitch AA, Sahagian DL, Tsentalovich EP (2007b) Statistical analysis of bubble and crystal size distributions: Formulations and procedures. J Volcanol Geotherm Res 164(3):95-111. doi: 10.1016/j.jvolgeores.2007.04.006
Ramos JI (1999) Two-dimensional simulations of magma ascent in volcanic conduits. Int J Numer Meth Fluids 29:765-789. doi:
Rosi M, Landi P, Polacci M, Di Muro A, Zandomeneghi D (2004) Role of conduit shear on ascent of the crystal-rich magma feeding the 800-year-BP Plinian eruption of Quilotoa Volcano (Ecuador). Bull Volcanol 66(4):307-321. doi: 10.1007/s00445-003-0312-z Rust AC, Manga M, Cashman KV (2003) Determining flow type, shear rate and shear stress in magmas from bubble shapes and orientations. J Volcanol Geotherm Res 122(1-2):111-132. doi:
Rust AC, Cashman KV (2004) Permeability of vesicular silicic magma: inertial and hysteresis effects. Earth Planet Sci Lett 228(1-2):93-107. doi: 10.1016/j.epsl.2004.09.025 Ruth D, Ma H (1990) On the derivation of the Forchheimer equation by means of the averaging theorem. Transp Porous Med 7(3):255-264. doi:
Saar MO, Manga M (1999) Permeability-porosity relationship in vesicular basalts. Geophysical Research Letters 26(1):111-114. doi:
Scholes ON, Clayton SA, Hoadley AFA, Tiu C (2007) Permeability anisotropy due to consolidation of compressible porous media. Transp Porous Med 68(3):365-387. doi: 10.1007/s11242-006-9048-5
Shin H, Lindquist WB, Sahagian DL, Song S-R (2005) Analysis of the vesicular structure of basalts. Comput Geosci 31(4):473-487. doi: 10.1016/j.cageo.2004.10.013
Song SR, Jones KW, Lindquist WB, Dowd BA, Sahagian DL (2001) Synchrotron X-ray computed microtomography: studies on vesiculated basaltic rocks. Bull Volcanol 63(4):252-263. doi: 10.1007/s004450100141
Stasiuk MV, Barclay J, Caroll MR, Jaupart C, Ratté JC, Sparks RSJ, Tait SR (1996) Degassing during magma ascent in the Mule Creek vent (USA). Bull Volcanol 58:117-130. doi:
Thomas N, Jaupart C, Vergniolle S (1994) On the vesicularity of pumice. J Geophys Res 99 (B8):15633-15644. doi:
Wright HMN, Roberts JJ, Cashman KV (2006) Permeability of anisotropic tube pumice: Model calculations and measurements. Geophysical Research Letters 33:L17316. doi: 10.1029/2006GL027224
Yoshida S, Koyaguchi T (1999) A new regime of volcanic eruption due to the relative motion between liquid and gas. J Volcanol Geotherm Res 89(1-4):303-315. doi:
Figures
Fig. 1: Volume renderings of the six investigated samples: (a,b,c) being tube pumice and
(d,e,f) frothy pumice; (a) KPT06-25_5mm, large cavity and large crystal present, (b) KPT06-34_5mm, abundant broken crystals, (c) KPT06-34_15mm, features blurred, (d) KPT06-27_5mm, (e) KPT06-33_5mm, (f) KPT06-33_15mm.
Fig. 2: Surface visualization of connected bubble networks using Blob3D. The two
pumice types can clearly be distinguished by their respective bubble network morphology.
Fig. 3: Visualization of connected paths of a tube type in the direction of elongation
(KPT06-25_5mm) and a frothy type (KPT06-33_5mm). There are more connected paths in the tube, which are less convoluted than the ones in the frothy pumice. Note that paths can partly overlap.
Fig. 4: Bubble size distributions
with a function fit, using (Proussevitch and Sahagian, 2007a). Number density is plotted versus equivalent sphere diameter of the bubbles in a log-log plot. The log normal distributions that best fit the data are plotted as lines, and there parameters are marked in the plots. (a) The two different separation methods (pore/throat separation, 3DMA-rock and peeling method, Blob3D) where tested and compared on KPT06-33_5mm. (b) Comparison between the BSD’s of the 5mm and 15 mm core of KPT06-33 from pore-throat network data. The data for the 15 mm sample shows that there aren’t many bubbles with size larger than 1000 µm and thus showing we have a very accurate BSD for the 5 mm samples since we capture most of the porosity for this sample. (c) The BSD’s of KPT06-33_5mm and KPT06-27_5mm.
Fig. 5: Throat size distributions on 5 mm samples. Normalized counts are plotted against
the equivalent circle diameter of the throats in a semi-log plot. The best fite log normal distributions are plotted as lines, and there parameters marked in the plots. The TSD of the tubes is less spread out and has about the same mean as the frothy. The other 5 mm samples showed similar results.
Fig. 6: (Darcian) permeability model, equation (7), is compared to lab data (Bouvet de
Maisonneuve et al. 2008) and the influence of the following parameters is investigated. (a) Throat size variation, (b) tortuosity factor variation (c) throat shape variation. (d) Qualitative overview of permeability model. On average, non-sheared magma (frothy) maintains a high m value, while sheared magma lets this factor evolve to a lower value in the direction of elongation (tube //) with m=1 being the limit for straight paths. The permeability of tube ┴ can drop significantly by a combination of effects.
Fig. 7: Inertial permeability model, equation (11), compared with lab data (Bouvet de
Maisonneuve et al. 2008) with variable throat sizes (a) and variable m for f0 between 25
Tables:
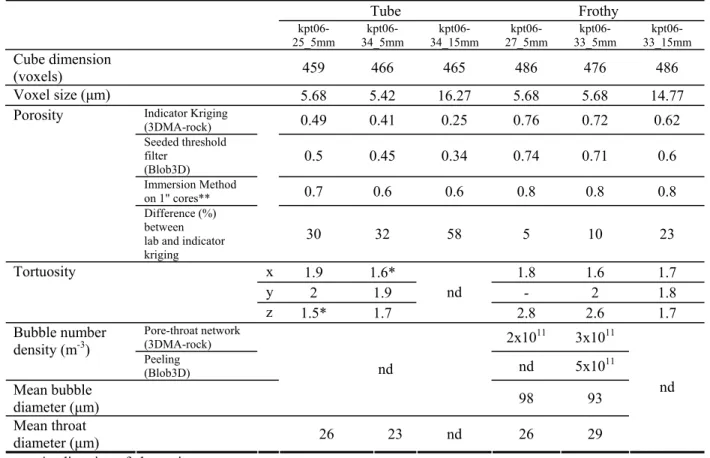
Table 1: Summary of quantitative measurements performed on the 3D images.
Tube Frothy kpt06- 25_5mm 34_5mm kpt06- 34_15mm kpt06- 27_5mm kpt06- 33_5mm kpt06- 33_15mm kpt06- Cube dimension (voxels) 459 466 465 486 476 486 Voxel size (μm) 5.68 5.42 16.27 5.68 5.68 14.77 Indicator Kriging (3DMA-rock) 0.49 0.41 0.25 0.76 0.72 0.62 Seeded threshold filter (Blob3D) 0.5 0.45 0.34 0.74 0.71 0.6 Immersion Method on 1" cores** 0.7 0.6 0.6 0.8 0.8 0.8 Porosity Difference (%) between lab and indicator kriging 30 32 58 5 10 23 x 1.9 1.6* 1.8 1.6 1.7 y 2 1.9 - 2 1.8 Tortuosity z 1.5* 1.7 nd 2.8 2.6 1.7 Pore-throat network (3DMA-rock) 2x10¹¹ 3x10¹¹ Bubble number density (m-3) Peeling (Blob3D) nd 5x10¹¹ Mean bubble diameter (μm) nd 98 93 Mean throat diameter (μm) 26 23 nd 26 29 nd *= direction of elongation
**= Bouvet de Maisonneuve et al. 2008 nd= not determined
Table 2: Estimates for the tortuosity factor m using equation (4) by combining our data
with lab data from Bouvet de Maisonneuve et al. (2008).
Tube // Tube ┴ Frothy
Connected porosity φc 0.49-0.68 0.63-0.81
Tortuosity τ 1.4-1.6 1.7-2 1.6-2.8