HAL Id: hal-03194509
https://hal.archives-ouvertes.fr/hal-03194509
Submitted on 9 Apr 2021HAL is a multi-disciplinary open access archive for the deposit and dissemination of sci-entific research documents, whether they are pub-lished or not. The documents may come from teaching and research institutions in France or abroad, or from public or private research centers.
L’archive ouverte pluridisciplinaire HAL, est destinée au dépôt et à la diffusion de documents scientifiques de niveau recherche, publiés ou non, émanant des établissements d’enseignement et de recherche français ou étrangers, des laboratoires publics ou privés.
To cite this version:
Christine Vauthier, Peter Lindner, Bernard Cabane. Configuration of bovine serum albumin adsorbed on polymer particles with grafted dextran corona. Colloids and Surfaces B: Biointerfaces, Elsevier, 2009, 69 (2), pp.207 - 215. �10.1016/j.colsurfb.2008.11.017�. �hal-03194509�
1
Configuration of Bovine Serum Albumin adsorbed on
polymer particles with grafted dextran coronas
Christine VAUTHIER
1,2, P. LINDNER
3, Bernard CABANE
4.
1. CNRS, UMR 8612, F-Chatenay-Malabry 92296 2. Univ. Paris Sud, F-Chatenay-Malabry 92296 3. ILL, BP 156, 38042 Grenoble Cedex, France
4. PMMH, CNRS UMR 7636, ESPCI, 10 Rue Vauquelin, 75231 Paris Cedex 05, France
Published in:
Colloids Surf B Biointerfaces. 2009;69(2):207-15. Available on https://doi.org/10.1016/j.colsurfb.2008.11.017Corresponding author
Christine VAUTHIER, Laboratoire de Physicochimie, Pharmacotechnie et Biopharmacie, CNRS UMR 8612, Univ. Paris-Sud, 92296 Chatenay-Malabry Cedex, France
E-mail : [email protected], Fax 33 1 46 61 93 34
Abstract
The configuration of BSA macromolecules adsorbed on the surfaces of poly(alkylcyanoacrylate) nanoparticles has been determined using Small Angle Neutron Scattering (SANS). The nanoparticles were made by anionic emulsion polymerization and self‐assembly of dextran ‐ poly(isobutylcyanoacrylate) (PIBCA) copolymers. They have a hydrophobic PIBCA core and a hydrophilic dextran corona. In vivo, they are recognized by the macrophages of the mononuclear phagocyte system. The amount of BSA bound to the particles, at adsorption equilibrium, has been determined through immunodiffusion, immunoelectrophoresis, and SANS. For particles with a diameter of 25.3 nm, the adsorption was found to saturate at 64 adsorbed BSA molecules per particle. The configuration of the adsorbed BSA molecules was determined from the SANS scattering curves, first at full contrast, and then at contrast match. Both experiments indicate that the BSA molecules are adsorbed on the PIBCA core, in a flat configuration. This result may be important for understanding the in vivo opsonisation mechanisms of nanoparticles and their resulting biodistribution.
Key words: Small Angle Neutron Scattering, Nanoparticles, Bovine Serum Albumin adsorption, dextran corona.
2
INTRODUCTION
In vivo, adsorption of proteins is generally the first event that occurs when foreign material enters biological fluids [1-6]. This initial phenomenon, named “opsonization”, is one of the most important biological barriers controlling the fate of drug carriers such as nanoparticles after intravenous injection [7-11]. The induced biological response depends on the type, amount and presentation of adsorbed proteins which define a new biological identity of the biomaterial. For instance, it has been reported that nanoparticles with a high protein binding capacity induce a strong activation of the complement system that causes them to be recognized by the mononuclear phagocyte system. Consequently, these nanoparticles are rapidly taken up by the macrophages, removed from the blood stream and accumulated in the liver and the spleen. Conversely, nanoparticles with low protein binding capacity are weak activators of the complement system and remain in the blood stream for longer times [10,12-19]. To achieve a better control of the in vivo fate of drug carriers and to improve their specificity towards targeting cells, a strategy based on differential protein adsorption was recently proposed. It consists in promoting the adsorption, on nanoparticle surfaces, of selected blood proteins that may be recognized by the targeting cells [7,20]. For instance, nanoparticles that are able to bind apolipoprotein E were reported to accumulate in the brain thanks to a capture by endothelial cells via the LDL receptor [7,21, 22].
However, the biodistribution of nanoparticles may depend on other factors besides the types and amounts of adsorbed proteins. Indeed, the configurations of adsorbed proteins at the nanoparticle surfaces may also determine the activation of various immune responses. Consequently, the extension of this strategy to a wide range of biological targets requires that the nanoparticle surfaces should be engineered in such a way that they will perfectly control the types, the amounts and the configurations of adsorbed proteins. The first step toward this ambitious goal is to gain some understanding on how blood proteins interact with the surfaces of nanoparticles that are actually developed for clinical applications as drug carriers: what are the locations and the configurations of these adsorbed proteins, and how do they depend on the type of protein and on the nature of the nanoparticle surface layer?
3 In this challenge, one of the main difficulties is to obtain high resolution structural data in conditions that are close to the conditions that occur in vivo. In the literature, there are a number of interesting works that go part of the way toward this goal [6,23-26]. Current limitations are the structural resolution of the technique, or the fact that the technique requires dehydration or freezing, or else the fact that it has been applied only to non biodegradable nanoparticles that cannot be used as drug carriers.
In the present work, we present the use of small angle neutron scattering (SANS) as a structural method to investigate the configuration of a model protein, bovine serum albumin (BSA), adsorbed on the surface of poly(isobutylcyanoacrylate) (PIBCA) nanoparticles. We chose BSA as a model protein because it is one of the most prevalent blood proteins, because it adsorbs strongly on many surfaces and because it is well characterized in solution, including by neutron scattering techniques [27]. We have also chosen BSA because it is present in serum at the highest concentration and may be one of the first proteins involved in the definition of the new biological identity of the nanoparticle surface. We chose PIBCA nanoparticles because they have been extensively characterized for their potential as drug carriers [28-31]. These nanoparticles are known to strongly activate the complement system and to be recognized by the macrophages of the mononuclear phagocyte system after intravenous administration. Thus, in addition for their unquestionable interest as drug carriers, quite a lot of data about their surface properties have been accumulated to make these nanoparticles a relevant system to investigate protein adsorption phenomena in detail. Furthermore, PIBCA nanoparticles are currently evaluated in clinical studies as carriers for an anticancer drug in treatment of patients suffering from hepatocellular carcinoma [32].
The structural problem is as follows. PIBCA nanoparticles are formed by self-assembly of a comb copolymer included 21 chains of PIBCA (Mn = 3770, Mw = 7230) grafted on a dextran molecule (Mw=56 000 g/mol) [33]. The structure of the nanoparticles shows a core of PIBCA surrounded by dextran chains arranged as loops and trains at the nanoparticle surface [34,35]. Hence there are different possible locations and configurations for the nanoparticles: (i) they may be fully adsorbed on the core, in a flat configuration, or (ii), bound to the core only through their edges or extremities, or else, (iii) bound to PIBCA chains that would protrude slightly from the core. The problem can be simplified to some extent by considering that the
4 particles are spherical, with a narrow distribution of sizes and a smooth surface (Figure 1). With this approximation, they can be described as spherical objects made of concentric shells. Then SANS can be used to compare the radii and contents of the successive shells in particles without or with adsorbed BSA. In the following, we show how this information can be used to discriminate between configurations (i), (ii) and (iii).
Figure 1: Scanning electron micrograph of the AEP nanoparticles produced through anionic emulsion polymerization. Scale bar = 100 nm.
MATERIALS AND METHODS.
Materials
The monomer, isobutylcyanoacrylate (IBCA), was kindly provided as a gift by Henkel Biomedical (Dublin, Ireland). Dextran 66 900 g/mol and bovine serum albumin (BSA), were purchased from Sigma (Saint-Quentin Fallavier, France). TRIS (SIGMA 7-9), sodium chloride and potassium chloride from Sigma (Saint-Quentin Fallavier, France), Tricine from Acros Organics (Geel, Belgium), Calcium lactate, Na2HPO4 and NaH2PO4 from Fisher Scientific (Illkirch, France) were used to prepare buffers for the determination of protein adsorption through immunochemical methods. All solutions were prepared with Milli-Q® water (Millipore, Molsheim, France).
Anti-bovine serum albumin antibodies from rabbits were purchased from Sigma (Saint-Quentin Fallavier, France). After reconstitution following the instructions provided by the supplier, the protein concentration was 15 mg/mL and the antibody title was 1:32 versus 1mg/mL of BSA as determined by the Ouchterlony double diffusion assay.
5
Methods.
Preparation of the nanoparticles
Poly(isobutylcyanoacrylate) (PIBCA) nanoparticles were prepared by anionic emulsion polymerization (AEP) according to the method of Couvreur et al. [36] modified by Bertholon et al. [37]. Briefly, 500 µL of isobutylcyanoacrylate were added to 10 mL of nitric acid 0.2 M containing 0.1375 g dextran under vigorous magnetic agitation at 40°C. The polymerization was allowed to proceed for 24 hours. The nanoparticle dispersion obtained was then cooled down and purified by dialysis (Spectra/Por membrane 100 000 g/mol molecular weight cut off) against 1 L of water 3 times to remove any unreacted reagents and to raise the pH to a neutral value. Further purification included a first centrifugation at 2000 rpm (i.e., 720 x g) (Eppendorf Centrifuge 5804R, Eppendorf France, Le Pecq, France) for 10 min followed by a second centrifugation at 12500 rpm (i.e., 17000 x g) (Eppendorf Centrifuge 5417R, Eppendorf France, Le Pecq, France) for 15 min to remove any contaminant aggregates. The concentration in nanoparticles in the suspension was 48.7 ± 0.2 mg/mL as determined gravimetrically and the volume fraction of the dispersed particles was 4.3%.
Adsorption of BSA on the nanoparticles
The nanoparticles were transferred to a phosphate buffer 10 mM, pH 7.4 by dialysis (Spectra/Por membrane 100 000 g/mol molecular weight cut off (MWCO), Biovalley, Marne la Vallée, France). In parallel, two solutions of BSA, 4 and 40 mg/mL, were prepared in phosphate buffer 10 mM, pH 7.4. Nanoparticles (0.350 mL) where incubated with BSA at concentrations ranging from 0 to 4000 µg/mL for 3 hours at 37°C. The total volume of the incubated sample was 1.5 mL and the volume fraction of the nanoparticles in the incubation medium was 1.0 %. After the incubation time, the amount of free BSA was evaluated by immunochemical techniques.
Electron microscopy
The electron micrograph was obtained at the CNRS-CECM (Vitry sur Seine, France) using a scanning electron microscope MEB LEO 1530 (LEICA) equipped with a Gemini type column. Prior to the observation, freeze dried samples of nanoparticles were mounted on
6 supports and coated with a 2 nm Pt/Pd layer using a Cressington sputter coater 208HR apparatus (Cressington, Roissy, France) operating under argon atmosphere.
SANS
Neutron scattering is a technique that measures interferences between neutrons scattered by nuclei [38-40]. Since different nuclei have different scattering lengths, the interference patterns reflect the compositions and relative locations of structural elements in the sample. The phase differences that control these interferences are determined by the scalar product
q .r where r is the vector joining 2 nuclei, and q is the scattering vector. If the sample is
isotropic as a whole, then the scattered intensity only depends on the magnitude of the scattering vector, which varies with the neutron wavelength and scattering angle according to:
q
4
sin
2
/1/In Small Angle Neutron Scattering (SANS), the locations of individual nuclei are not resolved; instead, the relevant quantity is a density of scattering length (r) that sums the scattering lengths in a small volume. The scattered amplitude is a Fourier transform of (r) in the irradiated volume V:
A q
V
r ei q .r dr /2/and the intensity is the square of the modulus of the amplitude:
I q
A q
2 V /3/If the sample contains spherical particles, each made of concentric shells, dispersed in a homogenous solvent, then the amplitude per particle can be expressed as [41-43]:
A q
1V R
1 F q,R
1
ii1
V R
i F q,R
ii 2 N
/4/In this expression the index 1 is for the outer shell, R1 the outer radius of this shell, 1 its increment of density of scattering length with respect to the solvent and V(R1) = (4/3)R13 is the volume of the corresponding sphere. Similarly, the indices 2, are for the next shells, up to the internal sphere which has the index N. Moreover, F(q, Ri) is the form factor amplitude of a sphere of radius Ri :
7 F q, R
i
3 sin qR
i qRicos qR
i
qRi
3 /5/The resulting intensity has oscillations that reflect the detailed structure of the particle. If the sample contains independent particles of different sizes, then the intensity is the sum of individual intensities, and the oscillations are damped.
At very low q values (q 0) all form factors are A(q) = 1 and the amplitude per particle is:
A q
0
1V R
1
ii1
V R
i i 2N
/6/For a collection of independent particles, where Np is the number of particles per unit volume,
p the average density of scattering length of the particles, s that of the solvent, and Vp the
volume of a particle, this returns the usual variation of intensity with contrast:
I q
Np
ps
2Vp
2 /7/
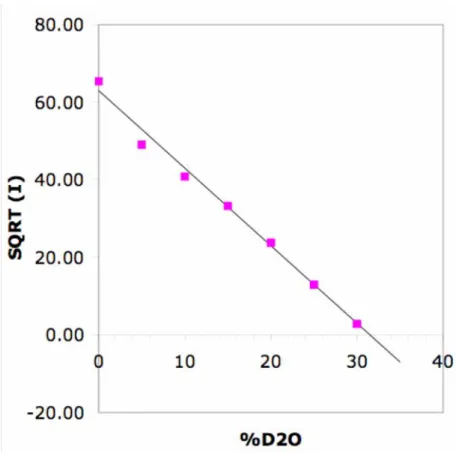
A consequence of equation /7/ is that the square root of the intensity scattered at q 0 varies linearly with the absolute magnitude of the contrast (p – s). Hence the average scattering
length density of the particles may be determined from a plot of I vs. s. Figure 2 shows a plot
of the intensity scattered at a low q value by dispersions of the nanoparticles in mixtures of H2O and D2O. This plot shows that a solvent made of 69% H2O and 31 % D2O (by volume) matches the average scattering length density of the particles p. Similar experiments
performed with proteins show that most proteins are matched by solvents that contain 60% H2O and 40 % D2O [44].
Finally, at low but finite q values, the intensity curve can be approximated by the Guinier law, which yields the overall particle size [39]:
I q I q 0 exp q 2 Rg2 3 /8/
The radius of gyration Rg,that appears in equation /8/ is the second moment of the distribution
of scattering length density within the particle:
8 For a « core-shell » particle of scattering densities 1 and 2 and radii R1 and R2 with =R2/R1 this yields: Rg 2 3 5 R1 2 12 51
12
31
/10/which returns the usual expressionRg 2 3
5 R1
2 in the case of a homogenous sphere.
Figure 2. Determination of the average density of scattering length of the nanoparticles. Horizontal scale: isotopic composition of the mixtures of H2O and D2O that were used as solvents. Vertical scale: square root of the intensity scattered at low q by dispersions of the nanoparticles in these mixtures. The solvent that matches the average density of scattering length of the nanoparticles is made of 69% H2O and 31 % D2O (by volume).
9
Determination of BSA by immunochemical methods
After incubation with nanoparticles, the amount of non-adsorbed BSA was determined using immunochemical methods including radial immunodiffusion [45] and immunoelectrophoresis [46]. In both cases, agarose gel plates (12 x 8.5 cm) were prepared on Gelbond® films for agarose gel (Amersham BioScience, Uppsala, Sweden). The agarose solution (11.7 mL) at a concentration of 1% contained 0.3 mL of the bovine serum albumin antisera diluted at 1/5 in a saline phosphate buffer (10 mM, NaCl 140mM, KCl 25mM, pH 7.5). For the radial immunodiffusion technique, the gel was prepared in the saline phosphate buffer (10 mM, NaCl 140mM, KCl 25mM, pH 7.5)whereas tricine buffer (lactate calcium 1mM, Tris 63mM, Tricine 27mM, pH 8.6) was used to prepare gels for the immunoelectrophoresis method. Wells holding 5µl sample were formed using a 2 mm diameter punch on the gel plates. After deposition of the samples in the wells (5µl) including standard solutions of BSA and nanoparticles incubated with the different concentrations in BSA, gels were placed in a humid chamber and let to diffuse in a quiet place for 48 hours at room temperature in the case of the radial immunodiffusion technique. The conditions for the immunoelectrophoresis were 18h, 230V, 12 mA (Electrophoresis power supply EPS 600, Amersham, Pharmacia Biotech, Orsay, France) using Tricine buffer as the running buffer for the electrophoresis performed in a Pharmacia LKB Multiphor II apparatus (Amersham, Pharmacia Biotech, Orsay, France). At the end of both types of experiments, the gels were dried using Watmann® filter papers and stained with coomassie blue to reveal of the formation of BSA-antibody immunoprecipitate. Each gel contained a set of 5 to 6 standard solutions of BSA of concentration ranging from 10 to 800 µg/mL for internal calibration purpose. In the case of the radial immunodiffusion technique, the calibration curve is a linear relationship between the square of the diameter of the immunoprecipitation ring and BSA concentration in the well. In the case of the immunoelectrophoresis, the calibration curve is a linear relationship between the height of the immunoprecipitation peak and the concentration in BSA in the well. In both cases, calibration cuves with correlation coefficients above 0.99 were obtained with a good reproducibility.
10
RESULTS.
Adsorption of BSA through immunochemical assays
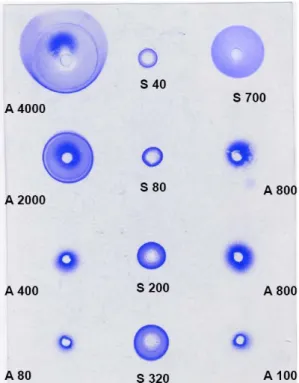
The adsorption of BSA on the nanoparticles in a 1% wt aqueous dispersion was determined through two methods: immunodiffusion and immunoeletrophoresis. Both methods measure the concentration of BSA that remains in the dispersion upon equilibrium with the nanoparticles. As shown in previous work [47], adsorption equilibrium was reached after 1 hour of incubation. A typical set of results, obtained through radial immunodiffusion, is shown in Figure 3. The amount of adsorbed BSA was calculated for each initial concentration of BSA in the solution, and thus the results were converted into adsorption isotherms. Both methods yield very similar adsorption isotherms (Figure 4), with a first section that shows high affinity binding (i.e., the amount adsorbed equals the initial amount) followed by a plateau that indicates saturation of the nanoparticle surfaces (i.e. the adsorbed amount saturates regardless of the total amount of BSA).
Figure 3: Example of radial immunodiffusion gels obtained for the determination of the adsorption isotherm of BSA on the nanoparticles. The concentrations in BSA in the nanoparticle suspensions (A) and in reference BSA solutions (S) are indicated in µg/mL for each well.
11
Figure 4. Adsorption isotherms of BSA on the AEP nanoparticles as determined by radial immunodiffusion (full diamond), by immunoelectrophoresis (open squares) and by SANS (full triangle). Lines are drawn as guides to the eye.
Neutron scattering at full contrast
The structures of the nanoparticles were determined through SANS. The first set of experiments was performed with dispersions in H2O, in which the nanoparticles have a strong contrast. The spectra of the dilute (1% wt) nanoparticle dispersions were typical of polydisperse, non-interacting spherical particles with a narrow size distribution, as indicated by the oscillation at high q values (Figure 5). They could be fitted with the calculated scattering curve for polydisperse homogeneous spheres using a Gaussian distribution of the radii with a mean radius of 25.3 nm and standard deviation of 4 nm. Upon adding BSA, there were significant changes in the magnitude of the scattered intensities, but not in the shapes of the spectra. These spectra could be fitted by the same type of scattering curves, with nearly the same radii (25.3 to 26 nm) as those without BSA (Figure 5). Accordingly, the particles were not aggregated. The rise of intensity must originate from the presence of the proteins, either absorbed or in solution. According to equation /3/, since the mass per free protein is 104 times smaller than that of a nanoparticle, the contribution of free proteins to the intensity scattered at low q can be neglected. Therefore, the rise of intensity at low q values originates only from the increase in the mass per particle, consecutive to the adsorption of proteins.
12
Figure 5. SANS spectra obtained from AEP nanoparticles without BSA (open square) and in the presence of 2000 µg/mL BSA (closed triangle). The lines correspond to the theoretical spectra calculated with a model of polydisperse spheres. The fit parameters are: radius of the nanoparticles 25.3 nm for AEP nanoparticles without BSA (dotted line) and 26 nm for AEP nanoparticles with 2000 µg/mL BSA (solid line). The insert gives the Gaussian distribution of the nanoparticle sizes, which has a standard deviation of 4 nm.
At each BSA concentration, the intensity extrapolated to q → 0 and the corresponding radius were measured through the Guinier approximation (Figure 6). The variations of intensity and radius according to the amount of BSA introduced in the dispersion are presented in Figure 7. It is noteworthy that the intensities grow by about 15 % while the radii remain nearly the same (at the highest BSA concentration the measured radius has increased only by 0.8 nm). The growth of intensities takes place over the same range of concentrations as the adsorption of BSA measured through the immunoassay methods, and it saturates at higher concentrations, where the added proteins remain free in solution according to the immunoassays. This is further confirmation that the rise of intensity at q → 0 measures the increase in the mass per particle consecutive to the adsorption of BSA.
13
Figure 6: Guinier plots of AEP nanoparticles without BSA (open square) and with 2000 µg/mL BSA (closed triangle). Fits (thin solid lines) were obtained with ln I0 = 0.36 and Rg = 19.4 nm for AEP nanoparticles without BSA and ln I0 = 0.52 and Rg = 20.2 nm for AEP nanoparticles with BSA. This last radius corresponds to the case of a thin adsorbed layer (0.8 nm) containing BSA molecules adsorbed in a flat configuration on the PIBCA core. The thick red solid line is the corresponding fit for Rg = 20.8 nm. This corresponds to the case of a thick adsorbed layer (8 nm) containing water and BSA molecules bound through their extremities to the PIBCA core.
Figure 7: Variations of the radius of the nanoparticles incubated with increasing concentration of BSA (R/R0: full square) and of the intensity extrapolated to low q values (I/I0: full diamond).
14
Neutron scattering with contrast variation
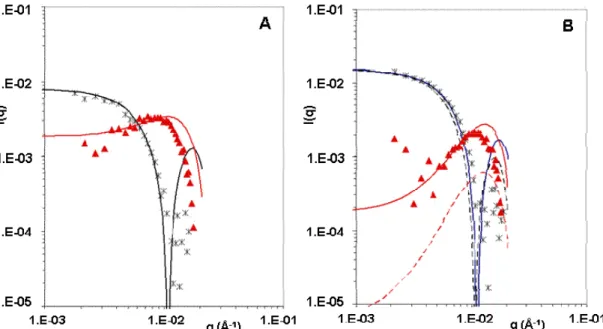
The second set of SANS experiments was performed with dispersions in H2O + D2O mixtures, in which the nanoparticles have a low contrast. Two isotopic compositions of the mixtures were used, one with a scattering density s (28.3 % D2O) slightly below the average scattering density p of the nanoparticles (31 % D2O) and one with s (32.3 % D2O) slightly above p. For the pure nanoparticle dispersions (Figure 8A), the shapes of the spectra
obtained at these two contrasts are quite different, indicating the nanoparticles are heterogeneous in scattering density. Indeed, a spectrum with a depression at low q and a peak at higher q values indicates that some regions in the particle are below the average scattering length density of the solvent, while other regions of the particle are above.
Figure 8. Contrast variation for dispersions of AEP particles in BSA solutions: (A) no BSA, (B) BSA concentration 2000µg/mL. In each figure the 2 spectra correspond to dispersions made in solvents with different isotopic compositions: 28.3% D2O (black stars) and 32.3 % D2O (red triangles). The lines are fits by the scattering curves of particles made of concentric shells: (A) full lines, core-shell structure for AEP particles; (B) full lines, same AEP particles with a thin (0.8 nm) BSA layer The corresponding profiles of scattering density are drawn in Figure 9; (B), dotted lines, same AEP particles with a thick (8 nm) BSA layer.
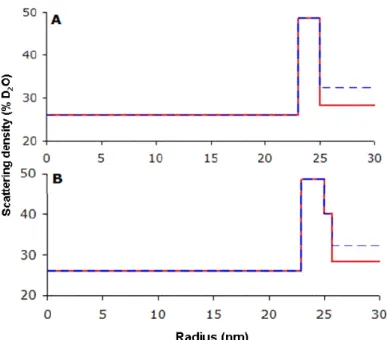
These spectra can be fitted with a model of core-shell particles (Figure 9), where the core has a scattering density that corresponds to 26 % D2O, while the shell has thickness of 2.0 nm, an outer radius of 25 nm and a much higher scattering density (48.6 % D2O). The fit of the spectrum at the match point is only fair, which is not surprising since in these conditions the
15 scattering curve is extremely sensitive to fine structural details such as departures from spherical symmetry. The value of the outer radius is almost identical with that determined at full contrast.
The addition of BSA caused significant changes in the spectra at each contrast (figure 8B). These spectra can also be fitted with a model of core-shell particles, with the same scattering densities, but with an additional shell that accounts for the adsorbed BSA (Figure 9). The fits are acceptable if this additional shell has a small thickness (0.8 nm) (figure 8B solid lines) and a high density of scattering length (40 % D2O) that correspond to a dense packing of BSA molecules adsorbed in a flat configuration on the PIBCA core. They are significantly worse if this shell is modeled with a larger thickness (8 nm) (figure 8B doted lines) and a lower density of scattering length (3 % D2O) to represent the same number of BSA molecules but bound to the core through one edge only and separated by water. This result is in agreement with the results of experiments performed at full contrast, where it was found that the adsorption of BSA produced only a very small increase in the radius of gyration of the particles (see Figure 6).
Figure 9. Profiles of scattering density for dispersions of AEP particles in H2O+D2O solvents (A), and for AEP particles in H2O+D2O solvents containing BSA (2000 µg/mL). (B), The profiles show the density of the particle (hydrogenated core up to 23 nm, dense shell from 23 to 25 nm), the density of the BSA layer (from 25 to 25.8 nm) and that of the solvents (beyond 25 nm in A and 25.8 nm in B).
16
DISCUSSION
The aim of this work was to determine the locations and configurations of adsorbed BSA molecules at the nanoparticle surface. A priori, the BSA molecules could be either adsorbed on the particle core or bound to PIBCA chains that would protrude slightly from the core. If they are adsorbed on the particle core, two configurations should be further considered, i.e., they may be adsorbed in a flat configuration, forming a dense layer, or they may be adsorbed through their edges or extremities only, forming a layer that is thicker but not dense.
In order to solve this problem, we can consider that the BSA molecules are located in a spherical shell around the particle. Then we can try to determine the parameters of that shell: (i) content (number of adsorbed BSA molecules); (ii) radius (location of adsorbed BSA molecules); (iii) thickness (configuration of adsorbed BSA molecules).
Number of adsorbed BSA molecules
The adsorption isotherms (Figure 4) show that the adsorption of BSA saturates at a plateau value that must correspond to a fully occupied adsorption layer. Here we calculate the number of BSA molecules in that layer. For this calculation we shall use the concentration of adsorbed BSA in the dispersion, together with the known values of the volume per BSA molecule and of the volume per nanoparticle.
Volume of the “dry” BSA molecule. The literature teaches that the hydrated form of the
protein can be described as a V shaped object with a base area = 8 x 8 nm2, and a thickness
h = 3 nm [4,48]. The corresponding hydrodynamic volume is quite large, but it is not relevant
here since it contains mostly water. For SANS, the volume of BSA that is “seen” is the “dry” volume which can be calculated from the molar mass (m = 67000 g/mol) and the volume increment in solution = 0.73 cm3/g. The result of this calculation yields v
dry = 81 nm3 [44].
This value agrees with an X-ray scattering determination of the volume of another protein, thioredoxine reductase, that has roughly the same molar mass (68000) as BSA. Indeed, the scattering volume of this protein was found to be 80.6 nm3 [49]. Thus, the value of v
17 nm3 calculated above will be used for further calculations taking part of the discussion from this work.
Volume of the nanoparticle. The structure of the PIBCA nanoparticles was resolved by
SANS experiments carried out in the present work. From the fits of the scattering curves obtained at full contrast, each particle can be described as a sphere of radius Rp = 25.3 nm, surface area Sp = 8044 nm2 and volume Vp = 67834 nm3.
Number of adsorbed BSA from immunoassays. The number of adsorbed BSA molecules per
unit volume of the solution, nads, can be calculated from their concentration Cads, measured
through immunoassays:
n
ads C
adsN
A/ m
/11/where NA is Avogadro’s number and m is the molar mass of BSA. The number of nanoparticles per unit volume of the solution Np, can be calculated from the volume per nanoparticle Vp:
N
p /V
p /12/The ratio z = nads / Np is the average number of adsorbed BSA molecules per particle.
According to Cads measured through immunoassays, we find z = 64 BSA/particle.
Number of adsorbed BSA from SANS. The number of BSA molecules adsorbed on a PIBCA
particle can also be calculated from the variation of intensity of the scattered neutrons at full contrast, which is shown in Figure 7. Indeed, for a particle made of a polymer core (volume
Vp and average excess of scattering density p) and a set of z adsorbed BSA molecules (volume vdry and average excess of scattering density ads), the intensity scattered in the limit
of q0 can be derived from equation /7/:
I q
0
Np
Vpp zvdrys
2 /13/This can be compared with the intensity scattered by the same particle without BSA:
18 Hence the number of BSA adsorbed on a particle can be calculated as:
z I Ip 1
p ads Vp vdry /15/ Using p /ads = 0.31/0.40, Vp/vdry = 835 and I/Ip = 1.16 we obtain z = 50 BSA/particle.The number of BSA per particle deduced from the SANS experiments is lower than that determined through immunochemical methods, and the difference is larger than the uncertainty of either result; an obvious explanation of this difference is the effect of the size distribution of particles. Indeed, the larger particles from the distribution make the main contribution to the intensity ratio I/Ip. Conversely, the smaller particles of the size distribution contribute very little to the neutron intensities at q 0, but they have a substantial surface area, and they contribute to the coverage that is measured by the immunoassay methods.
Radius of the adsorbed BSA layer
The location of the adsorbed BSA can be determined according to the radius of the BSA-covered particles that has been measured through SANS at full contrast. Indeed, if the BSA molecules are adsorbed right on the core surface, then the radius of the BSA-covered particles must be quite close to the radius of the particles without BSA. Conversely, if the BSA molecules are adsorbed on the corona, the radius R of the particles with BSA would be closer to the radius of the corona, which can be larger than that of the core. The experimental value of R, derived from fits to the scattering curves obtained at full contrast (Figure 5) or from Guinier plots (Figure 6), indicates that the adsorption of BSA causes the radius to increase by only 0.7 nm. This very small increment indicates that the BSA are adsorbed right at the surface of the particle core.
Average thickness of the adsorbed BSA layer
The thickness of the adsorbed layer can be deduced from the SANS experiments performed with contrast variation. For this purpose, it is necessary to take into account the fine structure of nanoparticles without BSA. SANS experiments reveal that the bare nanoparticles have a core-shell structure made of a PIBCA core and a shell with a higher scattering density (Figure 8A). The high contrast of the shell indicates that it is depleted in hydrogen atoms suggesting that it contains preferentially the polar groups of the PIBCA polymer. In addition, the
19 deviations from the fits by spherical shell models indicate that this shell does not have full spherical symmetry.
The adsorption of BSA has been modeled as an additional layer on this core-shell structure (Figure 9). For this purpose, the spectra obtained at BSA saturation have been fitted with the scattering curves corresponding to two models. The first model has a thin BSA shell (0.8 nm) of high density of scattering length (40 % D2O), corresponding to a dense packing of BSA molecules adsorbed in a flat configuration on the PIBCA core (Figure 8B, full lines). The second model has a thicker shell (8 nm) of lower density of scattering length (3 % D2O) corresponding to the same number of BSA molecules but bound to the core through one edge only and separated by water (Figure 8B, dotted lines). The fits by the first model (thin shell) are acceptable while the fits by the second one are not (Figure 8B). Therefore, the BSA molecules must be adsorbed through their larger face on the nanoparticle surfaces, forming a thin layer (average thickness 0.8 nm). This thickness is in agreement with the increment in the overall size of the nanoparticles caused by BSA adsorption, according to SANS experiments at full contrast (see above).
Configuration of the adsorbed BSA
Having determined the content of the adsorbed BSA layer and its thickness, it becomes possible to determine the configuration of these BSA molecules and the fraction of the nanoparticle surface area that they cover. First, since the thickness is very small, we assume that the BSA molecules are adsorbed in a flat configuration, with their largest face adhering to the surface of the nanoparticle. We also assume that the BSA molecules have retained their native configuration. Indeed, it was recently shown that BSA adsorbs in its native configuration on small nanoparticles (R < 30 nm). In this native configuration, the surface area that can be covered by the largest face of a BSA molecule, is = 64 nm2 [4,48]. Since the total surface area of the particle is 8044 nm2, the full coverage of the nanoparticle surface by a monolayer of BSA would require zmax =126 BSA molecules. The number z of adsorbed BSA at saturation which can be deduced from our experimental data is z = 64 according to the immunoassays. This is a substantially smaller value than the zmax needed to form a closed packed monolayer covering the whole nanoparticle surface. It yields a coverage z/zmax = 50 %. At this stage we may conclude that only half of the surface area of the PIBCA is accessible
20 to the BSA molecules. An obvious conclusion is that the dextran corona covers about half the surface area of the core and prevents binding of the BSA molecules.
We can also perform an independent verification of these results by comparing the effective thickness of the BSA layer that was determined through SANS with the effective thickness that results from this surface coverage. Indeed, a complete BSA layer would have an effective dry thickness h0 equal to the dry volume of the BSA molecule, vdry = 81 nm3, divided by the
surface area of its largest face, = 64 nm2, which yields h0 = v
dry/ = 1.3 nm. The effective
thickness that was measured through SANS is h = 0.7 nm (experiments at full contrast) to 0.8 nm (contrast variation), which is about half of the full layer thickness h0.
Model of nanoparticle surface with adsorbed BSA
At this stage, it becomes possible to make a simplified model of the particle surfaces with the adsorbed layer (Figure 10). The particles have a core-shell structure, with a PIBCA core and a 2 nm thick shell that contains preferentially the polar groups of the PIBCA polymer. Dextran chains, linked to the PIBCA polymer in numerous points, cover half of the surface area of this polar shell. The rest of the surface is available for adsorption of proteins; at saturation, it can bind 64 BSA molecules per particle. These BSA molecules are adsorbed directly on the dense polar PIBCA shell, in a flat configuration, with their largest face bound to the surface of the nanoparticle. This adsorption increases the effective radius of the particle by h = 0.7 nm (SANS experiments at full contrast) to 0.8 nm (SANS with contrast variation).
Figure 10: Locations of the hydrogen depleted shell and of the adsorbed BSA at the surfaces of PIBCA-dextran nanoparticles. Nanoparticles without (A) and with BSA (B).
21
CONCLUSION
The general aim of this work is to find out where and how proteins bind to nanoparticles that are used as drug carriers. The central question is how the details of the nanoparticle surface influence the location and configuration of adsorbed proteins. In the present work we used nanoparticles made by self-assembly of dextran-PIBCA copolymers, and a common blood protein, BSA. Using SANS and immunoassays, we obtained three numbers that characterize the layer of adsorbed BSA: the number of adsorbed proteins per nanoparticle (z = 64), the radius of the adsorbed layer (it is practically equal to the radius of the PIBCA core) and the thickness of the adsorbed layer (the equivalent thickness amounts to 0.8 ± 0.2 nm of dry BSA, which is half the dry thickness of a full BSA layer). These numbers are consistent with a structural model in which the BSA molecules are adsorbed in a flat configuration, with their largest face bound to the PIBCA surface. In this model, the adsorbed BSA molecules cover 50 % of the total surface area of the nanoparticles; the remaining of the nanoparticle surface is unavailable for BSA adsorption because it is covered with Dextran chains.
These structural details are important with respect to the biological function of the adsorbed proteins because they indicate that (a) the adsorbed proteins are fully accessible rather than buried among the dextran chains, and (b) the adsorbed proteins are in a flat configuration in which they can be recognized by other proteins. Indeed, it has been found that these nanoparticles elicit a strong response from the complement system. This strong response may originate from recognition of proteins that are adsorbed on bare patches of the core surface, in the same configuration that has been found here for BSA.
All of this is of course related to the fact that the nanoparticles were made through self-assembly of a comb copolymer. Now, it would be interesting to continue this work by investigating the effect of the spatial arrangement of the dextran chains at the nanoparticle surface. This could be done through the use of nanoparticles which have end-grafted dextran chains. Such nanoparticles were found to display opposite capacity to activate the complement system, indicating that they should remain for longer periods in the blood stream after intravenous injection, and achieve a completely different biodistribution pattern compared to those of the nanoparticles investigated in the present work.
22
ACKNOWLEDGEMENTS
The authors wish to thank K. Broadley (Henkel Biomedical, Ireland) for his kindles providing the isobutylcyanoacrylate used in the synthesis of the nanoparticles, M. Besnard (CNRS, UME 8612, Chatenay-Malabry) and Audrey Valette (CNRS-CECM, Vitry sur Seine) for their assistance in the electron microscopic observation.
REFERENCES
1. J.L. Brash, J. Biomater. Sci. Polym. Ed.,11 (2000) 1135-46.
2. B. Montdargent and D. Letourneur, Infect. Control. Hosp. Epidemiol., 21 (2000) 404-410. 3. Y.X. Wang, J.L. Robertson, W.B. Jr. Spillman and R.O. Claus, Pharm. Res., 21 (2004)
1362-1373.
4. G. Yampolskaya and D. Platikanov, Adv. Coll. Interf. Sci., 128-130 (2006) 159-183. 5. J. Klein. Proc. Natl. Acad. Sci., 104 (2007) 2029-2030
6. W. Norde. Colloids and Surfaces B: Biointerfaces, 61 (2008) 1-9.
7. R.H. Muller and C.M. Keck, J. Nanosci. Nanotechnol., 4 (2004) 471-483. 8. D.E. Owens and N.A. Peppas, Int. J. Pharm., 307 (2006) 93-102.
9. D. Labarre, G. Barratt, P. Legrand and C. Vauthier, In R. Arshadi and K. Kono (Eds) Smart nanoparticles in nanomedicine,; Kentus Books, London, 2006, p 37.
10. A. Vonabourg, C. Passirani, P. Saulnier and J.P. Benoit, Biomaterials, 27 (2006) 4356-4373.
11. I. Lynch, T. Cedervall, M. Lundqvist, C. Cabaleiro-Lago, S. Linse and K.A. Dawson, Adv. Colloid Interface Sci., 134 (2007) 167-174.
12. R. Gref, Y. Minamitake, M.T. Peracchia, V. Trubetskoy, V. Torchilin and R. Langer, Science, 263 (1994) 1600-1603
13. C. Passirani, G. Barratt, J.P. Devissaguet and D. Labarre, Pharm. Res., 15 (1998) 1046-1050.
14. M.T. Peracchia, S. Harnisch, H. Pinto-Alphandary, A. Gulik, J.C. Dedieu, D. Desmaele, J. d'Angelo, R.H. Muller and P. Couvreur, Biomaterials, 20 (1999) 1269-1275.
15. M.T. Peracchia, E. Fattal, D. Desmaële, M. Besnard, J.P. Noel, J.M. Gomis, M. Appel and P. Couvreur, J. Control. Release, 60 (1999) 121-128
16. R. Gref, M. Luck, P. Quellec, M. Marchand, E. Dellacherie, S. Harnisch, T. Blunk, and R.H. Muller, Colloids Surf. B Biointerfaces., 18 (2000) 301-313.
17. K. Avgoustakis, Curr. Drug Deliv., 1 (2004) 321-333.
18. S. Kommareddy, S.B. Tiwari and M.M. Amiji, Technol. Cancer Res. Treat., 4 (2005) 615-625.
19. D. Labarre, C. Vauthier, C. Chauvierre, B. Petri, R.H. Muller and M.M. Chehimi, Biomaterials, 26 (2005) 5075-5084.
20. G. Raffaini and F. Ganazzoli, Macromol. Biosci., 7 (2007) 552-566. 21. J.J. Kreuter, Nanosci. Nanotechnol., 4 (2004) 484-488.
22. H.R. Kim, K. Andrieux, S. Gil, M. Taverna, H. Chacun, D. Desmaële, F. Taran, D. Georgin and P. Couvreur, Biomacromolecules, 8 (2007) 793-799.
23 24. I. Lynch, A.K. Dawson and S. Linse, Sci STKE, 327 (2006) pe14
25. P. Roach, D. Farrar and C.C. Perry, J. Am. Chem. Soc. 128 (2006) 3939-3945.
26. X. Gao, W. Feng, S. Zhu, H. Sheardown and J.L. Brash, Langmuir. 2008 Jun 27. [Epub ahead of print]
27. R. Sinibaldi, M.G. Ortore, F. Spinozzi, S. de Souza Funari, J. Teixeira and P. Mariani, Eur. Biophys. J., 37 (2008) 673-681.
28. C. Vauthier, C. Dubernet, E. Fattal, H. Pinto-Alphandary and P. Couvreur, Adv. Drug Deliv. Rev. 55 (2003,) 519-548.
29. P. Couvreur and C. Vauthier, Pharm. Res., 23 (2006) 1417-1450.
30. E. Fattal, K. Andrieux, G. Barratt, P. Couvreur, D. Labarre, G. Ponchel and C. Vauthier, In A.J. Domb, Y. Tabata, M.N.V. Ravi Kumar and S. Faber (Eds) Nanoparticles for pharmaceutical applications. American Scientific Publishers: Stevenson Ranch, Ca, 2007; p 213.
31. C. Vauthier, D. Labarre and G. Ponchel, J. Drug Targeting., 15 (2007) 641-663
32. J.F. Dufour-Lamartinie, F. Habersetzer, A. Abergel, P. Merle, S.N. Si Ahmed, L. Bonyhay, J. Taieb, D. Costantini and C. Trepo, Supp. J. Clin. Virol., 36 (2006) Suppl. 2 33. I. Bertholon, S. Lesieur, D. Labarre, M. Besnard and M. Vauthier, Macromolecules, 39
(2006) 3559-3567.
34. C. Chauvierre, C. Vauthier, D. Labarre and H. Hommel, Coll. Polym. Sci., 282 (2004) 1016-1025.
35. I. Bertholon, H. Hommel, D. Labarre and C. Vauthier, Langmuir, 22 (2006) 5485-5490. 36. P. Couvreur, B. Kante, M. Roland, P. Guiot, P. Bauduin and P. Speiser, J. Pharm.
Pharmacol., 31 (1979) 331-332.
37. I. Bertholon, C. Vauthier, and D. Labarre, Pharm. Res., 23 (2006) 1313-1323.
38. D.C. Champeney, Fourier transform and their physical applications. Academic Press 1973. 39. O. Glatter, Small angle X-ray scattering. Academic Press, 1982.
40. P. Lindner, In P. Lindner and T. Zemb (Eds) Neutrons, X-rays and light: scattering methods applied to soft condensed matter. North Holland: Amsterdam; 2002; Chapter 2. 41. J.B. Hayter, Faraday Discuss. Chem. Soc., 76 (1983) 7-17.
42. D.J. Cebula, J.W. Goodwin, G.C. Jeffrey, R.H. Ottewill,. Faraday Discuss. Chem. Soc., 76 (1983) 37-52.
43. A. Rübe,G. Hause, K. Mäder, J.J. Kohlbrecher. Control. Release, 107 (2006) 244-252. 44. B. Jacrot. Rep. Prog. Phys., 39 (1976) 911-953.
45. G. Mancini, A.O. Carbonnna, J.F. Haremans. Immunochemistry, 2 (1965) 235-254. 46. C.B. Laurell. Anal. Biochem., 15 (1966) 45-52.
47. J.C. Olivier, C. Vauthier, M. Taverna, D. Ferrier, P. Couvreur. Colloids and Surfaces B: Biointerfaces, 4 (1995) 349-356
48. D.C. Carter, J.X. Ho.Adv. Protein Chem., 45 (1994) 153-203.
49. D.I. Svergun, S. Richard, M.H.J. Koch, Z. Sayers, S. Kuprin, G. Zaccai. Proc. Natl. Acad. Sci., 95 (1998) 2267-2272.