HAL Id: hal-02481675
https://hal.archives-ouvertes.fr/hal-02481675
Submitted on 17 Feb 2020
HAL is a multi-disciplinary open access
archive for the deposit and dissemination of
sci-entific research documents, whether they are
pub-lished or not. The documents may come from
teaching and research institutions in France or
abroad, or from public or private research centers.
L’archive ouverte pluridisciplinaire HAL, est
destinée au dépôt et à la diffusion de documents
scientifiques de niveau recherche, publiés ou non,
émanant des établissements d’enseignement et de
recherche français ou étrangers, des laboratoires
publics ou privés.
Nonlinear Behavior and Anisotropy: Proof of Principle
via Ex Vivo Testing of the Horse Aorta
D. Shcherbakova, C. Papadacci, A. Swillens, A. Caenen, S. de Bock, V. Saey,
K. Chiers, M. Tanter, S. Greenwald, M. Pernot, et al.
To cite this version:
D. Shcherbakova, C. Papadacci, A. Swillens, A. Caenen, S. de Bock, et al.. Supersonic Shear Wave
Imaging to Assess Arterial Nonlinear Behavior and Anisotropy: Proof of Principle via Ex Vivo
Test-ing of the Horse Aorta. Advances in Mechanical EngineerTest-ing, Sage Journals, 2015, 6, pp.272586.
�10.1155/2014/272586�. �hal-02481675�
Research Article
Supersonic Shear Wave Imaging to Assess Arterial
Nonlinear Behavior and Anisotropy: Proof of Principle via
Ex Vivo Testing of the Horse Aorta
D. A. Shcherbakova,
1C. Papadacci,
2A. Swillens,
1A. Caenen,
1S. De Bock,
1V. Saey,
3K. Chiers,
3M. Tanter,
2S. E. Greenwald,
4M. Pernot,
2and P. Segers
11IBiTech-bioMMeda, iMinds Medical IT, Ghent University, De Pintelaan 185, 9000 Ghent, Belgium 2Institut Langevin, ESPCI ParisTech, CNRS UMR 7587, INSERM U979, 1 rue Jussieu, 75005 Paris, France
3Faculty of Veterinary Medicine, Laboratory of Veterinary Pathology, Ghent University, Salisburylaan 133, 9820 Merelbeke, Belgium 4Pathology Group, Blizard Institute, Barts and The London School of Medicine and Dentistry, Queen Mary University of London,
Royal London Hospital, 80 Newark Street, London E1 2ES, UK
Correspondence should be addressed to P. Segers; [email protected]
Received 30 April 2014; Revised 4 August 2014; Accepted 18 August 2014; Published 22 September 2014 Academic Editor: Leif Hellevik
Copyright © 2014 D. A. Shcherbakova et al. This is an open access article distributed under the Creative Commons Attribution License, which permits unrestricted use, distribution, and reproduction in any medium, provided the original work is properly cited.
Supersonic shear wave imaging (SSI) is a noninvasive, ultrasound-based technique to quantify the mechanical properties of bulk tissues by measuring the propagation speed of shear waves (SW) induced in the tissue with an ultrasound transducer. The technique has been successfully validated in liver and breast (tumor) diagnostics and is potentially useful for the assessment of the stiffness of arteries. However, SW propagation in arteries is subjected to different wave phenomena potentially affecting the measurement accuracy. Therefore, we assessed SSI in a less complex ex vivo setup, that is, a thick-walled and rectangular slab of an excised equine aorta. Dynamic uniaxial mechanical testing was performed during the SSI measurements, to dispose of a reference material assessment. An ultrasound probe was fixed in an angle position controller with respect to the tissue to investigate the effect of arterial anisotropy on SSI results. Results indicated that SSI was able to pick up stretch-induced stiffening of the aorta. SW velocities were significantly higher along the specimen’s circumferential direction than in the axial direction, consistent with the circumferential orientation of collagen fibers. Hence, we established a first step in studying SW propagation in anisotropic tissues to gain more insight into the feasibility of SSI-based measurements in arteries.
1. Introduction
Increased arterial stiffness has been demonstrated to be a predictor of cardiovascular morbidity and mortality [1,2]. For this reason, there has been large interest in methods for the assessment of arterial stiffness, a potentially potent biomarker of cardiovascular disease with demonstrated prognostic abil-ity [3–6]. In the clinical setting, arterial stiffness is most commonly derived by measuring the pulse wave velocity (i.e., the speed with which the arterial pulse travels along the arterial segment) [7,8]. The global pulse wave velocity (PWV) is derived by measuring the distance and pulse travelling time between common carotid and femoral arteries and has
been recommended as a gold standard method for assessing the arterial stiffness [9]. However, this provides an average stiffness assessment since it does not take into account the variation of the mechanical properties of arteries along the measured segment. Moreover, the distance measurement, which is normally done with a tape measure, is prone to error [10] and assumes a straight arterial segment. Local PWV methods have been developed as well, for example, estimating PWV from the linear relation between the change in pressure and the change in flow velocity at the location of interest in early systole [11] or any related methods based on diameter and flow velocity [12] or volume flow and area [13]. Yet another technique—pulse wave imaging—has been http://dx.doi.org/10.1155/2014/272586
proposed, measuring the arterial wall displacement/velocity along an arterial segment within the imaging view of an ultra-sound probe and estimating the time-shift of this arterial dis-placement wave [14–16]. However, its application in diseased arteries is more challenging due to the increased influence of reflected waves on the results [17]. Similar in principle methods proposed by using magnetic resonance imaging (MRI) [18,19] or by using ECG-2 gated technique [20].
More direct tissue characterization methods have been developed as well, typically referred to as elastography, and applied for the assessment of soft, bulky tissues like the liver [21,22], breast [23], prostate [24], skeletal muscles [25], kidneys [26], and heart [27,28]. These elasticity imaging tech-niques rely on the application of a force to an area of interest in the tissue and measure tissue’s mechanical response. The force is typically generated from the exterior through application of compression devices or vibrators on the subject’s skin or internally by applying an acoustic radiation force (ARF) from an ultrasound transducer or by using endogenous motion (e.g., heart contraction [29], or the moving arterial wall [30]). The measurement of the mechanical response can be performed using ultrasound, magnetic resonance imaging, X-ray imaging, or optical signals. The techniques widely applied to bulk tissues such as sonoelastography [31], compression elastography [32], and transient elastography [21] use a mechanical actuator and can generate large motion amplitudes in the tissue. However, they require additional hardware and are limited by the penetration depth and spatial and temporal resolution.
The most popular class of noninvasive elastography meth-ods is based on the generation of shear waves (SW) in the tissue by means of an acoustic radiation force (ultrasound imaging) or external drivers (MRI) and has shown its poten-tial in arteries [33,34]. While MRI elastography techniques are less operator dependent and may allow the imaging plane to be placed in a reproducible location and acquire 3D data of the region [35], due to the current technical limitations, MRI has a lower spatial and temporal resolution in comparison with US. Additionally, MRI techniques are more expensive due to the need of external drivers and specifically configured systems. One of the ultrasound elastography techniques, acoustic radiation force imaging (ARFI) [36], creates SWs at the successively pushed points and tracks the time required to reach maximal displacement and the relaxation time following each push. Other existing methods, like shear wave elasticity imaging (SWEI) [37], harmonic motion imaging [38], and shear wave dispersion ultrasound vibrometry [39], use the same principle of ARF to create shear waves.
One of these shear wave elastography techniques, which might allow assessing local arterial stiffness more accurately and directly, is supersonic shear wave imaging (SSI) [40]. Here, shear waves are created from multiple focal depths by successively pushing the tissue in depth (performed at a very high speed compared to the shear wave propagation speed and hence the name supersonic). These waves constructively interfere, making a conically propagating shear wave. The propagation characteristics of this SW are directly related to the tissue architecture and mechanical properties (i.e., stiff-ness). This shear wave is tracked in real time by using ultrafast
ultrasound imaging (>1000 frames per second) based on unfocused beam transmissions (plane wave or diverging waves) and parallel beamforming in receive, allowing having a very high frame rate [41].
While SSI has been successfully applied to bulk tissues, application of SSI to thin-walled, layered, and anisotropic structures like arteries remains challenging due to much more complex shear wave phenomena [33]. Indeed, SW propaga-tion in a thin cylindrical shell with a small thickness (<1 mm) compared to the SW length (∼5–10 mm) is more complex than in free-space conditions due to dispersion and refrac-tion. Moreover, the artery is embedded in softer surrounding tissues and filled with blood, where SWs are evanescent. Wave reflections and mode conversions occur at each interface of the arterial wall with blood and surrounding soft tissues. Additionally, the SWs will interfere with the pulse waves generated by the heart and introduce complex deformation patterns in the wall. This distorts the shape of the wave packet and, consequently, SSI imaging setups and signal processing algorithms as developed for bulk tissues cannot simply be transferred to this specific setting.
While the long-term scope of our research is to investigate the influence of geometric and material parameters on SW propagation in challenging arterial settings (e.g., human carotid artery), the aim of this study is to assess SSI in a thick, anisotropic arterial tissue without any further complicating factors (e.g., a tubular geometry, strong dispersion) and use it as a reference point for further numerical studies. Therefore, we performed SSI measurements in an ex vivo setup of equine aorta (≈5 mm thick) while dynamically loading the specimen on a mechanical test bench. Different orientations of the US probe with respect to the excised tissue were investigated to assess the sensitivity of SSI to measurements in a direction deviating from the loading direction in an anisotropic medium.
Since this relatively basic ex vivo setup excludes potential errors from SW dispersion or leakage, it will allow us to better understand the nature of shear wave propagation in a thick-walled, anisotropic arterial setting, supporting our final goal to assess and potentially improve the prognostic capability of SSI in arteries. Furthermore, to the best of our knowledge, no actual validation of SSI tissue elasticity values has been per-formed before through comparison with mechanical testing.
2. Material and Methods
2.1. Equine Aortic Tissue. Freshly excised aorta was obtained
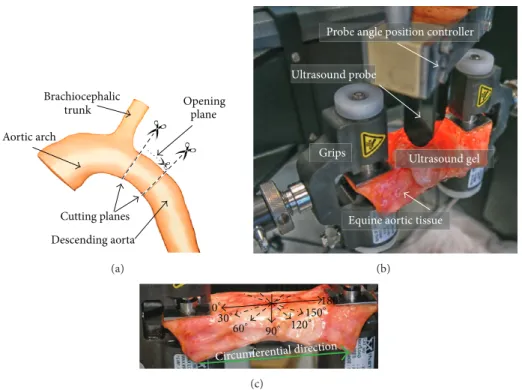
from the Laboratory of Veterinary Pathology of Ghent Uni-versity from a standardbred horse (7-month old mare, euth-anized due to colon torsion). It was preserved in a 10% phos-phate buffered saline (PBS) solution to prevent degrading. A cylinder with a length of≈7 cm from the proximal descending aorta was excised as shown inFigure 1(a). The cylinder was opened by making an axial cut to obtain a rectangular test specimen with a width of ≈7 cm, length of ≈8.6 cm, and variable thickness of 4 to 4.6 mm, as measured with a caliper.
2.2. Uniaxial Mechanical Testing. To measure a mechanical
Opening Brachiocephalic trunk Aortic arch Cutting planes Descending aorta plane (a)
Probe angle position controller
Ultrasound gel Ultrasound probe
Equine aortic tissue Grips
(b)
Circumferential direction
0∘ 30∘ 60∘ 90∘ 180∘ 150∘ 120∘ (c)
Figure 1: (a) Indication of the location of tissue excision; (b) ex vivo experimental setup with the equine aortic tissue mounted on the mechanical testing machine and the US probe fixated above the tissue in the probe angle position controller for the SSI measurements. (c) The US probe position angles used for the SSI measurements are indicated with arrows on the excised slice and the circumferential direction of the tissue is indicated with a thick green arrow.
machine (Instron 5944, Norwood, MA, USA). The complete setup is shown in Figure 1(b)with the tissue mounted be-tween grips and the US probe fixed in an angle position con-troller to adjust the orientation of the probe with respect to the tissue.
Stretch was applied in the vessel’s circumferential direc-tion (indicated by the green arrow inFigure 1(c)) and varied cyclically between 10% and 35% engineering tensile strain (stretch rate 7.7%/s), with the 10% baseline stretch applied to prestretch the tissue. As this is a feasibility study and the data obtained should serve as an input to the numerical model, these stretch values were chosen to ensure that the shear wave speed changes in the tissue are sufficiently pronounced, loading the arterial tissue over a region where nonlinearities become apparent. Ideally, the stretch rate should correspond to the in vivo loading stretch rate. In systole, assuming a diameter distension of 10% over a time sequence of about 0.25 to 0.3 s (initial systolic upstroke), the maximal stretch rate is in the order of 30 to 40%/s during loading, while in diastole the unloading stretch rate is in the order of 10%/s. Unfortunately, we were limited here by the technical specifications of the tensile testing machine, and a uniform stretch rate of 7.7%/s was imposed during loading and unloading which was the maximal achievable stretch rate.
The first ten cycles were considered as preconditioning. A typical loading cycle is shown inFigure 2(a)and took 6.5 s. During the tests, the tissue was sprayed frequently with a PBS solution (10%) to prevent it from dehydrating.
From the stress-strain curve (Figure 2(b)), four elasticity modulus values were calculated at the beginning and ending of the loading/unloading cycles by taking the slope values of the corresponding linear parts of the curve. The correspond-ing average values were taken as the reference𝐸-modulus at minimal/maximal strains.
2.3. SSI Acquisition and Data Analysis. During mechanical
testing, an US probe was positioned at different angles with respect to the tissue for the SSI measurements. The US probe angles ranged from 0∘ (along the circumferential direction as indicated inFigure 1(c)) to 180∘ with a step of 30∘. Note that, when referring to the orientations, the US probe axial direction is into the tissue’s depth and the lateral direction is directed along the probe (seeFigure 3(a)).
A 13 MHz US probe was used to generate the acoustic radiation push focused in the middle of the tissue with a duration equal to 250𝜇s. Fifteen SSI datasets were recorded during mechanical loading for each probe orientation, that is, one dataset every 0.6 s.
The tissue velocities derived from the propagating shear waves (e.g., Figures 3(a)–3(d)) were extracted from the recorded data at 15 axial depths in the tissue, ranging from the top (lumen side) to the bottom of the tissue (adventitia) as indicated by the solid lines inFigure 3(a), covering≈2 mm of the tissue thickness. Note that the axial depth is counted from below the transducer and thus includes the gel layer on top of
Stre tchin g Un st re tc h in g 0 5 0 10 15 20 25 30 35 40 5 10 15 20 25 30 Time (s) T en sile stra in (%) (a) Stretch ing Unstr etchin g 5 15 25 10.0 22.5 35.0 35 T en sile str ess (kP a) Tensile strain (%) (b) 6 7 8 9 10 11 0.6 1.8 3.0 4.2 5.4 6.6 7.8 9.0 Time (s) Sh ea r wa ve v elo ci ty (m/s) (c) Stre tchi ng Unst retc hing 6 7 8 9 10 11 10.0 22.5 35.0 Sh ea r wa ve v elo ci ty (m/s) Tensile strain (%) (d)
Figure 2: (a) An example of loading and unloading mechanical cycles, during which the tissue was stretched from 10% to 35% with a strain rate of 7.7%/sec. (b) Typical stress-strain curve during dynamic loading. (c) Mean shear wave velocity values are marked with the grey squares and were measured during mechanical loading with the US probe position at the angle of 0∘. The solid line represents the interpolated values. (d) Shear wave velocity values versus tensile strain varying during one loading/unloading cycle with the US probe position at the angle of 0∘.
the specimen (which will lead to axial depth values surpassing the physical thickness of the specimen).
Next, the propagation speed of the SWs was derived from these tissue velocity data by plotting the color-coded tissue velocities at each axial depth in the lateral-time dimension, resulting in a 2D tissue velocity map as shown in Figures3(e) and3(f) for the probe angles of 0∘ and 90∘. The SW speed results from this 2D map using a time-of-flight method [21], tracking the maximum tissue velocities and performing a linear regression fit using robust analysis (robustfit function, MATLAB 2013a, Natick, MA, USA) with a bisquare weighing function as shown with black lines in Figures3(e) and3(f).
Depending on the reliability of the measurements, one or both SWs present in the 2D map were taken into account to calculate a representative SWS. SWS values were considered acceptable when𝑅2was larger than 0.7 and SWS<15 m/s as cut-off values to provide the goodness of fit and based on the fact that shear wave speeds higher than 15 m/s are normally not observed in healthy arteries. The median SWS and the corresponding standard deviation from the analysis of all 15 depths were computed.
From these SWS estimations, we also determined the elastic modulus 𝐸, which—in the absence of dispersion and assuming tissue incompressibility—can be derived using
(I) 0∘US probe 0 2 4 6 8 5 10 15 Lateral distance (mm) (e) (f) (a) (b) (c) (d) 0 5 10 15 Lateral distance (mm) 0 0.8 0.6 0.4 0.2 5 10 15 2.5 Lateral distance (mm) T ime (m s) 0.5 1 1.5 2 T ime (m s) 0 5 10 15 Lateral distance (mm) 0 5 10 15 Lateral distance (mm) 0 5 10 15 Lateral distance (mm) Lateral direction T issue dep th (mm) 2 4 6 8 T issue dep th (mm) 2 4 6 8 T issue dep th (mm) 2 4 6 8 T issue dep th (mm) Axial dir ec tio n (II) 90∘US probe Time0.18 ms Time0.36 ms −0.06 −0.04 −0.02 Tissue velocity (m/s) 0 0.02 0.04 0.06 −0.06 −0.04 −0.02 Tissue velocity (m/s) 0 0.02 0.04 0.06
Figure 3: (I) Ultrasound probe positioned along the circumferential direction, that is, 0∘. (II) Ultrasound probe positioned perpendicular to the circumferential direction, that is, 90∘. Shear waves shown at the arbitrary time-steps of 0.18 ms and 0.36 ms, propagating from the push region located in the center of the image towards the periphery on panels (a)–(d). The panels (e), (f) demonstrate the shear wave velocity maps (time versus lateral distance) spanning the depth from 4.8 to 5.7 mm on panel (e) and the depth from 5.3 to 7 mm on panel (f). Black lines are fitted to estimate the shear wave speed. The SWs on panel (f) propagate much more slowly than the SWs on panel (e).
the formula [42]
𝜇 = 𝜌𝑐𝑇2, 𝐸 ≈ 3𝜇, (1) where𝜇 is the shear modulus (kPa), 𝐸 is the elasticity mod-ulus (kPa),𝜌 is the tissue density assumed to be 1066 kg/m3 [43], and𝑐𝑇is the group shear wave speed (m/s), which was assumed to be equal to the median SWS value derived over 15 depths for each time point.
2.4. Histological Analysis. After the mechanical testing, two
tissue samples were taken≈1 cm away from the region where the tissue was clamped for visualization of the smooth muscle cell (SMC) nuclei (haematoxylin and eosin staining). These two samples were excised as rectangular strips in the regions proximal to the arch and superior to the 1st intervertebral artery with approximate dimensions of 6× 2 cm.
3. Results
3.1. Mechanical Tests. A typical stress-strain curve with a
hys-teresis loop is shown inFigure 2(b), indicating nonlinear vis-coelastic behavior of the tissue. The𝐸-modulus was derived from the mechanical testing via a linear fit to the stress-strain curve. The linear slope was calculated at minimal (10% strain) and maximal (35% strain) loading conditions on the loading and unloading segments of the curve. At the minimal strain value of 10%,𝐸-moduli during loading and unloading were 96.6 kPa and 86.5 kPa, respectively, yielding an average value of 91.6 kPa. At the maximal strain value of 35%, values were 199.5 and 271.5 kPa, respectively, yielding an average of 235.5 kPa. The mechanical testing thus indicated a stretch-induced stiffening by a factor of 2.6. At the average strain level (22.5%), stress at loading was 18.9 kPa, while only 17.7 kPa at unloading (−6.3% with respect to the stress at 22.5% loading). At that strain value, the incremental𝐸-modulus of the loading curve was≈115 kPa, while the value was ≈100 kPa for the unloading curve.
3.2. Shear Wave Propagation in Equine Aorta. InFigure 3I, II examples of the two propagating SWs are given at the arbi-trary time points 0.18 ms and 0.36 ms for the probe positioned at 0∘ (tissue’s circumferential direction) and 90∘ (tissue’s axial direction), respectively. The images were captured at the beginning of the loading cycle. The postprocessing was performed at 15 depths as indicated with black lines on
Figure 3(a) spanning the location depth on the B-mode image from 4.8 to 5.7 mm forFigure 3, I and 5.3 to 7 mm onFigure 3, II. It is directly observed that the SWs are propagating faster in the tissue’s circumferential direction than in the tissue’s axial direction. The 2D tissue velocity maps are shown in Figures 3(e) and 3(f) and demonstrate that dispersion (variation of SWS with frequency) was negligible during the measurements; that is, the maximum tissue velocities could be easily tracked and fitted with a liner regression analysis.
3.3. Influence of Stretch-Induced Stiffening on SWS. During
dynamic loading of the tissue, SSI measurements along the tissue’s circumferential direction indicate cyclic changing of
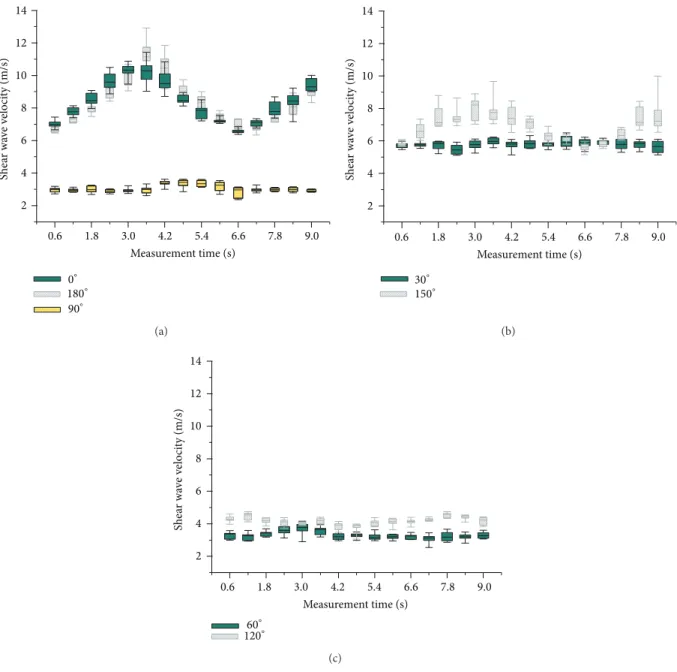
the SW speed within a range between 6.5 m/s (10% tensile strain) and 10.3 m/s (35% tensile strain) for 0∘ position of the US probe and between 6.6 m/s (10% tensile strain) and 11.1 m/s (35% tensile strain) for 180∘position of the US probe as plotted in Figures 2(c) and 4(a). Since dispersion was negligible (see Figures3(e) and3(f)), the obtained SWS was assumed to be equal to the group wave speed𝑐𝑇. Based on (1), this resulted in an 𝐸-modulus ranging from 135.1 kPa to 339.2 kPa for 0∘US probe position and from 139.3 kPa to 394 kPa for 180∘US probe position. The average minimal and maximal values of𝐸-modulus were 137.2 kPa and 366.6 kPa, respectively, hence indicating an increase in𝐸-modulus by a factor of 2.7 from 10% to 35% of stretch.
3.4. Influence of Measuring Angle on SWS. The SWS analysis
resulting from seven different probe orientations (ranging from 0∘to 180∘) is shown in Figures4(a),4(b), and4(c). These results demonstrate the cyclic SWS behavior corresponding to the mechanical cycle. For the circumferential direction (when the probe was positioned at 0∘and 180∘), we obtained the highest variation (ΔSWS = 3.8 m/s and 4.5 m/s resp.) and absolute values.
At 30∘probe position, SWS was markedly lower with val-ues varying between 5.4 m/s and 6.0 m/s (ΔSWS = 0.6 m/s). For the supplementary probe angle of 150∘, a higherΔSWS of 2.6 m/s was obtained with values varying between 5.6 m/s and 8.2 m/s. The supplementary probe angles of 60∘and 120∘both had a similarΔSWS of 0.7 m/s, but the absolute values were slightly higher for 120∘(for 60∘SWS ranged between 3.1 m/s and 3.8 m/s and for 120∘between 3.9 m/s and 4.6 m/s). For the 90∘probe position (along the longitudinal aortic direction), SW velocities were the lowest with a range from 2.9 m/s to 3.4 m/s (ΔSWS of 0.5 m/s).
3.5. Histological Results. InFigure 5hematoxylin and eosin staining is shown in the sample taken proximal to the arch. The dark blue cell nuclei and pink-red cytoplasm are shown in bright-field microscopy, where panels (a), (b) are the axial sections and panels (c), (d) are the circumferential sections. The SMC nuclei appear as round purple-staining within bright pink-staining fibers, when SMC is cut in cross section. When a SMC is perpendicular to the cross-section and a nucleus is out of the section plane, then a dark pink ring of cytoplasm is clearly visible and it is easy to see the cell borders. When SMCs are sectioned parallel to the long axis, the fibers and nuclei take an elongated cigar shape. Based on this histological image and by looking at the orientation of smooth muscle cell nuclei in the haematoxylin and eosin stained sections, we conclude that the general orientation of the collagen fibers in the media is circumferential. Moreover, the tissue was generally homogeneous with a small amount of vasa vasorum.
4. Discussion
In this proof of concept study, we have investigated the ability of SSI to quantify the stiffness (and its changes during dynamic loading) of an equine aortic sample. We imposed
0.6 2 4 6 8 10 12 14 1.8 3.0 4.2 5.4 6.6 7.8 9.0 Measurement time (s) Sh ea r wa ve v elo ci ty (m/s) 0∘ 180∘ 90∘ (a) 0.6 1.8 3.0 4.2 5.4 6.6 7.8 9.0 Measurement time (s) 2 4 6 8 10 12 14 Sh ea r wa ve v elo ci ty (m/s) 30∘ 150∘ (b) 0.6 1.8 3.0 4.2 5.4 6.6 7.8 9.0 Measurement time (s) 2 4 6 8 10 12 14 Sh ea r wa ve v elo ci ty (m/s) 60∘ 120∘ (c)
Figure 4: SW velocities change during dynamic loading at the different US probe angle positions.
supraphysiological strain values during mechanical testing in order to achieve larger SWS variations (causing the tissue to exhibit stretch-induced stiffening as shown in Figures
2(b)and 2(d)), but at a lower strain rate than in vivo due to limitations of the testing machine. The mechanical tests clearly demonstrate hysteresis effects and thus indicate a vis-coelastic component. However, axial prestretch as reported in arteries of young healthy humans or mammals and equal to≈1.3-1.4 [43, 44] could not be taken into account due to the limitations of the experimental setup (uniaxial testing).
When focusing on the SSI data measured along the (pre-sumed) tissue’s circumferential direction (0∘/180∘), SSI mea-surements varied cyclically with the same period as imposed by the uniaxial testing. The relative increase in stiffness over
the loading cycle (by a factor of 2.6) was well captured by SSI (by a factor of 2.7), although the derived𝐸-values were 50 to 56% higher than those obtained from mechanical tests. Possible reasons could be dispersion being ignored when con-verting SWS into𝐸-modulus, meaning that the shear wave propagation speed is not equal to the bulk shear wave speed (although the measurements did not demonstrate any overt effect of dispersion, which is visible in the SW propagation map as multiple wave fronts propagating at different speeds). Considering that the material was anisotropic and heteroge-neous, the assumption of the uniform density as accepted in formula (1) was not correct. As a consequence, this would lead to deviations in the estimation of𝐸 by SSI. Moreover, as the tissue was anisotropic, viscoelastic, and hyperelastic, the use
(a) (b)
(c) (d)
Figure 5: Horse aorta proximal to the arch, hematoxylin, and eosin stain, showing dark blue cell nuclei and pink-red cytoplasm. Bright-field microscopy. (a) Axial section (original magnification×10); (b) 4x magnified axial section (from the square on panel (a)); (c) circumferential section (original magnification×10); (d) 4x magnified circumferential section (from the square on panel (c)).
of the elasticity modulus to characterize material behavior might be ambiguous due to the rapid changes of the slope of the line, that is, precision of the𝐸-modulus.
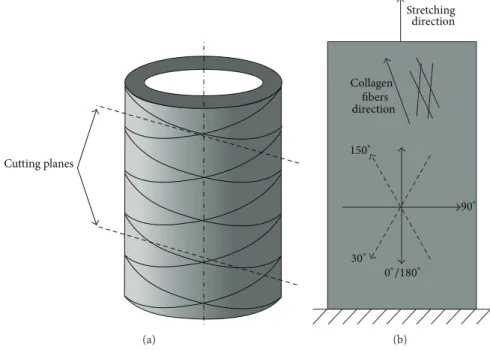
Nevertheless, the observations at 0∘/180∘ fit very well within the conceptual view that the uniaxial stretching of the aortic tissue resulted in the progressive recruitment and stretching of the collagen fibers. These are oriented in two helical families in the intima media layer and angled at approximately 15∘ towards the circumferential direction as shown inFigure 6(a)[45,46]. For the 90∘angle (tissue’s axial direction), SWS did not demonstrate any cyclic behavior and was much lower than SWS in the circumferential direction. We speculate that this observation confirms the collagen fiber orientation, but it could also be induced by the uniaxial test-ing.
Interestingly, when analyzing probe orientations deviat-ing from the circumferential direction, the probe angle of 150∘ picked up a cyclic material behavior though with a smaller ΔSWS than along the (presumed) circumferential direction of the tissue. However, for the supplementary angle of 30∘, no cyclic behavior was observed. We hypothesize that the difference between these supplementary angles can be attributed to the collagen fibers rather aligned between 180∘and 150∘instead of 180∘during stretching (Figure 6(b)). Therefore, at 30∘ SWs would propagate at a larger angle with respect to the fibers’ direction, that is, slower. We also observed that, for the supplementary angles of 60∘/120∘, SWs propagate almost transversely across the fibers leading to the lower SWS and no cyclic behavior.
Our experiments confirm to some extent the in vivo observations of Couade et al. [33], who used SSI to assess the 𝐸-modulus of the carotid artery of a 30-year-old healthy vol-unteer. They reported variations in shear modulus between 86 and 134 kPa over the cardiac cycle. This variation is smaller than in our experiments, which is not unexpected given that (i) shear waves were measured along the axis of the carotid and thus perpendicular to the main collagen fiber orientation and (ii) that in vivo stretch will be significantly lower than imposed in our experiment (circumferential stretch is typically in the order of 10% in young healthy subjects). Another study from Lopata et al. [47] had a similar approach of validating ultrasound measurements with mechanical testing, but the paper studied a different ultrasound modality (vascular strain imaging) in 10 cylindrical porcine aortas dur-ing inflation experiments and afterwards performdur-ing biaxial tensile testing on the tissue samples. Their data indicated shear modulus in the order of 100–120 kPa, hence also lying within the range measured by other authors [33]. Another paper of Ramnarine et al. [48] studied feasibility of SSI for carotid plaques characterization and evaluated reproducibil-ity in tissue-mimicking thin-walled phantoms under steady-state and pulsatile flow conditions. The authors achieved a good reproducibility of SSI and the mean differences between Young’s modulus estimates by different observers ranged from 18% to 25%. Due to the low frame rate of the imaging acquisition (1 Hz) the authors were not able to pick up the change of Young’s modulus with a cardiac cycle. However, their study proved the feasibility of SSI in pulsatile flow
Cutting planes (a) Stretching Collagen fibers direction 150∘ 0∘/180∘ 90∘ 30∘ direction (b)
Figure 6: Schematic drawing, explaining the difference between slab’s circumferential direction (0∘and 180∘US probe) and collagen fiber direction, when stretched. (a) The drawing of a part of the aorta with the circumferentially oriented collagen fibers and two cutting planes, slightly inclined with respect to the circumferential direction. (b) The US probe position angles are shown together with the collagen fiber direction (when stretched) and the stretching direction of the tissue slab during the mechanical testing.
conditions in arteries, though the measured Young’s modulus values were not compared with any reference values.
This study is mainly to be seen as a feasibility study of such an experimental setup to capture cyclic variations in elastic modulus and anisotropic fiber orientation, with the intention to provide experimental data (both mechanically and by SSI) that will be used as input for a computational study. The study is therefore subject to limitations. The most important limitation is the fact that measurements are limited to only one (fresh) sample that was obtained from the pathology department of the veterinary school, harvested from a horse that had been euthanized for clinical reasons. Further, our histological data did not allow us to draw hard conclusions. It is only in an indirect way that we can assume that the fibers were circumferentially oriented. Histology did show homogeneous tissue, confirmed by minor SWS changes across depth and low standard deviation values.
Moreover, more complicated setups (including flow and surrounding tissues) would be more appropriate in mim-icking in vivo shear wave propagation. From a practical perspective, our mechanical testing machine did not allow positioning the grips when the tissue is submerged in water (mimicking the blood). Future experiments should consider both the arterial tissue and the surrounding tissues to allow leakage of the shear waves.
In conclusion, we have reported on a unique experiment in which we performed simultaneous mechanical and SSI measurements on an equine aorta ex vivo. We consider this an important and necessary feasibility study to establish the performance of SSI measurements in more complex arterial setups. These data will be used to develop numerical models
studying SW propagation in bulk anisotropic tissues, with the final aim of giving more insight into the feasibility of SSI in human arteries.
Conflict of Interests
This is to confirm that there was no conflict of interests while working on this paper. The authors disclose no competing financial and personal interests. All the authors mentioned were fully involved in working on this paper. There was no other funding or people involved expected for those mentioned and acknowledged in the paper.
Acknowledgments
Darya Shcherbakova is Ph.D. Fellow of the Research Foun-dation-Flanders (FWO-Vlaanderen). Abigail Swillens is Post-doctoral Fellow of FWO-Vlaanderen. The authors gratefully acknowledge the financial support of the CWO, Faculty of Engineering and Architecture, Ghent University.
References
[1] S. Laurent, S. Katsahian, C. Fassot et al., “Aortic stiffness is an in-dependent predictor of fatal stroke in essential hypertension,”
Stroke, vol. 34, no. 5, pp. 1203–1206, 2003.
[2] F. U. S. Mattace-Raso, T. J. M. van der Cammen, A. Hofman et al., “Arterial stiffness and risk of coronary heart disease and stroke: the Rotterdam Study,” Circulation, vol. 113, no. 5, pp. 657– 663, 2006.
[3] M. F. O’Rourke, J. A. Staessen, C. Vlachopoulos, D. Duprez, and G. E. Plante, “Clinical applications of arterial stiffness; defini-tions and reference values,” The American Journal of
Hyperten-sion, vol. 15, no. 5, pp. 426–444, 2002.
[4] C. Vlachopoulos, K. Aznaouridis, and C. Stefanadis, “Predic-tion of cardiovascular events and all-cause mortality with arte-rial stiffness: a systematic review and meta-analysis,” Journal of
the American College of Cardiology, vol. 55, no. 13, pp. 1318–1327,
2010.
[5] J. L. Cavalcante, J. A. C. Lima, A. Redheuil, and M. H. Al-Mallah, “Aortic stiffness: current understanding and future directions,”
Journal of the American College of Cardiology, vol. 57, no. 14, pp.
1511–1522, 2011.
[6] T. T. van Sloten, M. T. Schram, K. van den Hurk et al., “Local stiffness of the carotid and femoral artery is associated with incident cardiovascular events and all-cause mortality: the hoorn study,” Journal of the American College of Cardiology, vol. 63, no. 17, pp. 1739–1747, 2014.
[7] T. W. Hansen, J. A. Staessen, C. Torp-Pedersen et al., “Prognostic value of aortic pulse wave velocity as index of arterial stiffness in the general population,” Circulation, vol. 113, no. 5, pp. 664–670, 2006.
[8] E. Hermeling, K. D. Reesink, R. S. Reneman, and A. P. G. Hoeks, “Measurement of local pulse wave velocity: effects of signal processing on precision,” Ultrasound in Medicine and Biology, vol. 33, no. 5, pp. 774–781, 2007.
[9] L. M. van Bortel, S. Laurent, P. Boutouyrie et al., “Expert consensus document on the measurement of aortic stiffness in daily practice using carotid-femoral pulse wave velocity,”
Journal of Hypertension, vol. 30, no. 3, pp. 445–448, 2012.
[10] A. Mookerjee, A. M. Al-Jumaily, and A. Lowe, “Arterial pulse wave velocity measurement: different techniques, similar results-implications for medical devices,” Biomechanics and
Modeling in Mechanobiology, vol. 9, no. 6, pp. 773–781, 2010.
[11] A. W. Khir, A. O’Brien, J. S. R. Gibbs, and K. H. Parker, “Determination of wave speed and wave separation in the arteries,” Journal of Biomechanics, vol. 34, no. 9, pp. 1145–1155, 2001.
[12] J. Feng and A. W. Khir, “Determination of wave speed and wave separation in the arteries using diameter and velocity,” Journal
of Biomechanics, vol. 43, no. 3, pp. 455–462, 2010.
[13] S. I. Rabben, S. Bjærum, V. Sørhus, and H. Torp, “Ultrasound-based vessel wall tracking: an auto-correlation technique with RF center frequency estimation,” Ultrasound in Medicine and
Biology, vol. 28, no. 4, pp. 507–517, 2002.
[14] J. M. Meinders, L. Kornet, P. J. Brands, and A. P. G. Hoeks, “Assessment of local pulse wave velocity in arteries using 2D distension waveforms,” Ultrasonic Imaging, vol. 23, no. 4, pp. 199–215, 2001.
[15] A. Eriksson, E. Greiff, T. Loupas, M. Persson, and P. Pesque, “Arterial pulse wave velocity with tissue doppler imaging,”
Ultrasound in Medicine and Biology, vol. 28, no. 5, pp. 571–580,
2002.
[16] K. Fujikura, J. Luo, V. Gamarnik et al., “A novel noninvasive technique for pulse-wave imaging and characterization of clinically-significant vascular mechanical properties in vivo,”
Ultrasonic Imaging, vol. 29, no. 3, pp. 137–154, 2007.
[17] R. X. Li, J. Luo, S. K. Balaram, F. A. Chaudhry, D. Shahmirzadi, and E. E. Konofagou, “Pulse wave imaging in normal, hyperten-sive and aneurysmal human aortas in vivo: a feasibility study,”
Physics in Medicine and Biology, vol. 58, no. 13, pp. 4549–4562,
2013.
[18] J. M. Boese, M. Bock, S. O. Schoenberg, and L. R. Schad, “Es-timation of aortic compliance using magnetic resonance pulse wave velocity measurement,” Physics in Medicine and Biology, vol. 45, no. 6, pp. 1703–1713, 2000.
[19] A. L. Wentland, T. M. Grist, and O. Wieben, “Review of MRI-based measurements of pulse wave velocity: a biomarker of arterial stiffness,” Cardiovascular Diagnosis and Therapy, vol. 4, no. 2, pp. 193–206, 2014.
[20] M. Pernot, K. Fujikura, S. D. Fung-Kee-Fung, and E. E. Konofagou, “ECG-gated, mechanical and electromechanical wave imaging of cardiovascular tissues in vivo,” Ultrasound in
Medicine and Biology, vol. 33, no. 7, pp. 1075–1085, 2007.
[21] L. Sandrin, B. Fourquet, J.-M. Hasquenoph et al., “Transient elastography: a new noninvasive method for assessment of hepatic fibrosis,” Ultrasound in Medicine and Biology, vol. 29, no. 12, pp. 1705–1713, 2003.
[22] K. Nightingale, S. McAleavey, and G. Trahey, “Shear-wave gen-eration using acoustic radiation force: in vivo and ex vivo results,” Ultrasound in Medicine and Biology, vol. 29, no. 12, pp. 1715–1723, 2003.
[23] J. Bercoff, S. Chaffai, M. Tanter et al., “In vivo breast tumor detection using transient elastography,” Ultrasound in Medicine
and Biology, vol. 29, no. 10, pp. 1387–1396, 2003.
[24] L. Zhai, J. Madden, W. C. Foo et al., “Acoustic radiation force impulse imaging of human prostates ex vivo,” Ultrasound in
Medicine and Biology, vol. 36, no. 4, pp. 576–588, 2010.
[25] J. L. Gennisson, C. Cornu, S. Catheline, M. Fink, and P. Portero, “Human muscle hardness assessment during incremental iso-metric contraction using transient elastography,” Journal of
Biomechanics, vol. 38, no. 7, pp. 1543–1550, 2005.
[26] M. Derieppe, Y. Delmas, J.-L. Gennisson et al., “Detection of intrarenal microstructural changes with supersonic shear wave elastography in rats,” European Radiology, vol. 22, no. 1, pp. 243– 250, 2012.
[27] R. R. Bouchard, S. J. Hsu, P. D. Wolf, and G. E. Trahey, “In vivo cardiac, acoustic-radiation-force-driven, shear wave velocimet-ry,” Ultrasonic Imaging, vol. 31, no. 3, pp. 201–213, 2009. [28] M. Pernot, M. Couade, P. Mateo, B. Crozatier, R. Fischmeister,
and M. Tanter, “Real-time assessment of myocardial contractil-ity using shear wave imaging,” Journal of the American College
of Cardiology, vol. 58, no. 1, pp. 65–72, 2011.
[29] J. D'Hooge, A. Heimdal, F. Jamal et al., “Regional strain and strain rate measurements by cardiac ultrasound: principles, implementation and limitations,” European Journal of
Echocar-diography, vol. 1, no. 3, pp. 154–170, 2000.
[30] H. H. G. Hansen, A. E. C. M. Saris, N. R. Vaka, M. M. Nillesen, and C. L. de Korte, “Ultrafast vascular strain compounding using plane wave transmission,” Journal of Biomechanics, vol. 47, no. 4, pp. 815–823, 2014.
[31] R. M. Lerner, S. R. Huang, and K. J. Parker, “’Sonoelastic-ity’ images derived from ultrasound signals in mechanically vibrated tissues,” Ultrasound in Medicine and Biology, vol. 16, no. 3, pp. 231–239, 1990.
[32] J. Ophir, I. C´espedes, H. Ponnekanti, Y. Yazdi, and X. Li, “Elas-tography: a quantitative method for imaging the elasticity of biological tissues,” Ultrasonic Imaging, vol. 13, no. 2, pp. 111–134, 1991.
[33] M. Couade, M. Pernot, C. Prada et al., “Quantitative assessment of arterial wall biomechanical properties using shear wave imaging,” Ultrasound in Medicine & Biology, vol. 36, pp. 1662– 1676, 2010.
[34] L. Xu, J. Chen, K. J. Glaser, M. Yin, P. J. Rossman, and R. L. Ehman, “MR elastography of the human abdominal aorta: a preliminary study,” Journal of Magnetic Resonance Imaging, vol. 38, no. 6, pp. 1549–1553, 2013.
[35] A. J. Nederveen, S. Avril, and L. Speelman, “MRI strain imaging of the carotid artery: present limitations and future challenges,”
Journal of Biomechanics, vol. 47, no. 4, pp. 824–833, 2014.
[36] K. R. Nightingale, M. L. Palmeri, R. W. Nightingale, and G. E. Trahey, “On the feasibility of remote palpation using acoustic radiation force,” Journal of the Acoustical Society of America, vol. 110, no. 1, pp. 625–634, 2001.
[37] A. P. Sarvazyan, O. V. Rudenko, S. D. Swanson, J. B. Fowlkes, and S. Y. Emelianov, “Shear wave elasticity imaging: a new ultrasonic technology of medical diagnostics,” Ultrasound in Medicine and
Biology, vol. 24, no. 9, pp. 1419–1435, 1998.
[38] E. E. Konofagou and K. Hynynen, “Localized harmonic motion imaging: theory, simulations and experiments,” Ultrasound in
Medicine and Biology, vol. 29, no. 10, pp. 1405–1413, 2003.
[39] S. Chen, M. W. Urban, C. Pislaru et al., “Shearwave dispersion ultrasound vibrometry (SDUV) for measuring tissue elasticity and viscosity,” IEEE Transactions on Ultrasonics, Ferroelectrics,
and Frequency Control, vol. 56, no. 1, pp. 55–62, 2009.
[40] J. Bercoff, M. Tanter, and M. Fink, “Supersonic shear imaging: a new technique for soft tissue elasticity mapping,” IEEE
Transac-tions on Ultrasonics, Ferroelectrics, and Frequency Control, vol.
51, no. 4, pp. 396–409, 2004.
[41] J. Bercoff, G. Montaldo, T. Loupas et al., “Ultrafast compound doppler imaging: providing full blood flow characterization,”
IEEE Transactions on Ultrasonics, Ferroelectrics, and Frequency Control, vol. 58, no. 1, pp. 134–147, 2011.
[42] P. R. Hoskins, “Physical properties of tissues relevant to arterial ultrasound imaging and blood velocity measurement,”
Ultra-sound in Medicine and Biology, vol. 33, no. 10, pp. 1527–1539,
2007.
[43] A. van der Horst, C. N. van den Broek, F. N. van de Vosse, and M. C. M. Rutten, “The fiber orientation in the coronary arterial wall at physiological loading evaluated with a two-fiber constitutive model,” Biomechanics and Modeling in Mechanobiology, vol. 11, no. 3-4, pp. 533–542, 2012.
[44] L. Horny, T. Adamek, and M. Kulvajtova, “Analysis of axial prestretch in the abdominal aorta with reference to post mortem interval and degree of atherosclerosis,” Journal of the
Mechanical Behavior of Biomedical Materials, vol. 33, no. 1, pp.
93–98, 2014.
[45] G. A. Holzapfel, T. C. Gasser, and R. W. Ogden, “A new consti-tutive framework for arterial wall mechanics and a comparative study of material models,” Journal of Elasticity and the Physical
Science of Solids, vol. 61, no. 1–3, pp. 1–48, 2000.
[46] H. Weisbecker, C. Viertler, D. M. Pierce, and G. A. Holzapfel, “The role of elastin and collagen in the softening behavior of the human thoracic aortic media,” Journal of Biomechanics, vol. 46, no. 11, pp. 1859–1865, 2013.
[47] R. G. P. Lopata, M. F. J. Peters, J. Nijs, C. W. J. Oomens, M. C. M. Rutten, and F. N. van de Vosse, “Vascular elastography: a validation study,” Ultrasound in Medicine and Biology, vol. 40, pp. 1882–1895, 2014.
[48] K. V. Ramnarine, J. W. Garrard, K. Dexter, S. Nduwayo, R. B. Panerai, and T. G. Robinson, “Shear wave elastography assessment of carotid plaque stiffness: in vitro reproducibility study,” Ultrasound in Medicine and Biology, vol. 40, no. 1, pp. 200–209, 2014.