HAL Id: hal-03150946
https://hal.sorbonne-universite.fr/hal-03150946
Submitted on 24 Feb 2021
HAL is a multi-disciplinary open access
archive for the deposit and dissemination of
sci-entific research documents, whether they are
pub-lished or not. The documents may come from
teaching and research institutions in France or
abroad, or from public or private research centers.
L’archive ouverte pluridisciplinaire HAL, est
destinée au dépôt et à la diffusion de documents
scientifiques de niveau recherche, publiés ou non,
émanant des établissements d’enseignement et de
recherche français ou étrangers, des laboratoires
publics ou privés.
preserves muscle integrity in Duchenne muscular
dystrophy
Marco Segatto, Roberta Szokoll, Raffaella Fittipaldi, Cinzia Bottino, Lorenzo
Nevi, Kamel Mamchaoui, Panagis Filippakopoulos, Giuseppina Caretti
To cite this version:
Marco Segatto, Roberta Szokoll, Raffaella Fittipaldi, Cinzia Bottino, Lorenzo Nevi, et al.. BETs
inhibition attenuates oxidative stress and preserves muscle integrity in Duchenne muscular dystrophy.
Nature Communications, Nature Publishing Group, 2020, 11 (1), pp.6108.
�10.1038/s41467-020-19839-x�. �hal-03150946�
BETs inhibition attenuates oxidative stress and
preserves muscle integrity in Duchenne muscular
dystrophy
Marco Segatto
1,2,5
, Roberta Szokoll
1,5
, Raffaella Fittipaldi
1
, Cinzia Bottino
1
, Lorenzo Nevi
1
, Kamel Mamchaoui
3
,
Panagis Filippakopoulos
4
& Giuseppina Caretti
1
✉
Duchenne muscular dystrophy (DMD) affects 1 in 3500 live male births. To date, there is no
effective cure for DMD, and the identification of novel molecular targets involved in disease
progression is important to design more effective treatments and therapies to alleviate DMD
symptoms. Here, we show that protein levels of the Bromodomain and extra-terminal domain
(BET) protein BRD4 are signi
ficantly increased in the muscle of the mouse model of DMD,
the mdx mouse, and that pharmacological inhibition of the BET proteins has a bene
ficial
outcome, tempering oxidative stress and muscle damage. Alterations in reactive oxygen
species (ROS) metabolism are an early event in DMD onset and they are tightly linked to
in
flammation, fibrosis, and necrosis in skeletal muscle. By restoring ROS metabolism, BET
inhibition ameliorates these hallmarks of the dystrophic muscle, translating to a bene
ficial
effect on muscle function. BRD4 direct association to chromatin regulatory regions of the
NADPH oxidase subunits increases in the mdx muscle and JQ1 administration reduces BRD4
and BRD2 recruitment at these regions. JQ1 treatment reduces NADPH subunit transcript
levels in mdx muscles, isolated myofibers and DMD immortalized myoblasts. Our data
highlight novel functions of the BET proteins in dystrophic skeletal muscle and suggest that
BET inhibitors may ameliorate the pathophysiology of DMD.
https://doi.org/10.1038/s41467-020-19839-x
OPEN
1Department of Biosciences, Università degli Studi di Milano, Via Celoria 26, 20133 Milan, Italy.2Department of Biosciences and Territory, University of Molise, Contrada Fonte Lappone, Pesche (Is), Italy.3Sorbonne Université, Inserm, Institut de Myologie, U974, Center for Research in Myology, 47 Boulevard de l’hôpital, 75013 Paris, France.4Structural Genomics Consortium, Old Road Campus Research Building, Nuffield Department of Medicine, Oxford OX3 7DQ, UK.5These authors contributed equally: Marco Segatto, Roberta Szokoll. ✉email:giuseppina.caretti@unimi.it
123456789
D
uchenne muscular dystrophy (DMD) is the most
com-mon form of muscular dystrophy. This X-linked recessive
disorder is caused by mutations in the dystrophin gene,
and it affects approximately 1 in 3500 male births worldwide
1.
A decisive therapy for DMD treatment is not available yet.
Genome editing approaches hold extensive promise for a future
resolutive strategy to pursue
2, but current clinical approaches are
still not effective in reversing the phenotype. Thus, pre-clinical
and clinical studies are focusing on pharmacological therapies
targeting downstream events of the genetic mutation, including
inflammation, fibrosis, adipocyte infiltration, and metabolism
3.
Dystrophin is a large structural protein located at the
sarco-lemma that mechanically links the internal cytoskeleton to the
extracellular matrix, thus conferring membrane stability during
contraction
4. Lack of dystrophin dramatically increases the
sar-colemma susceptibility to contraction-induced injury, leading to
myofiber necrosis and triggering secondary events, such as
inflammation and fibrosis
5.
The direct molecular mechanisms for loss of muscle function in
mouse models and DMD patients are still under active
investi-gation. Several aberrant processes (e.g., intracellular calcium
homeostasis, inflammation and ROS metabolism) are indeed
implicated as early events in the disease pathophysiology
6–8, since
they result in the activation of calcium-dependent degradative
pathways, myofibrils damage and necrosis, incomplete
regenera-tion cycles, autophagy impairment, increased
fibrosis and adipose
tissue accumulation
9–13. In particular, muscle biopsies from DMD
patients show increased oxidative stress compared to controls
14,15and increased NADPH oxidase (Nox2) activity as an early event in
the disease onset
7,16, preceding immune cells infiltration and
necrosis
7. Increased oxidative stress has been recently causally
linked to autophagy impairment in the mdx dystrophic muscle
13and the genetic elimination of Nox2-mediated ROS production
has been reported to reduce inflammation and fibrosis
13,17.
Gene expression profiles of skeletal muscle are altered in
muscular dystrophies
18–20and the epigenetic regulation of
muscle stem cells plays a crucial role for their regenerative
potential in the mdx model
21–25. In addition, dystrophin loss
leads to alteration in signaling pathways that eventually translate
in transcriptional reprogramming.
For
example,
histone-deacetylase (HDAC) activity is perturbed by dystrophin
defi-ciency and this contributes to transcriptional alteration in mdx
mice
26,27. Furthermore, epigenetic drugs targeting HDACs are in
clinical trial for DMD and showed promising results in the
his-tological progression of the disease
28–30.
We have recently shown that the BET protein BRD4 promotes
muscle atrophy in an in vitro model of glucocorticoid-induced
atrophy and in experimental models of cancer cachexia
31,32.
Because of this evidence and the well-established role played by
BRD4 in inflammation
33–35, we aimed to characterize BRD4
contribution in skeletal muscle pathophysiology of a mouse
model of DMD. In this study, we show that BRD4 influences ROS
metabolism by regulating the transcriptional activation of
dif-ferent subunits of the NADPH oxidase complex in the mdx
muscle. Furthermore, administration of the BET inhibitor JQ1
reduces oxidative stress and ameliorates skeletal muscle
mor-phology and muscle function. JQ1 treatment rescues autophagy
and dramatically restricts muscle damage, preventing muscle
inflammation and fibrosis, and tempering muscle regeneration.
Results
BRD4 levels increase in the muscle of DMD patients and of the
mdx mouse. The involvement of BET proteins in inflammatory
processes and in skeletal muscle homeostasis
31–34prompted us to
study their role in the mdx muscle. First, we examined their
protein levels in tibialis anterior (TA) of control and mdx mice.
BRD2 and BRD3 abundance was comparable in muscles from
control and mdx mice, whereas BRD4 protein levels were
sig-nificantly increased in the dystrophic muscle (Fig.
1
a). Notably,
the BRD4 antibody specificity was ascertained by silencing
experiments (Supplementary Fig. 1A). Conversely, BRD2/3/4
transcripts were expressed at a similar rate both in control and
mdx TAs, suggesting that post-transcriptional events are involved
in BRD4 regulation (Fig.
1
b). We next analyzed BRD4 levels in
DMD muscle samples, and found that BRD4 protein was higher
in muscles of DMD patients than in age-matched controls
(Fig.
1
c). We, therefore, interrogated RNA-Seq results published
by Khairallah et al.
36and found that BET transcript levels do not
significantly change in DMD muscles (Fig.
1
d).
Overall, these data show that BRD4 levels are higher in the
muscle of Duchenne patients and in the mdx skeletal muscle,
prompting us to further characterize BRD4 function in the mouse
model for DMD.
JQ1 treatment reduces muscle damage in the mdx mouse.
Based on our initial data (Fig.
1
) and our previous observation
that BRD4 blockade ameliorates glucocorticoid-induced atrophy
in C2C12 myotubes, as well as taking into account the
well-documented anti-inflammatory effect of BET inhibitors
33,35we
hypothesized that JQ1 treatment may ameliorate the dystrophic
phenotype in the mdx mouse model of DMD.
We daily treated 10-week-old mdx mice with JQ1 (20 mg/kg
per day) by intraperitoneal injection for two weeks and
performed morphological studies on TA muscle sections to
examine the effects of BET inhibition on the histopathology of
dystrophic mdx muscle
fibers. Hematoxylin/eosin staining
confirmed the presence of a distinctive pattern of dystrophic
muscle pathology in vehicle-treated mdx mice, evidenced by
mononuclear cell infiltration and centrally located nuclei.
Conversely, the number of infiltrating inflammatory cells was
reduced in muscles of JQ1-treated mdx mice (Fig.
2
a). In
addition, cellular membrane permeability and subsequent
fiber
necrosis was reduced by JQ1 treatment, as revealed by the
decreased number of Evans blue positive
fluorescent cells (Fig.
2
c).
While the total number of
fibers per area was identical in the mdx
and JQ1-treated mdx muscles (Supplementary Fig. 2A), JQ1
administration significantly increased the number of peripherally
nucleated
fibers and decreased the centrally nucleated fibers
(Fig.
2
b), further suggesting that muscles from JQ1-treated mdx
mice were less vulnerable to mechanical stress. The increased
resistance to the dystrophic phenotype was also associated with
reduced cell death, as revealed by the decreased levels of cleaved
caspase-3 (Fig.
2
d). As previously reported
37, succinate
dehy-drogenase (SDH) staining decreased in the mdx muscle compared
to WT; however the staining intensity was recovered to that of the
WT in JQ1-treated mdx mice (Fig.
2
e and Supplementary
Fig. 2B), indicating an improved energy metabolism following
JQ1 administration, in the mdx TA muscle. Overall these data
hint for a beneficial effect of JQ1 treatment in skeletal muscle of
mdx mice.
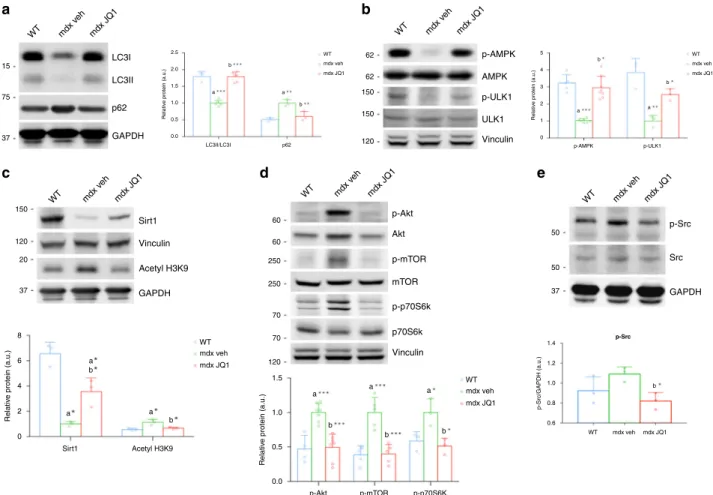
JQ1 restores autophagy in the mdx muscle. To elucidate the
molecular mechanisms underlying JQ1 beneficial effects in the
mdx skeletal muscle, we investigated JQ1 impact on key
meta-bolic processes, which are affected by the mdx physiopathology.
Recent reports revealed that autophagy suppression contributes
to the symptomatology of different forms of muscular dystrophies
and is detrimental for the maintenance of muscle
home-ostasis
12,38. To test whether autophagy recovery was, at least in
morphology, we examined the abundance of proteins involved in
autophagy/lysosomal pathways and tested whether they were
influenced by JQ1 treatment. As demonstrated by other
reports
11,12,39, we found that the ratio between LC3II (the active
lipidated LC3 form) and LC3I (the cytosolic inactive LC3 form)
was reduced in TA muscles from vehicle-treated mdx mice. JQ1
treatment restored LC3II/LC3I ratios to levels comparable to the
ones observed in control animals. Concurrently, p62 levels, which
were upregulated in the mdx muscle, were comparable to those of
control mice in TAs of JQ1-treated mdx mice (Fig.
3
a). We
concluded that JQ1 treatment promotes restoration of autophagy
in the mdx mouse model. The rescue in autophagy could not be
explained by a JQ1-mediated effect on transcriptional regulation
of autophagy genes, because mRNA levels of a group of key
autophagy genes did not increase following JQ1 treatment
(Supplementary Fig. 3A). We, therefore, interrogated the
activa-tion state of different signaling pathways known to regulate
autophagy. The metabolic sensor AMPK is a potent inducer of
autophagy and its activation is known to decrease in mdx muscles
when compared to control animals
39–41. We observed that JQ1
administration was able to fully restore p-AMPK (Ser172)
phosphorylation in mdx TAs. Likewise, AMPK-dependent
phosphorylation of Ulk1 (Ser555), which plays a crucial role in
autophagy initiation, was also upregulated in TAs from
JQ1-treated mdx mice (Fig.
3
b). In agreement with previous reports,
AMPK phosphorylation correlated with Sirt1 protein levels
42,43,
which were dramatically decreased in muscles from mdx mice.
Sirt1 protein levels were recovered following JQ1 treatment.
Consistent with this evidence, acetylation on histone H3 lysine 9
(H3-K9Ac) was upregulated in muscles from mdx mice and
decreased following JQ1 administration (Fig.
3
c).
Consistent with a rescue in autophagy, JQ1 treatment also
mitigated the upregulation of Akt/mTOR/p70S6k pathway in the
mdx muscle, and it led to activation levels for these kinases
comparable to the ones observed in control animals (Fig.
3
d).
Oxidative stress-dependent activation of the Src kinase has
been causally linked to Akt activation and subsequent autophagy
flux impairment, in the mdx mouse
13. Immunoblot analysis
revealed that JQ1 treatment reduced Src phosphorylation in TAs
from mdx mice (Fig.
3
e), suggesting that autophagy rescue may
be related to an upstream decrease in oxidative stress. Taken
together these data suggest that JQ1 treatment restores autophagy
in the mdx skeletal muscles.
JQ1 restrains oxidative stress. To further investigate JQ1 impact
on ROS metabolism in the mdx muscle, we asked whether ROS
levels were affected by JQ1 treatment in C2C12 cells, in which
previously published RNA-seq datasets show that BRD2/3/4 are
highly expressed, with BRD2 transcript being the most abundant
followed by BRD4 and then BRD3
23,44–46. We
first performed
immunofluorescence experiments with anti-8-OHdG antibody,
which confirmed increased oxidative stress in the mdx muscle,
when compared to control muscles
47. JQ1 treatment significantly
reduced 8-OHdG immunoreactivity, in TAs (Fig.
4
a).
To investigate whether JQ1 was able to protect cells from a
second source of ROS, we also employed an in vitro model in
which oxidative stress was induced by hydrogen peroxide (H
2O
2)
treatment in C2C12 cells. In agreement with our in vivo
findings,
JQ1 treatment prevented H
2O
2-induced oxidative stress, as
revealed by 8-OHdG staining (Fig.
4
b). Moreover, H
2O
2treatment
was able to impair autophagy in C2C12 myotubes in which the
autophagic
flux was blocked by chloroquine, as indicated by the
pattern of LC3II and p62. Nevertheless, co-administration of JQ1
to H
2O
2-treated cells restored LC3II abundance and reduced p62
levels, as observed for mdx muscles in Fig.
4
c.
WT Ctrl Ctrl DMD Ctrl DMD DMD DMD DMD mdx WT mdx WT mdx 150
a
Brd4 Brd4 Brd2 Brd3 Brd4 Brd2 Brd3 Brd4 Brd2 Brd3 4 2.0 1.5 1.0 0.5 0.0 3 2 1 0 Relativ e prote in (a.u.) Relativ e mRNA e x pression 20 18 16 14 12 10 RPKM Brd2 Brd3 Vinculin Brd4 Vinculin 100 100 120 150 150 1 1.3 6.6 2 2.3 3.4b
c
d
Fig. 1 BRD4 protein levels are higher in DMD and mdx muscles. a Representative images for immunoblot of BRD2, BRD3, and BRD4 in WT and mdx mice. Vinculin is used as a loading control. Right panel, signal quantification was performed with ImageJ. Data are expressed as the mean ± SD, n = 3, **denotes P < 0.01 was determined by using unpaired two-sided t-test. a indicates statistical significance compared to the control group. b RNA of control and mdx mice was analyzed for BRD2 (WT,n = 4; mdx, n = 4), BRD3 (WT, n = 4; mdx, n = 4) and BRD4 (WT, n = 7; mdx, n = 5) levels by qRT-PCR. Data were normalized against HPRT. Data are expressed as the mean ± SD, statistical significance was calculated using unpaired two-sided t-test. c Immunoblot analysis of paravertebral muscle specimen from Duchenne patients (n = 4) and healthy controls (n = 2). Normalized band intensity in immunoblots is reported above signals.d RPKM expression levels of BRD4 transcript in previously reported RNA-Seq dataset for DMD (n = 6) and healthy donors (n = 6). Data are expressed as the mean ± SD.
In several cultured cell lines, defined doses of H
2O
2were able to
induce a reduction in p-AMPK levels
48–51. Similarly, in C2C12
myotubes, oxidative stress generated by H
2O
2administration led to a
decrease in AMPK and AMPK-dependent Ulk1 phosphorylation,
and was associated with an increase in Akt phosphorylation (Ser473);
however, all these events were prevented by JQ1 co-treatment
(Fig.
4
d).
Oxidative stress was previously shown to induce Sirt1
carbonylation and proteasomal degradation
52. H
2
O
2treatment
reduced Sirt1 abundance in C2C12 myotubes, as reported
53(Fig.
4
d). However, JQ1 co-treatment prevented H
2O
2-induced
Sirt1 protein reduction, as revealed by a degradation assay
(Fig.
4
d, Supplementary Fig. 4A). Moreover, to link Sirt1 activity
with p-AMPK levels, we challenged Sirt1 function with
nicotinamide (NAM) and we observed that JQ1-mediated
recovery in AMPK phosphorylation was dependent on Sirt1
activity,
in
H
2O
2-treated
myotubes.
Coherently,
AMPK-dependent phosphorylation of Ulk1 was also influenced by Sirt1
inhibition (Supplementary Fig. 4B). To test whether JQ1 is
effective when oxidative stress is already established, we
administered JQ1 after treating C2C12 myotubes with H
2O
2for
2 hours, a sufficient time to induce oxidative stress in C2C12 cells
(Supplementary Fig. 5A). The modulation of Sirt1, p62, LC3 as
well as of phosphorylated AKT, AMPK and Ulk1 were similar to
the one obtained when cells were pretreated with JQ1, followed by
H
2O
2stimulation (Supplementary Fig. 5B, C). In addition, JQ1
treatment alone did not affect p-AKT and p62 levels, but it
increased Sirt1, lipidated LC3 levels, AMPK and Ulk1
phosphor-ylation (Supplementary Fig. 5B–D). In this experimental setting,
we confirmed that NAM treatment prevented AMPK activation
and Ulk1 phosphorylation (Supplementary Fig. 5C). Moreover,
Sirt1 pharmacological blockade hindered LC3 accumulation and
40 95 90 85 80 75 70 30 1.5 10 8 6 4 2 0 a 1.0 0.5
c-caspase-3 /vinculin (a.u.)
EBD + fibers (% on total area)
100 90 80 70 60 P o sitiv e cells (%) 0.0 20 10 0 P e ri pher al n u
cleated fibers/total fibers (%)
Peripheral nucleated fibers
Evans Blue Dye
centr
ally n
u
cleated fibers/total fibers (%)
Centrally nucleated fibers
mdx veh mdx - veh WT
a
b
c
d
e
mdx JQ1 mdx - JQ1 mdx - veh mdx veh mdx v eh WT WT WT mdx - JQ1 mdx JQ1 mdx veh WT mdx JQ1 mdx veh WT mdx JQ1 mdx - veh WT mdx - JQ1 mdx JQ1 Pro-Casp-3 Cleaved Casp-3 Cleaved caspase-3 SDH GAPDH 37 25 20 15 37 mdx veh mdx JQ1 b a b b aFig. 2 JQ1 treatment leads to morphological improvements in mdx mice. a Hematoxylin/Eosin staining of TA muscles from JQ1- and vehicle-treated mdx mice. JQ1 was chronically administered for two weeks. Scale bar: 50µm. b JQ1 treatment increases the number of intact fibers in mdx TAs. Data are expressed as the mean ± SD,n = 3 animals, *P < 0.05 and **P < 0.01 was determined by using unpaired two-sided t-test. Total fibers and percentage of peripheral (n = 15 sections examined from n = 3 animals for each experimental group) and centrally nucleated (n = 6 sections examined from n = 3 animals for each experimental group)fibers per area were evaluated from Hematoxylin/Eosin staining of TA muscles (n = 3 for each experimental group). c JQ1 treatment strongly decreases the number of damaged myofibers, as observed by the decreased uptake of Evans blue dye from TA mdx muscles (n = 4 for each experimental group). Scale bar: 50 µm. ***denotes P < 0.001 and was determined by 1 way-Anova followed by Tukey’s post hoc test. d Immunoblot showing pro-Caspase-3 and cleaved Caspase-3 in TAs from control, vehicle-, and JQ1-treated mice. Right panel: quantification of band intensity was performed with ImageJ. Data are expressed as the mean ± SD,n = 7 animals for mdx groups, n = 3 animals for WT. **P < 0.01 and ***P < 0.001 were determined by using one-way ANOVA followed by Tukey’s post hoc test. a indicates statistical significance compared to Control group; b indicates statistical significance compared to the mdx mice animal group. e SDH staining from muscle deep region of TAs, from control, vehicle- and JQ1-treated mice. Scale bar: 50µm. Right panel: quantification of SDH staining intensity. Data are expressed as the mean ± SD, n = 4 animals per group. a and b as defined in (d). *Denotes P < 0.05 and was determined by 1 way-Anova followed by Tukey’s post hoc test.
p62 downregulation in cells in which oxidative stress was induced
by H
2O
2followed by JQ1 treatment (Supplementary Fig. 5D),
further supporting the idea that Sirt1 plays a key role in AMPK
activation and autophagy regulation.
Collectively, these data suggest that JQ1 treatment prevented
and tempered perturbation in ROS metabolism both in the
dystrophic muscle and in an in vitro model of oxidative stress,
thus restoring Sirt1 levels, AMPK and Akt phosphorylation state,
and autophagy.
BETs pharmacological blockade prevents NADPH subunit
transcription upregulation. NADPH oxidase subunits are
over-expressed in the adult mdx muscle and they represent a major
source of ROS production in the mdx muscle
7,54,55. Accordingly,
we observed that mRNA levels of the Nox2, Nox4, p67-phox, and
p47-phox subunits were higher in TAs from mdx mice, when
compared to those of control mice. JQ1 treatment in mdx mice
restored the transcripts of NADPH oxidase subunits to the level
of control mice (Fig.
5
a). Similarly, Nox2 and p67-phox protein
levels were higher in TAs from mdx mice when compared to
control mice, but their levels decreased in muscles from
JQ1-treated mdx mice (Fig.
5
b and Supplementary Fig. 6A). Likewise,
when we treated isolated mdx myofibers with JQ1, we observed a
downregulation in transcript levels of the NADPH oxidase
sub-units, suggesting that JQ1-mediated transcriptional regulation can
occur in myofibers, once depleted of infiltrating mononuclear
cells (Fig.
5
c).
We also analyzed transcripts of the NADPH oxidase subunits
in immortalized myoblasts from young DMD donors and
observed that their levels significantly decreased following JQ1
treatment (Fig.
5
d). Likewise, interrogation of RNA-seq datasets,
revealed that Nox2, p47-phox, and p67-phox transcript levels
increased in skeletal muscles from DMD patients
36, extending the
relevance of our
findings to the human pathology (Fig.
5
e).
In the mdx muscle, JQ1 administration did not affect mRNA
and protein levels of Nrf2, a transcription factor that plays a key
role in the antioxidant response pathway (Supplementary Fig. 7A,
B). Likewise, JQ1 treatment did not alter the transcriptional
mdx v eh WT mdx JQ1 mdx v eh WT mdx JQ1 mdx v eh WT mdx JQ1 mdx v eh WT mdx JQ1 mdx v eh WT mdx JQ1 mdx veh WT mdx JQ1 mdx veh WT mdx JQ1 mdx veh mdx JQ1 mdx veh WT mdx JQ1 mdx veh WT mdx JQ1 LC3I p-AMPK AMPK p-ULK1 p-Akt p-mTOR p-p70S6k p70S6k mTOR Akt ULK1 Vinculin LC3II/LC3I p62 LC3II p62 GAPDH GAPDH Acetyl H3K9 Vinculin Vinculin Sirt1 GAPDH Src p-Src 15 62 50 50 37 62 150 150 120 75 37 150 60 60 250 250 70 70 120 120 20 37 2.0 2.5 a b a b 1.5 1.0 0.5 0.0 8 a a b a b b a b a a b b 6 4 2 0 Sirt1 Acetyl H3K9 Relativ e protein (a.u.) 1.5 1.0 0.5 0.0 p-Akt WT p-mTOR p-p70S6K Relativ e protein (a.u.) 1.4 p-Srca
1.2 1.0 0.8 0.6 p-Src/GAPDH (a.u.) Relativ e protein (a.u.) 5 a b b a 4 3 2 1 0 p-AMPK p-ULK1 Relativ e protein (a.u.)b
c
d
e
Fig. 3 BET blockade rescues autophagy in the mdx muscle. a Representative western blot for LC3 (WT,n = 3; mdx, n = 6; mdx+JQ1, n = 6) and p62 (n = 3 for each experimental group) in TA extracts of control and vehicle-and JQ1-treated mice Lower panel: quantification of normalized band intensity. Data represent means ± SD. GAPDH serves as a loading control.b Representative western blot for AMPK and p-AMPK (WT,n = 5; mdx, n = 8; mdx+JQ1, n = 8), Ulk1 and p-Ulk1 (Ser555) (n = 3 for each experimental group) in TA extracts of control and vehicle-and JQ1-treated mice. Lower panel: quantification of normalized band intensity. Data represent means ± SD. Vinculin serves as a loading control. c Representative western blot for Sirt1 and H3K9Ac in TA extracts of control and vehicle-and JQ1-treated mice. GAPDH and Vinculin serve as loading controls. Lower panel: quantification of normalized band intensity. Data represent means ± SD.n = 3 animals per group. d Representative western blot for Akt and p-Akt (Ser473) (WT, n = 4; mdx,n = 7; mdx+JQ1, n = 7), mTOR and p-mTOR (Ser2448) (n = 5 for each experimental group), p70S6K and p-70SK6 (Thr389) (n = 3 for each experimental group) in TA extracts of control and vehicle-and JQ1-treated mice Right panel: quantification of normalized band intensity. Data represent means ± SD. Vinculin serves as a loading control.e Representative western blot for Src and p-Src in TA extracts of control and vehicle-and JQ1-treated mice Lower panel: quantification of normalized band intensity. GAPDH serves as a loading control. Data represent means ± SD. n = 3 per experimental group. In all panels, statistical analysis was performed by using one-way ANOVA followed by Tukey’s post hoc test. In all relevant panels, *P < 0.05; **P < 0.01; ***P < 0.001. a indicates statistical significance compared to control; b indicates statistical significance compared to mdx.
regulation of Nrf2 targets, Hmox1, Gclm and Gclc (Supplementary
Fig. 7C), suggesting that restoration of ROS metabolism was not
ascribed to the transcriptional activation of anti-oxidant genes.
Next, we mimicked ROS induction in C2C12 myotubes, by
treating the cells with 250
μM H
2O
2for 24 h. H
2O
2is a
pro-oxidant that contributes to the generation of a vicious cycle of
ROS production by upregulating NADPH oxidase subunits
through the activation of redox-sensitive transcription
fac-tors
50,56. H
2
O
2treatment promoted p67-phox, p47-phox, Nox2
and Nox4 transcription in C2C12 myotubes, whereas JQ1
co-treatment prevented their transcriptional activation (Fig.
5
f).
H
2O
2-induced upregulation of Nox2 and p67-phox proteins was
also detectable and it was abrogated by JQ1 pre-treatment (Fig.
5
g
and Supplementary Fig. 6B). Similarly, NADPH oxidase subunits
transcriptional upregulation was hindered when JQ1
administra-tion followed H
2O
2treatment (Supplementary Fig. 8A).
JQ1 binds the BET proteins (BRD2, BRD3, BRD4, BRDT) with
different affinity and it is potentially capable of displacing BRD2/
BRD3/BRD4 from chromatin
57. To define which BET protein
plays a major role in NADPH oxidase subunits modulation, we
employed a siRNA approach in C2C12 myoblasts. BRD2
knockdown reduced the transcript levels of Nox2, Nox4,
p47-phox, and p67-p47-phox, while BRD4 depletion did not affect Nox4
mRNA but decreased Nox2, p47-phox, and p67-phox expression.
BRD3 did not influence NADPH subunits expression levels
(Fig.
5
h and Supplementary Fig. 9A, B). Because of BRD2 and
BRD4 ability to modulate NADPH oxidase subunits, we
performed ChIP assays for these two BET proteins in skeletal
8-OHdG WT mdx veh mdx JQ1 0.0 0.5 1.0 1.5 2.0 2.5 a * * * a * b * * *
8-OHdG (mean pixel density)
d
b
a
Vinculin LC3 I LC3 II p62c
Sirt1 p-AMPK p-ULK1 p-Akt 0 1 2 3 4 a * * b * a * * b * * a * * b * * a * * * b * * WT mdx veh mdx JQ1
Relative protein (a.u.)
TA
8-OHdG DAPI 8-OHdG DAPI 8-OHdG DAPI
C2C12
8-OHdG DAPI 8-OHdG DAPI 8-OHdG DAPI
mdx - veh mdx - JQ1 WT H2O2 - JQ1 Ctrl H2O2 Sirt1 p-AMPK AMPK p-Ulk1 p-Akt Akt Vinculin Ulk1 8-OHdG Ctrl H2O2 H2O2+JQ1 0 10 20 30 a * * * b * * *
8-OHdG (mean pixel density)
LC3II/LC3I p62 0.0 0.5 1.0 1.5 2.0 C H2O2 H2O2+JQ1 a * b * a * b *
Relative protein (a.u.)
15 50 120 120 62 62 150 150 60 60 120
-Fig. 4 JQ1 decreases oxidative stress in the mdx muscle and in H2O2-treated cells. a Representative images of 8-OHdG staining of muscle cross-sections
in control, vehicle- and JQ1-treated TAs (n = 6 sections examined from n = 3 animals for each experimental group). Scale bar: 50 µm. Right panel: quantification of the staining. Data are expressed as a mean ± SD. a indicates statistical significance compared to Control group; b indicates statistical significance compared to the mdx mice animal group. b Representative images of 8-OHdG staining of C2C12 cells. Cells were pretreated with JQ1 (200 nM) for 24 h and then stimulated with H2O2for 24 h. Scale bar: 50µm. Right panel: quantification of the staining derived from three independent
experiments.n = 6 fields examined from n = 3 independent experiments. Data are expressed as a mean ± SD. a indicates statistical significance compared to Control cells; b indicates statistical significance compared to the H2O2-treated C2C12.c Representative western blot for LC3 (c,n = 4; H2O2,n = 3;
H2O2+ JQ1, n = 4) and p62 (n = 3 independent experiments) in C2C12 myotube extracts of control and H2O2- and H2O2/JQ1-treated cells for 24 h.
Myotubes were pretreated with JQ1 (200 nM) for 24 h and then stimulated with H2O2for 24 h. In order to study the autophagyflux, the experiment was
performed by pre-treating cells with 30µM of the lysosomotropic agent chloroquine. Vinculin serves as a loading control. Right panel: quantification of normalized band intensity derived from three different experiments. Data represent means ± SD. a indicates statistical significance compared to Control cells; b indicates statistical significance compared to the H2O2-treated C2C12.d Representative western blot for Sirt1, p-AMPK, AMPK, Ulk1, p-Ulk1
(Ser555), Akt, p-Akt (Ser473) in C2C12 myoblast extracts of control and H2O2- and H2O2/JQ1-treated cells. Myotubes were pretreated with JQ1 (200 nM)
for 24 h and then stimulated with H2O2for 24 h. Vinculin serves as a loading control. Right panel: quantification of normalized band intensity derived from
at least four different experiments. Data represent means ± SD,n = 4 independent experiments. a indicates statistical significance compared to Control cells; b indicates statistical significance compared to the H2O2-treated C2C12. In all panels, statistical analysis was assessed by using one-way ANOVA
muscles of control, vehicle- and JQ1-treated mdx mice. We
amplified chromatin regulatory regions that we previously found
to be occupied by BRD4 in TA of control mice by ChIP-seq
assays
32, which were shown to include previously described
regulatory regions
58–63. These experiments disclosed that BRD2
occupies regulatory regions of Nox2, p47-phox, and p67-phox at
a comparable level in control and mdx mice, while BRD2
occupancy at the Nox4 promoter and BRD4 recruitment at the
regulatory regions of Nox2, Nox4, p47-phox, p67-phox subunits
significantly increased in mdx skeletal muscles. In JQ1-treated
mdx mice, BRD4 and BRD2 occupancy was lost in all loci
analyzed (Fig.
5
i). Overall, these
findings revealed that BRD4 and
BRD2 occupy the NADPH oxidase subunits regulatory regions in
the mdx muscle and modulate their transcription. Conversely,
BETs pharmacological blockade prevents NADPH oxidase
subunits transcriptional upregulation in the mdx muscles, in
isolated mdx myofibers, in an in vitro model of oxidative stress,
and in DMD immortalized myoblasts.
3 a a b b b b 2 1 0
Nox2 Nox4 p47-phox p67-phox
Nox2 Nox4 p47-phoxp67-phox Nox2 Nox4 p47-phox
Nox2 Nox4 p47-phox p67-phox
Nox2 Nox4 p47-phox p67-phox
p67-phox Nox2 Nox2 50 67 37 50 67 37
Nox4 p47-phox p67-phox
p67-phox GAPDH Nox2 p67-phox GAPDH Relativ e mRNA e x pression 1.5 1.0 0.5 0.0 Relativ e mRNA e x pression 1.5 2.0 Ctrl siBrd2 siBrd3 siBrd4 1.5 1.0 0.5 0.0 1.0 0.5 0.0 Relativ e mRNA e x pression Relativ e mRNA e x pression 15 10 5 0 RPKM 1.5 1.0 0.8 0.6 0.4 0.2 0.0 Brd4 Brd2 lgG Brd4 Brd2 lgG Brd4 Brd2 lgG Brd4 Brd2 lgG 1.0 0.5 0.0 Relativ e mRNA e x pression % Input 1.5 2.5 1.0 0.8 0.6 0.4 0.2 0.0 2.0 1.5 1.0 0.5 0.0 1.0 0.5 0.0
% Input % Input % Input
Muscle
a
Immortalized DMD cells DMD muscle
Myofibers
C2C12
Nox2 Nox4 p47-phox p67-phox
mdx veh WT mdx JQ1 mdx veh WT DMD DMD Ctrl DMD+JQ1 mdx JQ1 mdx veh mdx JQ1 mdx v eh WT mdx JQ1 H2O2 C H2O2+JQ1 H2 O2 Ctrl H2O 2 +JQ1 a a a a b a b a a b b a b b a b b a a b a b a b a b
b
c
d
e
f
g
h
i
Fig. 5 JQ1 reduces the transcriptional upregulation of NADPH oxidase subunits. a qRT-PCR analysis of Nox2 (WT,n = 4; mdx, n = 6; mdx+JQ1, n = 8), Nox4 (WT,n = 4; mdx, n = 7; mdx+JQ1, n = 8), p47-phox (WT, n = 3; mdx, n = 6; mdx+JQ1, n = 8) and p67-phox (WT, n = 4; mdx, n = 5; mdx+JQ1, n = 8) mRNAs in TAs from control, vehicle-, and JQ1-treated mice. Data are normalized against HPRT and expressed as the mean ± SD.b Representative images of immunoblot analysis for Nox2 and p67-phox in TAs from control, vehicle-, JQ1-treated mice. GAPDH serves as a loading control. WT animals: n = 3 for each experimental group. c qRT-PCR analysis of NADPH oxidase subunit mRNAs in myofibers isolated from mdx EDL muscles and treated with 200 nM JQ1 for 16 h. Data are normalized against HPRT and expressed as the mean ± SD,n = 3 animals. d qRT-PCR analysis of NADPH oxidase subunit mRNAs in immortalized DMD myoblast cells treated with 200 nMJQ1 for 24 h. Data are normalized against GAPDH and expressed as the mean ± SD,n = 3 immortalized cell lines.e RPKM expression levels of NADPH subunit transcripts in published RNA-Seq dataset for DMD (n = 6) and healthy donors (n = 6). Data are expressed as a mean ± SD.f qRT-PCR analysis of Nox2, Nox4, p47 phox (n = 4 for each experimental group) and p67-phox (n = 3 for each experimental group) mRNAs in C2C12 myotubes cells were pretreated with 200 nM JQ1 and then co-treated with 250μM H2O2for 8 h. Data are
normalized against GAPDH and expressed as the mean ± SD.g Representative images of immunoblot analysis for Nox2, p67-phox and BRD4 in C2C12 myoblasts treated as in (e). GAPDH serves as a loading control. h qRT-PCR analysis of Nox2 (Ctrl,n = 5; siBrd2, n = 4; siBrd3, n = 3; siBrd4, n = 3), Nox4 (Ctrl,n = 5; siBrd2, n = 3; siBrd3, n = 5; siBrd4, n = 5), p47-phox (Ctrl, n = 5; siBrd2, n = 6; siBrd3, n = 4; siBrd4, n = 4) and p67-phox (Ctrl, n = 5; siBrd2, n = 5; siBrd3, n = 4; siBrd4, n = 3) subunit mRNAs in C2C12 cells in which BRD2, BRD3, BRD4 levels were decreased by siRNAs transfection. Data are normalized against GAPDH and expressed as the mean ± SD.i ChIP assay with BRD2 and BRD4 antibodies in control, vehicle- and JQ1-treated muscles showing recruitment at regulatory regions of Nox2, Nox4, p47-phox and p67-phox genes. Data represent mean ± SD,n = 3 animals A schematic representation below the diagrams shows the region amplified in ChIP. In all panels, statistical significance was determined by using one-way ANOVA followed by Tukey’s post hoc test. a indicates statistical significance compared to the group presented in the first column; b indicates statistical significance compared to the group presented in the second column. *P < 0.05; **P < 0.01; ***P < 0.001.
JQ1 treatment improves muscle physiopathology in the mdx
muscle. We further tested whether JQ1 treatment was
accom-panied by an overall improvement of the pathological
abnorm-alities of the mdx skeletal muscle. In mdx mice, the p65 subunit of
NFkB is activated by phosphorylation at Ser536 (Fig.
6
a), as a
consequence of increased intracellular Ca
2+64and altered ROS
production
64. NFkB activation, in turn, promotes the
transcrip-tion of pro-inflammatory cytokines. Remarkably, 2 weeks of JQ1
treatment resulted in a significant reduction in p65
phosphor-ylation (Fig.
6
a). Inflammation was mitigated by JQ1 treatment,
as shown by immunostainings for the leukocyte antigen CD45
and the macrophage marker F4/80, which signals were attenuated
following BET blockade (Fig.
6
b). These
findings were supported
by the JQ1-dependent decrease in F4/80 and CD45 protein levels
in TAs of mdx mice (Fig.
6
c). The reduction of inflammatory
infiltrate in TA muscles of JQ1-treated animals was coupled to the
suppression of TNFα (Supplementary Fig. 10A) and of IL6
pathways (Supplementary Fig. 10B–D), two crucial
pro-inflammatory signaling events involved in the pathogenesis of
DMD. Reduction in Fibronectin transcript levels and decreased
collagen
fibers deposition in TAs, revealed by Sirius red staining,
indicated that reduced inflammation was accompanied by a
decrease in
fibrosis following JQ1 administration (Fig.
6
d, e). To
evaluate the impact of JQ1 treatment in older animals, we daily
treated 11 months old mdx mice with JQ1 (20 mg/day) by
intraperitoneal injection, for 4 weeks. At this stage of the disease
progression, JQ1 administration led to a reduction in the
transcript levels of inflammatory markers TNFα and IL6
mdx v eh WT mdx JQ1 mdx v eh WT mdx JQ1 mdx veh WT mdx JQ1 mdx - veh WT mdx - JQ1 Sirius reda
b
Fibronectin mdx - veh WT mdx - JQ1 mdx - veh WT mdx - JQ1 CD45 F4/80 Vinculin mdx v eh WT mdx JQ1 mdx v eh WT mdx JQ1 Vinculin eMyHC Pax7 Alpha tubulin Alpha tubulin dY tubulin dY tubulin Tubulin 6 Tubulin 6 GAPDH Vinculin CD45 CD45 F4/80 F4/80 p65 p-p65 p-p65/vinculin (a.u.) 65 55 50 50 50 37 250 120 150 200 120 1.5 a 1.0 0.5 0.0 65 120 2.0 1.5 a a b b a b 1.0 0.5 0.0 1.5 1.0 0.5 0.0 Relativ e protein (a.u.) Relativ e protein (a.u.) WT mdx veh mdx JQ1 WT mdx veh mdx JQ1 WT mdx veh mdx JQ1 WT mdx veh mdx JQ1 5 4 3 2 1 0 Relativ e mRNA e x pression 60 40 20 0 Collagen area (%) b a a b a a b a b a a bc
d
f
g
h
e
Fig. 6 JQ1 treatment ameliorates pathological phenotypes in dystrophic muscle. a JQ1 administration decreases NFkB p65-Ser536 phosphorylation in TA muscles from mdx mice (n = 5 for each experimental group). Lower panel: quantification of signals was performed with ImageJ. Data are expressed as the mean ± SD. ***P < 0.001. Statistical significance was determined by using one-way ANOVA followed by Tukey’s post hoc test. b Immunohistochemical evaluation of F4/80 and CD45 (n = 3 for each experimental group). Scale bar: 50 µm. c Immunoblot analysis of F4/80 (WT, n = 6; mdx, n = 7; mdx+JQ1, n = 7) and CD45 (WT, n = 6; mdx, n = 8; mdx+JQ1, n = 8) in muscles from control, vehicle- and mdx-treated mice. Vinculin serves as a loading control. Lower panel: quantification of signals was performed with ImageJ. Data are expressed as the mean ± SD. **P < 0.01, ***P < 0.001. Statistical significance was determined by using one-way ANOVA followed by Tukey’s post hoc test. d Sirius red staining shows attenuation of fibrosis in JQ1-treated mice (n = 2 sections examined fromn = 3 WT animals; mdx mice, n = 5 sections examined from n = 3 mdx-veh and mdx-JQ1 animals). Scale bar: 50 µm. Right panel: quantification of staining. **P < 0.01, ***P < 0.001. Statistical significance was determined by using one-way ANOVA followed by Tukey’s post hoc test. e qRT-PCR analysis of Fibronectin mRNA in TA muscles from control (n = 4), vehicle- (n = 3) and mdx-treated (n = 3) mice. Data are normalized against HPRT and expressed as the mean ± SD. *P < 0.05, ***P < 0.001. Statistical significance was determined by using one-way ANOVA followed by Tukey’s post hoc test.f Immunofluorescence analysis with an antibody raised against the regeneration marker Pax7 in TA cross-sectional section of WT and vehicle- or JQ1-treated mdx mice.n = 3 animals for each experimental group. Scale bar: 25 µm. g Immunoblot analysis of Pax7 (WT, n = 7; mdx, n = 6; mdx+JQ1, n = 7) and eMyHC (WT,n = 3; mdx, n = 3; mdx+JQ1, n = 3) levels in TA of WT, vehicle- and JQ1-treated mdx mice. h Immunoblot analysis of alpha tubulin (WT,n = 4; mdx, n = 5; mdx+JQ1, n = 5), dY tubulin (WT, n = 6; mdx, n = 5; mdx+JQ1, n = 5) and tubulin6 (WT, n = 4; mdx, n = 4; mdx+JQ1, n = 3) levels in TA of WT, vehicle- and JQ1-treated mdx mice. Right panel: quantification of signals was performed with ImageJ. Data represent mean ± SD. *P < 0.05, **P < 0.01, ***P < 0.001. Statistical significance was determined by using one-way ANOVA followed by Tukey’s post hoc test.
(Supplementary Fig. 11A), which was paralleled by a decrease in
the levels of CD45 and F4/80 proteins (Supplementary Fig. 11B),
as well as of inflammatory infiltrate (Supplementary Fig. 11C).
BET blockade led to a trend towards increasing the number of
peripheral nucleated
fibers and reducing the centrally nucleated
fibers, although not significantly (Supplementary Fig. 11D).
Fibrosis was reduced in 12-month-old JQ1-treated mdx TAs, as
shown by Sirius red staining (Supplementary Fig. 11E).
Tran-script levels of NADPH oxidase subunits and collagen 1α1 were
also reduced following JQ1 administration (Supplementary
Fig. 11F, G). Overall, these results show that, in the mdx mouse
model, JQ1 treatment has a beneficial impact also when the
disease phenotype is aggravated.
Furthermore, in 12-week-old mdx mice, reduced muscle
damage and inflammation correlated with a more modest
increase in markers of regeneration (eMyHC, Pax7, MyoD, and
Myogenin) in TAs of JQ1 versus vehicle-treated mdx mice, as
observed by protein (Fig.
6
f, g and Supplementary Fig. 12A, C)
and RNA levels (Supplementary Fig. 12B). These data are in
agreement with the observed decrease in centrally nucleated
fibers
(Fig.
2
b). Since a reduction in central nucleated
fibers is a
hallmark of improved muscle histology in the dystrophic muscle,
our data suggest that reduced muscle damage was accompanied
by decreased regeneration. In vitro, JQ1 (200 nM) treatment of
satellite cells did not prevent their ability to differentiate, nor
significantly decreased their proliferation rate (Supplementary
Fig. 12D, E).
In DMD muscles, dystrophin absence alters the cytoskeleton,
which results as a disorganized net of denser microtubules. Since
the microtubules network conveys mechanotransduction signals
to Nox2-dependent enhancement of ROS
17,36,65–67in adult mdx
muscles, we asked whether JQ1 treatment was able to correct
microtubules anomalies that contribute to the DMD pathology.
We confirmed that total and de-tyrosinated alpha-tubulin is
increased in adult mdx muscles, and we found that JQ1 treatment
decreased both alpha-tubulin and de-tyrosinated tubulin (Fig.
6
h).
Tubulin6 protein significantly increased in adult mdx TAs when
compared to control animals
66,67, and JQ1 reduced its levels to
the ones of control mice (Fig.
6
h).
Amelioration of muscle functional performance following JQ1
treatment in mdx mice. In agreement with the overall reduced
muscle damage, JQ1-treated mdx mice significantly increased
resistance to fatigue in the treadmill test, and they showed a
substantial amelioration in endurance. In addition, overall
eva-luation of muscle force employing the inverted screen and the
wire tests also showed improvements in muscle performance and
in vivo force, as early as 2 and 1 week of treatment, respectively
(Fig.
7
a). Significant amelioration was maintained for one week in
the treadmill, wire and inverted screen tests after JQ1 treatment
withdrawal and overall motor function of JQ1-treated mdx mice
returned to levels comparable to vehicle mdx-mice only three
weeks after JQ1 withdrawal (Fig.
7
b).
Taken together, our
findings demonstrate that BET inhibition
ameliorates the physiopathological defects of dystrophic skeletal
muscle, suggesting that BET targeting may be beneficial for
patients with muscular dystrophies.
30 b b b b a a a a b b b a a a a a a a a a a a a b b Treadmill
a
b
Inverted screen test Wire test
Treadmill Inverted screen test Wire test
20 10 0 0 1 2 Weeks 3 4 5 0 1 2 Weeks 3 4 5 0 1 2 Weeks JQ1 withdrawal JQ1 withdrawal JQ1 withdrawal 3 4 5 0 1 2 Weeks 3 4 5 6 0 1 2 Weeks 3 4 5 6 0 1 2 Weeks 3 4 5 6
Running time (min)
4 WT mdx veh mdx JQ1 mdx veh mdx JQ1 40 30 20 10 0 3 2 1 0 Latency to f a ll Score Latency to f a ll (sec) 25 20 15 10 5 0 Latency to f a ll (sec) 4 3 2 1 0 Latency to f a ll Score 30 20 10 0
Running time (min)
Fig. 7 Functional amelioration mediated by JQ1 persists following withdrawal. a Treadmill (WT:n = 3; mdx veh: n ≥ 7; mdx JQ1: n ≥ 8), inverted screen (n = 9 for each experimental group) and wire (wt animals: n = 9; mdx mice: n = 18 for each group) tests were performed on control, vehicle- and mdx-treated mice. Data are expressed as the mean ± SEM). *P < 0.05, **P < 0.01 and ***P < 0.001 were determined by one-way ANOVA followed by Tukey’s post hoc test for the treadmill test and with Kruskal–Wallis test followed by Dunns post hoc for wire and inverted screen tests. a indicates statistical significance compared to Control group; b indicates statistical significance compared to the mdx mice animal group. b Mice were treated with JQ1 or vehicle for 3 weeks and treadmill (n = 3 for each experimental group), inverted screen (n = 9 for each group) and wire (n ≥ 10 for each group) tests were performed once a week, and for additional 3 weeks after JQ1 withdrawal. Data are expressed as the mean ± SEM. *P < 0.05 and **P < 0.01 indicate statistical significance versus mdx-vehicle group, and were determined by one-way ANOVA followed by Tukey’s post hoc test.
Discussion
Alteration in ROS metabolism has been identified as an early
event in Duchenne muscular dystrophy, leading to myonecrosis,
muscle damage and inflammatory cell infiltration
7. Increased
oxidative stress results from an unbalance between increased
production of reactive oxygen/nitrogen species and an insufficient
antioxidant response, leading to myofiber damage and tissue
degeneration. Muscle biopsies from DMD patients show
increased oxidative stress compared to controls
14,15; in mdx
muscles, increased NADPH oxidase Nox2 activity and Src kinase
activation cause an increase in oxidative stress
7,16. Here we show
that BRD4 is involved in transcriptional activation of different
subunits of the NADPH oxidase complex in the mdx muscle and
that BETs pharmacological inhibition dramatically reduces
oxi-dative stress and ameliorates skeletal muscle homeostasis and
muscle function. Increased Nox2 activity and oxidative stress has
been recently causally linked to autophagy impairment in the
mdx muscle. Furthermore, Nox2 genetic ablation ameliorates
pathological and functional phenotypes in dystrophic muscle
13.
Accordingly, we show that JQ1 administration rescues autophagy
and restricts muscle damage, preventing muscle inflammation
and
fibrosis (Fig.
8
). In Duchenne muscular dystrophy several
processes are deregulated and concur to exacerbate the dystrophic
phenotype. Moreover, phagocytic inflammatory cells are a
sig-nificant source of ROS and the reciprocal stimulation between
oxidative stress and inflammation rapidly amplifies the axis
leading to muscle degeneration, throughout disease progression.
In this scenario, the transcription factor p65 plays a pivotal role,
since it is a redox-sensing transcription factor, activated by ROS
increase
68and it concurrently regulates activation of
inflamma-tory transcripts. BRD4 has been shown to play a key role as a
cofactor in promoting transcriptional activation of inflammatory
genes, in sepsis as well as atherogenesis
33–35. Therefore, BRD4
may not only regulate p65-regulated genes indirectly through p65
ROS-mediated activation, but also directly tempering p65
medi-ated transcriptional activation at certain target genes such as
inflammatory cytokines. BET inhibitors ability to concurrently
counteract different processes, such as oxidative stress and
inflammatory pathways (Fig.
8
), may be a key advantage to
pharmacologically target different aspects of the DMD pathology,
through an epigenetic approach. For instance, IL6 transcript
levels may be influenced both by p65 activation and by direct
BRD4 regulation. Restoration of SIRT1 levels by JQ1 treatment
may also potentially contribute to NFkB inactivation via
p65 subunit deacetylation
69.
As shown by our in vitro model of oxidative stress induced by
H
2O
2treatment, Sirt1 protein levels are also vulnerable to ROS,
which lead to Sirt1 post-translational modifications and protein
degradation
69. Notably, Sirt1 protein degradation is prevented by
JQ1 treatment. Modulation of ROS metabolism by JQ1
admin-istration also leads to Sirt1-dependent AMPK activation
(Sup-plementary Figs. S4 and S5), which is consistent with data
observed in the mdx skeletal muscle (Fig.
4
d) and may provide a
link to autophagy restoration, together with changes observed in
Src/Akt axis activation.
Experiments in C2C12 myoblasts, in which oxidative stress was
induced by H
2O
2treatment, suggest that JQ1 ability to decrease
ROS levels represents a more general capability, which can be
extended to different sources of ROS production. Similar results
were also recently reported in chondrocytes
70.
BRD4 level is enhanced in skeletal muscle of DMD patients and
of mdx mice. Other changes in epigenetic factors have been
observed in dystrophic muscle, such as augmented HDAC2 levels
26and increased histone acetylation marks
27. BRD4 stabilization may
lead to altered transcription at specific chromatin domain
char-acterized by acetylated histones, thus taking part to the altered
genome-wide transcriptional program observed in the mdx muscle.
Several factors, such as SPOP
71,72, DUB3
73, PIN1
74, and BRD4
post-translational modifications
75have been involved in BRD4
protein stabilization in cancer models, and further investigation is
warranted to understand the dynamics of BRD4 stabilization in the
DMD and mdx muscle.
BET inhibitors appear to have different effects on C2C12
dif-ferentiation, according to dosage, selected chemical compound
and timing of treatment
31,45,76. The evidence indicating that in
certain experimental conditions BET inhibitors can block
differ-entiation has to be taken into careful account, particularly when
considering potential translational applications with human
experienced BET inhibitors. Nevertheless, our data suggest that
decreased regeneration is associated to reduced damage and
necrosis in the mdx muscle, and precedes the repeated cycles of
degeneration and regeneration triggered by muscle necrosis.
Thus, the positive effects observed in vivo are ascribed to a
beneficial effect on myofiber integrity, which may delay satellite
cell activation and the need for regeneration. In addition, we
employed a relatively low dose of the BET inhibitor, which may
preserve satellite cell proliferation and regeneration potential, as
suggested by our in vitro data on isolated satellite cells.
Overall, our data demonstrate that BET inhibition holds the
potential to counterbalance alterations of ROS metabolism in the
dystrophic skeletal muscle, ameliorating myofibers physiology
and muscle function. Preserving muscle integrity and improving
performance by tuning ROS metabolism may also represent a
promising approach in other conditions in which oxidative stress
plays a pivotal role in skeletal muscle, such as in sarcopenia.
Methods
Animal study experimental design. All procedures involving animal care or treatments were approved by the Italian Ministry of Health and performed in compliance with the guidelines of the Italian Ministry of Health (according to Legislative Decree 116/92), the Directive 2010/63/EU of the European Parliament and the Council on the protection of animals used for scientific purposes (Pro-tocols 3/2014 and 791/2018). C57BL/10ScSn-Dmdmdx/J and control C57BL/ 10ScSnJ mice (Charles River, Italy) were housed in groups offive and maintained
Dystrophin loss
BET inhibitor
Muscle damage and impaired muscle function
NAPDH oxidase
ROS
Membrane permeability Autophagy
Fibrosis Inflammation
Fig. 8 BET treatment and DMD physiopathology. Working model for BET inhibitors effects on functional impairment in dystrophic muscle.
under controlled temperature (20 ± 1 °C), humidity (55 ± 10%), and illumination (12/12 h light cycle with lights on at 07:30 am). Food and water were provided ad libitum. Tubes for tunneling and nesting materials (paper towels) were routinely placed in cages as environmental enrichment. Treatment was performed as in Segatto et al.32. For each litter, half of the mice were randomly allocated in the
control group and half to the treatment group.
Muscle morphological analysis and immunofluorescence. In vivo morpholo-gical evaluation was performed on OCT frozen TA muscles. Transverse, 10-μm thick sections were cut by a cryostat and collected on Superfrost Plus slides (BioOptica). For each TA muscle (n= 3 per experimental group), a minimum of 20 sections were processed for hematoxylin-eosin (H&E) staining or Sirius red and dehydrated and mounted with Eukitt (Kindler GmbH & Co., Germany). Peripheral and centrally nucleatedfibers imaging and analysis was not performed blinded to the treatment group.
For immunofluorescence analysis of TA muscles, 10-μm frozen sections were blocked with 10% Normal Goat Serum (NGS, Vector Laboratories) in PBS with 2,5% Triton-X 100, incubated with HCl for 20 min at RT and then incubated overnight at 4 °C with 8-OHdG antibodies.
Negative controls were performed omitting the primary antibodies. Sections were rinsed with PBS, incubated for 1 h at room temperature with Alexa 488 conjugated goat anti-rabbit IgG in 5% NGS PBS (1:500, Invitrogen Life Technologies, Carlsbad, CA, USA). Slides were mounted with Fluoroshield mounting medium with DAPI (Sigma Aldrich, Italy). Muscle slices were analyzed with a Leica CTR6000 microscope (Leica, Germany) equipped with Leica DFC360 camera (immunofluorescence visualization) and Leica DFC480 (bright field visualization). Images were captured using Leica Application Suite System andfiles were converted in Adobe photoshop CS5 format.
Evans blue. Evans blue dye (EBD) incorporation into necrotic/damagedfibers was assessed as previously reported77. Briefly, EBD (10 mg/ml in PBS) was dissolved
and sterilized by using a 0.2-μm pore size filter. Subsequently, 0.05 ml/10 g body weight of dye solution was intraperitoneally administered to WT, vehicle- and JQ1-treated animals. The mice were then sacrificed 24 h after injection, and TA muscles were collected and immediately frozen in liquid nitrogen-cooled isopentane. Muscles were cut with a cryostat and analysis of EBD uptake was performed on 10-μm muscle cryosections. Muscle sections were fixed in cold acetone at −20 °C for 10 min, washed three times with PBS, coverslipped with aqueous mounting med-ium and evaluated byfluorescence microscopy. Imaging and analysis was not performed blinded to the treatment group.
Treadmill test. Mice were acclimatized to treadmill running with a 10-min run at a constant speed of 6 m/min. During the test sessions, mice were run at an initial speed of 6 m/min, and every 2 min speed was increased by 2 m/min until exhaustion. Thefirst exercise test was used to set the baseline of each experimental group. JQ1 administration was started at the end of the training phase and was continued for the entire period of the exercise test (four weeks).
Wire and inverted screen tests. For wire test (or wire grip test) mice were tested at 1, 2, 3, and 4 weeks from the beginning of JQ1 administration. The animals were allowed to grasp by their four paws a 2-mm diameter metal wire, which was horizontally positioned 35 cm above a padded surface. The observers recorded the time spent on the wire, until the mice fell on the soft bedding. After each fall, the mice were allowed to rest for 1 minute. Each test consisted of three trials, and values derived from each trial were then averaged78.
For the inverted screen test, the animals were tested at 1, 2, 3, and 4 weeks starting from thefirst day of treatment. Mice were placed in the center of a wire mesh screen, which was subsequently rotated to an inverted position over 2 s. The screen was held steadily 40 cm above thick soft bedding. The length of time until the animal fell on the padded surface was recorded. 60 s was considered the cut-off time in each trial79.
Results derived from inverted screen tests were then analyzed by assigning the following scores: Falling between 1 and 10 s= 1; Falling between 11 and 25 s = 2; Falling between 26 and 60 s= 3; Falling after 60 s = 4.
Isolation of EDLfibers and treatment. EDL muscles were surgically isolated and incubated in DMEM containing 0.4% Collagenase type I at 37 °C for 1 h to release singlefibers80. After 1 h in DMEM with 1% penicillin/streptomycin,fibers were
transferred to a new dish in DMEM with 20% FBS, 1% chicken embryo extract and 1% penicillin/streptomycin and treated with JQ1 (200 nM) overnight and Trizol was added for RNA extraction.
C2C12 treatments and immunofluorescence. C2C12 cells (ATCC) were grown in DMEM high glucose with 20%FBS. Cells were pretreated with JQ1 (0.2μM) for 24 h and H2O2(250μM) was added for 8 h or 24 h. For Sirt1 blockade, C2C12
myotubes were co-treated with JQ1 (0.2μM) and Nicotinamide (NAM, 10 mM), 24 h prior to H2O2stimulation. 24 h after H2O2administration, C2C12 myotubes
were harvested and processed for subsequent Western blot analysis. For 8OHdG
staining, immunofluorescence was performed as in Fenizia et al.81, with one
additional step of incubation with 2 N HCl for 20 min at RT, after cellfixation. The samples were examined with a Leica CTR6000 microscope (Leica, Germany) equipped with Leica DFC360 camera (immunofluorescence visualization) and Leica DFC480 (brightfield visualization). Images were captured using Leica Application Suite System andfiles were converted in Adobe Photoshop CS5 format. DAPI was used for nuclear staining.
Degradation assay. Protein degradation assay was performed as in Segatto et al., 201482. Briefly, C2C12 myotubes were treated with vehicle, H
2O2(250 µM) or
co-treated with H2O2(250 µM) and JQ1 (0.2 µM) as already reported. 24 h after H2O2
stimulation, cells were lysed in ice cold 0.01 M Tris-HCl (pH 7.4), 0.150 M sucrose. 30 µg of protein extraction was employed for each reaction. Samples were incu-bated at 37 °C, and the reaction was stopped by the addition of an equal volume of sample buffer (0.125 M Tris-HCl containing 10% SDS, protease inhibitor cocktail, pH 6.8), at different time points (2 h, 4 h, and 8 h). Samples were then boiled for 3 min and used for western blot analysis.
siRNA C2C12 transfection. C2C12 myoblasts were transfected in suspension with siBrd2 (0.1μM), siBrd3 (0.1 μM), siBrd4 (0.1 μM) e siScramble (0.1 μM) (Supple-mentary Table 4), with Lipofectamine 2000 (Thermoscientific), according to manufacturer’s instruction. After 24 h, cells were transfected again and after 24 h RNA was extracted.
Western blot and qRT-PCR. Muscle and protein extracts, immunoblot and RNA analysis was performed as in Segatto et al.32. Antibody and oligonucleotide lists are
in Supplementary Tables 1 and 2, respectively. BRD4 antibody specificity was tested in C2C12 myoblasts silenced for BRD4 (Supplementary Fig. 1A). Quanti-tative Real Time PCR was performed using SYBR green IQ reagent (Bio-Rad Laboratories, Italy) with CFX Connect detection system (Bio-Rad Laboratories, Italy).
Satellite cells isolation. Satellite cells were isolated as in Proserpio et al.31and
growth curve was performed as in Fenizia et al.81.
Analysis of intracellular ROS levels in C2C12 cells. Cells were incubated with 5-(and-6)-chloromethyl-2′,7′-dichlorodihydrofluorescein diacetate acetyl ester (CMH2DCFDA) (Thermofisher) for 30 min at 37 °C and washed with PBS4. The
greenfluorescence intensity of the oxidized DCF probe per cell was quantified by Image J software and compared at the different time points.
ChIP assay. Chromatin isolated from muscles was subjected to ChIP assay as in Segatto et al.32. 100 mg of starting tissue was used for each antibody. Chromatin
was sonicated to fragments length of approximately 0.5 Kb and immunoprecipi-tated with 3.5 µg of rabbit IgG or antibodies listed in Supplementary Table 1. ChIP primers are listed in Supplementary Table 3. Quantitative Real Time PCR was performed using SYBR green IQ reagent (Bio-Rad Laboratories, Italy) with CFX Connect detection system (Bio-Rad Laboratories, Italy).
DMD immortalized cells and human tissues. Approval from Ethics committee was obtained by the University of Milan. Human myoblast cells were immortalized by the Institut de Myologie (Pitié-Salpétrière Hospital, Paris, France) (Supple-mentary Table 5). Cells were expanded in Skeletal muscle cell growth medium (Promocell C-23060) with Supplement mix (Promocell C-39365), 15% FBS, 1% L-glutammine, 1% gentamicine (Sigma G-1272) and 1% penicillin/streptomycin. Myoblast cells were treated with JQ1 (200 nM) for 24 h. DMD and control tissues were obtained from the AFM-Myobank (Paris) and tissues were processed as described for mouse muscles (Supplementary Table 6). The study design and conduct complied with all relevant regulations regarding the use of human study participants and was conducted in accordance to the criteria set by the Declaration of Helsinki. The participants, or their legal guardians, provided written informed consent.
Statistics and reproducibility. Data obtained from functional, morphological, western blot, and mRNA analysis are expressed as means ± SD (standard devia-tion). Measurements were taken from distinct samples, except for morphological analysis. All the biological replicates were checked for their normal distribution by using Shapiro–Wilk Test. When we compared 2 experimental groups we used unpaired t test and when we compared 3 or more experimental groups we used one-way analysis of variance (ANOVA) followed by the Tukey’s post hoc test. Statistical analysis for non-normal distributed data (inverted screen test, wire test) was performed by Kruskal–Wallis test followed by Dunns post hoc. Values of p < 0.05 were considered to indicate a significant difference. Experiments in Fig.5g and Supplementary Fig. 1 were independently repeated 3 times; experiments shown in Supplementary Figs. 9B and 12E were independently repeated 2 times. Statistical analysis was performed using GRAPHPAD INSTAT3 (GraphPad, La Jolla, CA, USA) for Windows.