Correcting Calibration Drifts Using Solar and Lunar
Intrusions for Miniaturized Microwave Radiometers
The MIT Faculty has made this article openly available.
Please share
how this access benefits you. Your story matters.
Citation
Crews, Angela et al. "Correcting Calibration Drifts Using Solar and
Lunar Intrusions for Miniaturized Microwave Radiometers." IEEE
Transactions on Geoscience and Remote Sensing (February 2021):
1-14.
As Published
http://dx.doi.org/10.1109/tgrs.2021.3059698
Publisher
Institute of Electrical and Electronics Engineers (IEEE)
Version
Author's final manuscript
Citable link
https://hdl.handle.net/1721.1/130990
Terms of Use
Creative Commons Attribution-Noncommercial-Share Alike
Abstract—CubeSats with miniaturized microwave radiometers are now demonstrating the potential to provide science-quality weather measurements. For example, the Micro-Sized Microwave Atmospheric Satellite-2A (MicroMAS-2A) and Temporal Experiment for Storms and Tropical Systems–Demonstration (TEMPEST-D) CubeSats both launched in 2018 and have demonstrated microwave atmospheric sounder data from orbit. The NASA Time-Resolved Observations of Precipitation structure and storm Intensity with a Constellation of Smallsats (TROPICS) mission is a follow-on constellation of six 3U CubeSats based on the MicroMAS-2 design that is scheduled for launch no sooner than 2021. The TROPICS sensors use internal noise diodes for calibration. Although the noise diodes on TROPICS are similar to technology flown on GMI, they have not been tested on-orbit at TROPICS frequencies. In order to track and correct noise diode drift, we develop a novel method of calibration for CubeSat constellations such as TROPICS by incorporating periodic solar and lunar intrusions as an additional source of information to counter noise diode drift. These lunar intrusions also occur for existing satellites hosting microwave radiometers in sun-synchronous polar orbits, but are much more infrequent than for the TROPICS constellation’s scanning payload. In this work, we develop a solar/lunar calibration correction algorithm and test it using Advanced Technology Microwave Sounder (ATMS) lunar intrusion data. The mean bias and standard deviation between the solar/lunar calibration correction algorithm and actual ATMS data falls within the expected ATMS error budget of 0.6 K to 3.9 K, validating our model.
Index Terms—Microwave radiometers, calibration, CubeSats, TROPICS, lunar intrusion
I. INTRODUCTION
N this work, we develop a novel method of correcting TROPICS noise diode temperatures by using solar and lunar intrusions. Lunar intrusions are typically treated as an
This paper was submitted 25 Jan 2020 for review. This work was supported by a NASA Space Technology Research Fellowship NNX16AM73H. This material is also based upon work supported by the National Aeronautics and Space Administration under Air Force Contract No. FA8702-15-D-0001. Any opinions, findings, conclusions or recommendations expressed in this material are those of the author(s) and do not necessarily reflect the views of the National Aeronautics and Space Administration .
A. Crews and K. Cahoy are with Massachusetts Institute of Technology, Cambridge MA 02139 USA (email: [email protected], [email protected]).
W. Blackwell and R.V. Leslie are with MIT Lincoln Laboratory, Lexington MA 02421 USA (email: [email protected], [email protected]).
M. Grant is with NASA Langley, Hampton VA 23666 USA (email:
H. Yang is with UMD/ESSIC, College Park MD 20740 USA (email: [email protected]).
observational and calibration limiting constraint. Due to the TROPICS Space Vehicle (SV) unique dual spinner configuration, solar and lunar intrusions are periodic and occur every orbit. Our research builds on previous work by Mo and Kigawa [2], Kim et al. [3], Yang and Weng [4], Yang et al. [5], and Mattioli [6] in order to develop an algorithm to model lunar intrusions; we then test the algorithm on ATMS lunar intrusion datasets. The mean bias and standard deviation between the algorithm and ATMS lunar intrusion data falls within the calculated error budget of 0.6 –3.9 K, validating the model. We then assess the use of solar and lunar intrusions to track TROPICS noise diode (ND) drift on a daily basis by calculating the variation in error that we can expect from instrument noise and source error. We determine that lunar intrusions should be analyzed weekly while solar intrusions should be analyzed daily to track 1 K of noise diode drift.
In Section II, we provide background information on CubeSats with miniaturized microwave radiometers. Section III describes the mechanics of solar and lunar intrusions and previously developed mitigation and correction procedures. Here, we provide an overview of modeled TROPICS solar and lunar intrusions. In Section IV, we describe the development of our solar and lunar calibration correction algorithm. Section V presents the results from applying our algorithm to ATMS lunar intrusion data, and Section VI shows how we will utilize solar and lunar calibration for the TROPICS constellation. A brief conclusion and discussion of future work is presented in Section VII.
II. BACKGROUND
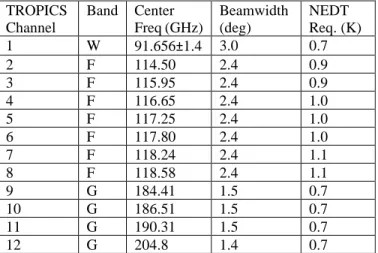
This research is motivated by TROPICS, which is a constellation of six 3U CubeSats with miniaturized microwave radiometers in development by MIT Lincoln Laboratory. TROPICS is a NASA EVI-3 selected mission, with a planned launch date of no-earlier-than (NET) 2021. With six CubeSats (2 each in three different orbital planes), TROPICS will achieve a median revisit of less than 60 minutes. This rapid refresh will enable the characterization of rapidly changing conditions in the inner core of tropical cyclones. The miniaturized radiometer instrument on TROPICS includes 12 channels: seven channels for temperature measurements near 118.75 GHz, three channels for moisture water measurements near 183 GHz, one channel for precipitation structure detection near 90 GHz, and one channel for ice cloud measurements near 205 GHz [1]. TROPICS channel characteristics are shown in Table 1.
Correcting Calibration Drifts using Solar and
Lunar Intrusions for Miniaturized Microwave
Radiometers
Angela Crews, William Blackwell, R. Vincent Leslie, Michael Grant, Hu Yang, Kerri Cahoy
Table 1: TROPICS Channel Characteristics TROPICS Channel Band Center Freq (GHz) Beamwidth (deg) NEDT Req. (K) 1 W 91.656±1.4 3.0 0.7 2 F 114.50 2.4 0.9 3 F 115.95 2.4 0.9 4 F 116.65 2.4 1.0 5 F 117.25 2.4 1.0 6 F 117.80 2.4 1.0 7 F 118.24 2.4 1.1 8 F 118.58 2.4 1.1 9 G 184.41 1.5 0.7 10 G 186.51 1.5 0.7 11 G 190.31 1.5 0.7 12 G 204.8 1.4 0.7
Typical large microwave radiometers use external blackbody calibration targets for calibration; however, these are difficult to effectively shroud and integrate in a Size, Weight, and Power (SWaP) constrained CubeSat. Instead, noise diodes are used as the “warm” calibration source for TROPICS. Due to their small mass and volume, noise diodes are becoming increasingly popular as calibration sources [7].
Noise diodes were first used as a calibration source on JASON-1 (launched in 2001) and Brown characterized the noise diodes as having a stability of 0.2 – 3.0% over four years [8]. Brown showed that external calibration techniques could be used to frequently recalibrate the noise diodes and provide long-term stability [8]. More recently, the Global Precipitation Measurement (GPM) Imager (GMI) was launched in 2014 with both blackbody calibration targets and noise diodes [7]. The noise diodes on GMI have been shown to have a long-term stability over four years that is within 0.1 K [7]. TROPICS is using component technology similar to that of the GMI noise diodes. TROPICS noise diode assemblies have been optimized electrically, structurally, thermally, and radiometrically and have undergone extensive performance and reliability testing. However, since the TROPICS noise diodes have not been tested on-orbit, additional calibration and validation methods are needed to track and correct noise diode drift. In this work, we develop a novel method of using solar and lunar intrusions as a reference source to trend noise diode drift for microwave radiometers.
It should be noted that it is becoming more common for the Moon to be used as a calibration source for space-based visible and near-infrared (NIR) instruments [9-11]. Instruments such as MODIS and VIIRS use lunar calibration routinely [12-13], and the moon has applicability as a calibration source for thermal IR sensors as well [14]. We aim to show the utility of using the moon (and sun) as a calibration source for microwave radiometer instruments also.
III. SOLAR AND LUNAR INTRUSIONS
In this section, we discuss lunar and solar intrusions and correction procedures. Intrusions occur when the sun or the moon appears in the sensor field of view (FOV) during an
instrument cold calibration procedure. The brightness temperature of the moon or sun causes an increase in measured brightness temperature in the scan, thus introducing calibration error. Typical polar orbiting instruments such as AMSU and ATMS have lunar intrusion events only several times a year, and these intrusions are discarded or corrected to remove the moon data. However, the TROPICS scanning radiometer sees periodic intrusions every orbit which provides a unique opportunity to use the intrusions for calibration purposes instead of discarding otherwise corrupted cold-space measurements.
A. Geometry of Intrusions
The position of the sun and/or moon in the sensor FOV can be predicted by determining the sensor boresight and the solar and lunar beta angles. The beta angle is defined as the angle between the orbital plane of the spacecraft and the vector to the third body (i.e. sun or moon). The solar beta angle is dependent on the Earth's 23.5° axial tilt to the ecliptic and the spacecraft's orbital inclination. The Earth's oblateness causes the right ascension of the ascending node (RAAN) to precess in a westward direction for a prograde orbit and eastward for a retrograde orbit, which affects the beta angle. The sun's declination ranges from a maximum of +23.5° on the June solstice to a minimum of -23.5° on the December solstice [15]. For an example 30° inclination orbit, we would expect the maximum solar beta angle to be +53.5° at June solstice and a minimum of -53.5° at the December solstice.
Similarly, the lunar beta angle is also dependent on the Earth's axial tilt and the satellite orbit inclination. The moon's
Fig.1: The minimum and maximum declination of the moon is shown for an (a) major lunar standstill and (b) minor lunar standstill [10].
orbit is inclined at 5.14° with respect to the ecliptic; however, the direction of this inclination changes from -5.14° to +5.14° over the course of an 18.6 year cycle. The lunar standstill is used to define how the moon's declination changes with respect to the ecliptic. At a minor lunar standstill, the moon's declination will vary from ±18.5°, while at a major lunar standstill 9.3 years later, the moon's declination will vary from ± 28.5° (Fig.1). The moon's declination completes a cycle once every 27.2 days, which is the moon's nodal period [15]; this affects the lunar beta angle, which cycles per nodal period. For an example 30° inclination orbit in 2019, which is at the midpoint of a lunar standstill, we would expect the lunar and solar beta angles to vary by ± 53.5° (declination plus satellite’s inclination).
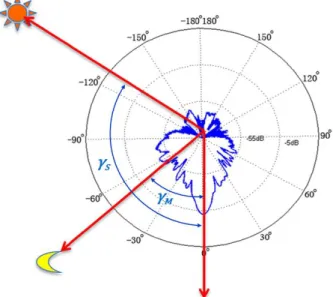
Solar and lunar intrusions can be determined by finding the separation angle, γ, between the antenna boresight and the vector to the sun or moon. Fig. 2 shows an example of the separation angle between antenna boresight and the moon and sun vector [5]. The moon and sun vectors in Fig. 2 are projections of the lunar and solar beta angles onto a polar plot of the antenna pattern.
Typical microwave radiometers do not see solar intrusions due to two factors: 1) the use of a sun shield and 2) the pointing angles used for cold calibration. For example, AMSU-A, a cross-track scanning microwave radiometer on NOAA and EUMETSAT MetOps satellites, has four different space view positions (83.3°, 81.67°, 80.0°, and 76.67° from nadir) that can be utilized for cold calibration [2]; similarly, ATMS also uses four cold space calibration groups, which are located at 83.4°, 81.7°, 80.0°, and 76.7° from nadir [4]. In contrast, the TROPICS microwave radiometer scans 360° every two seconds and can perform cold calibration over a range of angles during the space-view. This makes solar intrusions a factor for TROPICS as well as lunar intrusions.
Fig. 2: This example polar plot shows the separation angle between the antenna boresight and the moon (
γ
M) and sun (γ
S) vectors. [5]B. Correcting for Intrusions
Intrusions during cold calibration cause microwave radiometers to measure a higher effective brightness temperature than deep space, which negatively impacts the calibration of the radiometer. Several methods have been developed for correcting microwave radiometer data taken during lunar intrusions. For instance, Mo and Kigawa [2] developed an algorithm to detect and remove lunar contamination from AMSU-A; 40 extra cold counts due to a lunar intrusion can result in an error of ~1.2 K for AMSU Channel 1 when measuring ocean brightness temperature [2]. Mo and Kigawa’s algorithm discards the cold calibration data when the separation angle, γ, between the moon and antenna space viewing direction is less than 4°.
Methods have also been developed to mitigate lunar intrusions for ATMS. For instance, the original ATMS Operational Algorithm Document (OAD) mitigated lunar intrusions by averaging cold calibration views over 10 scans and excluding the scan if three "good" cold target samples were not present [3]. The lunar mitigation process was then updated in 2013 to instead ignore pixels that were corrupted by lunar intrusions and replace them with previous unaffected data [3]. This method has errors within 0.1 K in the worst case when all pixels are contaminated [3].
Yang and Weng (2016) developed an algorithm for ATMS that corrects for the lunar intrusion instead of discarding the corrupted pixels [4]. The lunar intrusions are corrected by first flagging instances where the scan may have picked up a lunar intrusion by calculating β', which is the apparent angle of the moon subtracted from the separation angle between the Moon vector and the space view sector. If β' is between zero and 1.25 multiplied by the beamwidth, then the scan is flagged for a lunar intrusion [4]. The flagged scan is corrected by calculating a lunar radiation term using the antenna gain, solid angle of the moon, and the brightness temperature of the moon and applying it to the corrupted data [4].
Fig. 3: The physical temperature of the moon is stable and can be parameterized by the moon phase angle.
Yang et. al (2018) updated the ATMS correction method from Yang and Weng (2016) by updating the parameterization of the moon's physical temperature with Diviner Lunar Radiometer Experiment (DLRE) observations from 2009 to 2015 [5], as plotted in Fig. 3. Yang also derived the effective surface emissivity spectrum of the moon’s disk using well-calibrated S-NPP ATMS lunar observation samples [5].
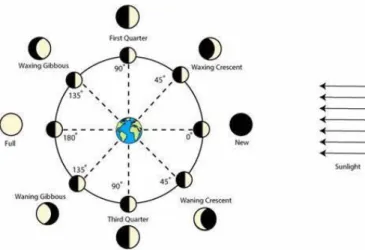
The moon phase angle is defined as the earth-centered angle between the two vectors that point toward the moon and the sun. Figure 4 shows an example diagram of the moon phase angle; note that the phase angle is 0° at new moon and 180° at full moon.
Fig. 4: The moon phase angle is the sun-earth-moon angle and is 0°at new moon and 180° at full moon [16]. The moon’s physical temperature is shown by Yang [5] to be parameterized by moon phase angle.
C. Sun Tracking Ground-based Microwave Radiometry
Similar algorithms have not been developed for solar intrusions, as the typical sun-synchronous weather satellite orbits do not have to contend with solar intrusions in the same way as lunar intrusions. However, sun-tracking ground microwave radiometers use the sun as source of radiation that can be used to retrieve atmospheric properties [6]. Sun tracking microwave radiometry is also used as a calibration tool for ground microwave radiometers and can be used to determine boresight pointing errors as well as the noise temperature of the receiver [6]. Although the solar cycle variability has not been well-characterized at TROPICS frequencies [18], sun-tracking microwave radiometry has found that the sun appears as a constant uniform disk at frequencies above 10 GHz (apart from multiple year solar cycles) [6]. Mattioli used two separate sun-tracking techniques to determine an average estimate of the effective brightness temperature with the sun in the FOV; both techniques provided similar results [6].
D. Solar and Lunar Intrusions for TROPICS
Lunar intrusions occur for existing satellites hosting microwave radiometers in polar orbits, but they are infrequent and inconsistent. Solar intrusions do not occur for these
satellites due to their sun-synchronous orbit, choice of space view positions used for cold calibration, and the use of a sun shield. However, the TROPICS mission dual-spinner configuration provides a unique opportunity for solar and lunar calibration, as solar and lunar intrusions are periodic and occur every orbit. Over a year period, the TROPICS satellites have lunar and solar intrusion events fifteen times a day (~5745 total over the course of a year), with intrusions occurring once every orbit. In comparison, ATMS only has 44 total lunar intrusions over the course of a sample year [17,19].
An analysis was completed to determine the geometry of solar and lunar intrusions for the TROPICS CubeSat constellation. A satellite in a 550 km, 30°inclination orbit was modeled in Systems Tool Kit (STK) with a dual spinner configuration, with the instrument modeled to scan at 30 rpm. Solar and lunar intrusions occurred in a sector of ± 57° from zenith over the course of the 2019 modeled year [17, 19]. Cold calibration for the TROPICS SVs should thus not be performed during this ± 57° from zenith sector. If the launch vehicle drops off the TROPICS SVs in a different inclination than desired, the solar and lunar intrusions will still occur every orbit. However, a higher inclination will increase the solar and lunar beta angles and correspondingly increase the sector from zenith where intrusions occur.
We then examined intrusions over the course of a day. The solar and lunar intrusions were shown to occur periodically every orbit [17, 19]. As the sensor scans around the spacecraft, intrusions occur every two seconds during the intrusion event. For a sample intrusion event with a 3° FOV, there are 23 intrusions at elevation angles ranging from 82.3° to 82.5 that occur over 46 seconds [17, 19].
A simple MATLAB model is used to simulate the lunar or solar intrusions in the field of view. The position of the moon first appears on the far right of sensor FOV, and as the sensor scans, the moon is sampled every 1.5° from the top of the sensor FOV to the bottom of the sensor FOV. Every two seconds, the moon appears again in the sensor FOV at a location that is 0.126° to the left of the previous position. Due to this shift in the FOV and beamwidth of each TROPICS channel, the number of intrusions per intrusion event will vary from 23-46 samples for W-band, 19-38 samples for F-band, and 0-11 samples for G-band over every orbit (see Table 2). The number of intrusions per orbit is calculated by dividing the FWHM FOV by 0.126°, which is the distance that the moon shifts in the FOV with every rotation of the payload. The samples per intrusion is calculated by determining minimum and maximum number of times that the full intrusion may appear in the FOV based on the 1.5° sample size. The number of samples available enables statistical techniques to be used to reduce noise, and the periodicity allows for intrusions to be used for calibration every orbit (96 minutes), allowing noise diode drift to be tracked and corrected effectively.
IV. SOLAR AND LUNAR CALIBRATION CORRECTION
ALGORITHM
We develop our algorithm [17] loosely based on sun-tracking ground radiometry techniques [6] used to measure atmospheric attenuation. Sun-tracking radiometry takes measurements when
Table 2: TROPICS Intrusion Event Characterization by Full Width at Half Maximum (FWHM) FOV
FWHM FOV (deg) # of Intrusions per orbit Samples per intrusion Total intrusions per event 3.0 (W-band) 23 1-2 23-46 2.4 (F-band) 19 1-2 19-38 1.4 (G-band) 11 0-1 0-11
the antenna is pointing alternatively on and off the Sun, and combines the on and off Sun measurements to determine the antenna temperature difference. Similarly, we can combine on and off intrusion measurements to determine ΔTA, the
brightness temperature difference. For the initial development of the algorithm, we assume that the only two contributions to antenna temperature are from the intrusion and from deep space. Future analysis will investigate the contribution of the Earth's brightness temperature in the antenna pattern backlobe and sidelobes. We also assume that the intrusion is not in the antenna pattern sidelobes for the "off-intrusion" measurement. We will endeavor to take the "on-intrusion" and "off-intrusion" measurements as close in angle-space as possible, but at a far enough position that the intrusion does not appear in the antenna pattern sidelobes for the “off-intrusion” measurement. We assume that the only contribution to the antenna temperature for the “off-intrusion” measurement is Tcos
(Equation 1), which is the brightness temperature of the cosmic background.
𝑇Aoff= 𝑇cos (1)
For this work, we make a simplifying assumption that the cosmic temperature is 2.73 K; however, the Rayleigh-Jeans approximation can induce errors for brightness temperature measurements at cold temperatures and high frequencies. Instruments such as ATMS apply a correction factor to the cold calibration brightness temperature as described in [31]; future work will apply a similar correction factor to the TROPICS cold calibration temperature. Weng and Zou’s analysis [31] also shows that the Rayleigh-Jeans approximation can induce errors at the TROPICS G-band frequencies. Future work will apply correction factors for the Rayleigh-Jeans approximation (as discussed in [31]) to both the cold calibration brightness temperatures and the lunar intrusion brightness temperatures used in the solar/lunar calibration correction algorithm.
For the "on-intrusion" measurement, we add the additional antenna temperature caused by the sun or moon in the FOV to
Tcos. We also subtract Tcos from the area in the FOV where the
intrusion occurs so that it is not double counted. To account for the fact that the moon or sun does not fill up the antenna FOV, we use fΩ , or the beam-filling factor [6]. The beam-filling factor
fΩ is defined as the ratio between the intrusion radiation pattern
solid angle, either sun or moon (ΩPint) and the antenna
beamwidth radiation-pattern solid angle (ΩPant), as shown in
Equation (2) [6].
𝑓Ω=𝛺Pint
𝛺Pant (2)
Combining these together, we find that the antenna temperature for an "on-intrusion" measurement is the following:
𝑇A_on= 𝑇cos + 𝑓Ω𝑇b_int− 𝑓Ω𝑇cos (3)
where Tbint is the brightness temperature of the intrusion (either
sun or moon). Based on the Rayleigh-Jeans approximation, brightness temperature can be approximated as the kinetic temperature, 𝑇, multiplied by the emissivity, 𝐸 (equation 4). 𝑇b= 𝑇 x 𝐸 (4)
We subtract (1) from (3) in order to determine the change in antenna temperature, ΔTA.
Δ𝑇A= 𝑓Ω𝑇b_int− 𝑓Ω𝑇cos (5)
Equation (5) can be simplified to the following:
Δ𝑇A= 𝑓Ω (𝑇b_int− 𝑇cos) (6)
In order to account for the position of the intrusion in the FOV, we multiply (6) by the antenna response function, Gant,
which is modeled as a 1-D Gaussian as shown in equation (7). β is the angle between the moon vector and the antenna boresight, and σ is defined in equation (8). 𝜃3dB is the antenna 3
dB beamwidth. 𝐺ant = 𝑒 −𝛽2 2𝜎2 ⁄ (7) 𝜎 = 0.5× 𝜃3dB √2 ×log (2) (8)
Our final solar/lunar calibration correction algorithm is shown in equation (9):
Δ𝑇A= 𝐺ant × 𝑓Ω × (𝑇b_int− 𝑇cos) (9)
In order to calculate ΩPint and ΩPant in the beam filling factor,
we follow Mattioli's method [6] and make an assumption that the main beam of the radiometer follows a Gaussian shape as shown in equation (10). θ is the zenith angle, φ is the azimuth, and θML is the half power beamwidth of the antenna main beam.
𝐹nML (𝜃, 𝜑) = 𝑒− ln(2) (2𝜃/𝜃ML2) (10)
We then integrate the main beam of the radiometer in order to find ΩPint and ΩPant, as shown in equations (11) and (12),
where θs is the zenith plane angle subtended by the sun or the
moon and ɳML is the antenna main beam efficiency.
𝛺Pant =
∬4𝜋𝐹nML(𝜃,𝜑) 𝑑𝛺
ɳML (11)
Our developed algorithm will be updated for TROPICS by replacing the Gaussian approximation of the main beam of the radiometer with the actual ground-tested antenna pattern. Future work will modify the algorithm to include TROPICS specific antenna information and will take into account potential spillage from the antenna pattern backlobe and sidelobes.
We next describe how the solar and lunar calibration correction algorithm will be applied to the TROPICS calibration scheme. The TROPICS Level-1a calibration equation calculates the Level-1a antenna temperature, TAnt , by
taking into account cold calibration, warm calibration, and non-linearities. Cold calibration and warm calibration take place every two seconds as the radiometer scans. Cold calibration occurs when the radiometer is looking at deep space, and is dependent on Tcos (the effective deep space brightness
temperature) and Cc (the number of counts measured by the
radiometer). Warm calibration occurs when the radiometer is looking at deep space and the weakly coupled noise diode injects a noise source at the front of the receiver chain. TND is
the effective warm brightness temperature measurement, and CND is the counts measured by the radiometer during warm
calibration.
The two-point cold and warm calibration scheme calculates a linear relationship using the two reference sources. However, total power radiometers are not completely linear so a non-linearity correction needs to be added to the calibration equation. Like ATMS [28], we assume a parabolic transfer function and that the maximum non-linearity is halfway between the calibration sources. Non-linearity coefficients are measured in thermal vacuum chamber using external calibration targets [29].
The TROPICS Level-1a calibration equation is shown in equation (13). The first half of the equation applies the cold and hot calibration to the scene counts measured by the radiometer, Cs. The term 𝑔 is the ratio of the difference between the hot and
cold brightness temperatures and counts, as shown in (14). The second half of the equation applies the non-linearity correction to the transfer function. The term 𝑥is the ratio of the difference between the scene counts and cold counts and the difference between the hot counts and cold counts, as shown in (15).
𝑇Ant = 𝑇cos+ 𝑔 ∗ (𝐶s− 𝐶c) + 4 × (𝑥 − 𝑥2) × 𝑇NL (13)
𝑔 = 𝑇ND−𝑇C
𝐶ND−𝐶C (14)
𝑥 = 𝐶S−𝐶C
𝐶ND−𝐶C (15)
The solar and lunar calibration correction algorithm developed in this work will be used to trend noise diode (𝑇ND)
drift. Identified drift will be corrected by additively correcting the 𝑇ND term in the Level-1a calibration equation (13).
V. TESTING RESULTS
We test the solar and lunar calibration correction algorithm on available ATMS lunar intrusion data. Our testing data includes images of ATMS lunar intrusions during a pitch over maneuver, as well as lunar intrusion datasets from ATMS
instruments on Suomi-NPP (2013 dataset) and NOAA-20 (2017 dataset). Our model assumes a main beam efficiency, ɳML, of
0.967 (an assumption from Mattioli) [6]. We use 0.52° for θs,
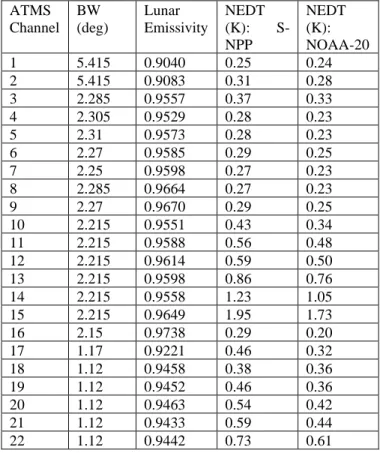
which is the average angle subtended by the moon [20]. Channel beamwidths and emissivity values used for the model are shown in Table 3. The channel beamwidths are the center of the ATMS ground measured values [3], while the emissivity values per channel are from Yang et. al 2018 [5] and were derived from well-calibrated ATMS data. The derived emissivity values include any error in the ATMS antenna solid angle, which may introduce additional error when applied to instruments with a different antenna pattern. We also show the measured NEDT values per channel for the ATMS instruments on Suomi-NPP and NOAA-20 [3,21].
Table 3: Channel Beamwidths (BW), Lunar Emissivity, and NEDT
ATMS Channel BW (deg) Lunar Emissivity NEDT (K): S-NPP NEDT (K): NOAA-20 1 5.415 0.9040 0.25 0.24 2 5.415 0.9083 0.31 0.28 3 2.285 0.9557 0.37 0.33 4 2.305 0.9529 0.28 0.23 5 2.31 0.9573 0.28 0.23 6 2.27 0.9585 0.29 0.25 7 2.25 0.9598 0.27 0.23 8 2.285 0.9664 0.27 0.23 9 2.27 0.9670 0.29 0.25 10 2.215 0.9551 0.43 0.34 11 2.215 0.9588 0.56 0.48 12 2.215 0.9614 0.59 0.50 13 2.215 0.9598 0.86 0.76 14 2.215 0.9558 1.23 1.05 15 2.215 0.9649 1.95 1.73 16 2.15 0.9738 0.29 0.20 17 1.17 0.9221 0.46 0.32 18 1.12 0.9458 0.38 0.36 19 1.12 0.9452 0.46 0.36 20 1.12 0.9463 0.54 0.42 21 1.12 0.9433 0.59 0.44 22 1.12 0.9442 0.73 0.61
A. Lunar Calibration Image Testing
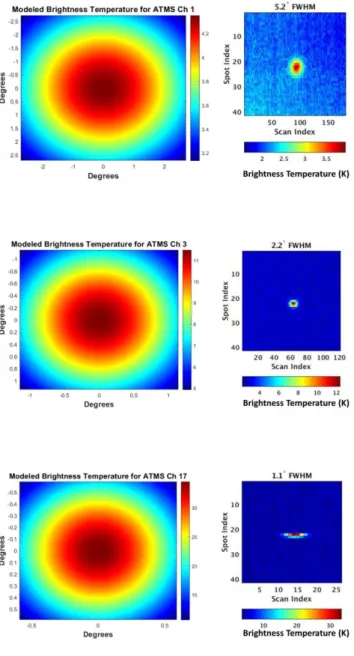
Our first test compares our algorithm results to NOAA-20 ATMS full disk images of the moon taken during a pitch up maneuver on 31 January 2018 [22]. During this maneuver, the phase angle, which is the angle between the sun and moon, was 180 degrees. We compare Channel 1 (5.2 FWHM), Channel 3 (2.2 FWHM), and Channel 17 (1.1 FWHM). It should be noted that the ATMS lunar intrusion images plot brightness temperature versus spot and scan, while our modeled images plot the expected brightness temperature based on where the intrusion occurs in the FOV. In Table 4 it can be seen that the brightness temperature scales match between the images; in fact, the peaks of the brightness temperature for the model and the actual image are within 1 K of each other. Differences between modeled and actual peak brightness temperatures are
likely due to the fact that our algorithm does not take noise into account. The actual ATMS observations have instrument noise, which is described by the Noise Equivalent Delta Temperature (NEDT) and is shown in the NEDT columns of Table 3. Fig. 5 shows a comparison of our modeled images to the actual ATMS lunar intrusion images for Channels 1, 3, and 17. The modeled images can be used to determine what increment in effective brightness temperature should be expected based on where the intrusion occurs in the FOV. If the intrusion is in the center of the FOV, the brightness temperature reaches its peak; as the intrusion moves away from the center, the effective brightness temperature decreases.
Fig. 5: Comparison between modeled brightness temperatures and ATMS lunar intrusion images taken during a pitch-up maneuver on Jan 2018. Quantitative differences in peak brightness temperature are shown in Table 4.
Table 4: Modeled vs ATMS Lunar Intrusion Comparison
ATMS Channel Beam Filling Fraction Modeled peak TB (K) Actual peak TB (K) Difference (K) 1 0.007 4.26 3.95 0.31 3 0.037 11.49 12.40 0.91 17 0.104 33.39 33.43 0.04
B. Lunar Calibration Intrusion Data Testing
We next test the model using 13 days of lunar intrusion data from Suomi-NPP in 2013 and one day of data from NOAA-20 in 2017. The data was provided from Dr. Hu Yang at the University of Maryland (UMD) Earth System Science Interdisciplinary Center (ESSIC).
The ATMS lunar intrusion datasets include the moon phase angle, the observed brightness temperature by channel, the minimum lunar separation angle, and the maximum lunar separation angle. ATMS uses its 83.4° beam group for cold space calibration; each beam group is composed of four different space view (SV) pixels [4]. The maximum and minimum lunar separation angles in the datasets correspond to the maximum and minimum magnitude of lunar radiation in the four SV pixels during the lunar intrusion events. The observed brightness temperature is the difference in brightness temperature between the pixels with the minimum and maximum lunar separation angle. For most cases, the maximum lunar separation angle is clear of the lunar intrusion. We screen for any lunar intrusions that occur in the maximum lunar separation angle and filter those out from our analysis. We additionally screen out any data points that do not show a lunar intrusion in the minimum lunar separation angle. After screening, we use the observed brightness temperature from the datasets as our ΔTA (Eq. 9), since the value is now the difference
between an on-intrusion and off-intrusion. We can now compare the actual ΔTA to our modeled ΔTA and determine the
difference.
In Fig. 6 we plot the modeled ΔTA (in blue) versus the actual
ΔTA (in orange) for all channels in the datasets. Example
comparison plots are shown for Channels 1, 3, and 17 using the 28 Dec 2017 dataset. Channel 1 is shown as representative of performance at 5.2° FWHM (Channels 1 & 2), Channel 3 is shown as representative of the performance at 2.2° FWHM (Channels 3 through 16), and Channel 17 is shown as representative of the performance at 1.1° FWHM (Channels 17-22).
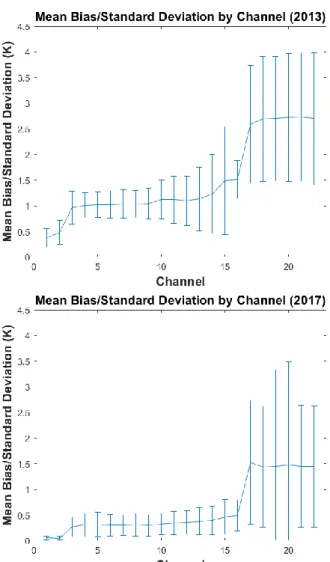
We also calculate the mean bias and standard deviation for each channel in all datasets (Table 5). The mean bias is calculated by finding the mean of the difference between the model and the ATMS actual observations for each point, and the average standard deviation is calculated to quantify the variation in the bias. G-band data is filtered for any peak that shows more than 5 K of difference, which is most likely due to pointing error. For the 2013 data, the K/Ka-band channels (Channels 1 & 2) have a mean bias of less than 0.5 K and a standard deviation of less than 0.25 K. The V/W-band Channels (Channels 3-16) have a mean bias of less than 1.52 K with a standard deviation of 1.1 K, while the G-band Channels (Channels 17-22) have a mean bias of less than 2.7 K with a
standard deviation of less than 1.3 K. The 2017 data shows a mean bias of 0.05 K and standard deviation of 0.04 K for K/Ka-band, a mean bias of less than 0.5 K and standard deviation of less than 0.4 K for V/W-band, and a mean bias of less than 1.6 K and standard deviation of less than 1.25 K for G-band. The differences between the 2013 and 2017 data are due to differences in the antenna response function and pointing error between the ATMS instruments on Suomi-NPP and NOAA-20. The mean bias and standard deviation is also plotted in Fig. 7.
Fig. 6: Modeled ΔTA (blue) is compared to the ATMS ΔTA (orange)
for the 28 Dec 2017 dataset.
Table 5: Mean Bias and Standard Deviation of Model
ATMS Channel Mean Bias (K): 2013 StdDev (K): 2013 Mean Bias (K): 2017 StdDev (K): 2017 1 0.37 0.18 0.05 0.04 2 0.48 0.23 0.05 0.04 3 0.96 0.32 0.27 0.19 4 1.01 0.25 0.31 0.23 5 1.02 0.25 0.31 0.24 6 1.02 0.27 0.30 0.21 7 1.03 0.28 0.30 0.20 8 1.03 0.27 0.31 0.22 9 1.04 0.30 0.30 0.21 10 1.12 0.38 0.32 0.21 11 1.12 0.46 0.34 0.23 12 1.10 0.48 0.35 0.23 13 1.13 0.62 0.37 0.26 14 1.23 0.77 0.39 0.28 15 1.49 1.05 0.46 0.34 16 1.51 0.37 0.49 0.30 17 2.59 1.15 1.53 1.21 18 2.69 1.22 1.44 1.18 19 2.70 1.22 1.45 1.19 20 2.72 1.25 1.48 1.20 21 2.73 1.25 1.45 1.19 22 2.70 1.89 1.45 1.18
The mean bias and standard deviation of G-band is approximately 2 K worse than for K/Ka-band and V/W-band. This difference for band was also noted in Yang 2018 [5]. G-band is much more sensitive to antenna pointing error; additionally, the G-band antenna pattern for ATMS has a much higher noise [5]. The surface temperature of the moon also has a 4 - 10 K standard deviation from the parameterized model used in our algorithm [5], and G-band is more sensitive to the temperature change since the moon takes up a larger portion of the FOV [5].
Fig. 8 compares the measured NEDT of Suomi-NPP and NOAA-20 to our model's standard deviation with the 2013 (Suomi-NPP) and 2017 (NOAA-20) datasets. Our modeled standard deviation is lower than the channel NEDT for all channels except for G-band, which is impacted more by pointing error, lunar surface temperature variation, and a noisy antenna pattern.
C. Error Budget for ATMS Lunar Intrusion Testing
In this section we document the expected errors for testing our model with ATMS lunar intrusion data. The sources of error for the modeling can be divided into instrument errors and source errors. Instrument errors can be caused by instrument noise as well as instrument modeling errors. ATMS random noise is characterized by the NEDT, which varies from 0.25-1.95 K for Suomi-NPP and from 0.23-1.73 K for NOAA-20 (Table 3). Instrument modeling errors include knowledge of the antenna pattern and half power beamwidth, knowledge of the intrusion solid angle, and main beam efficiency variation. These can all be approximated through ground testing. Both Mattioli and
Fig. 7: The mean bias and standard deviation by channel for the 2013 and 2017 datasets. The quantitative values are shown in Table 5.
Fig. 8: The modeled standard deviation is lower than the ATMS NEDT, with the exception of G-band Channels 17-22, which are affected by pointing error, lunar surface temperature variation, and a noisy antenna pattern.
Yang assume a worst case scenario of a 10-11% error for the antenna pattern; this corresponds to a 0.13 K model simulation bias for the 5.2° beamwidth channels, but up to as large as 3 K bias for the G-band 1.1° beamwidth channels [5,6]. It is
expected that spillover from the backlobe and sidelobes contributes to the antenna pattern error. The intrusion solid angle varies slightly with the θint, which is the angle subtended
by the sun or moon. θint varies with Earth-sun or Earth-moon
distance. The angle subtended by the sun has a maximum variation of 0.02°, while the angle subtended by the moon has a maximum variation of 0.06° [20]. This variation leads to an error of 0.01 K at K/Ka bands and up to 0.2 K at G-bands. Main beam efficiency variation can also induce small uncertainties, and an uncertainty of 5% causes an error of 0.001 K at K/Ka bands and 0.08 K at G-bands [6]. Main beam efficiency and knowledge of the antenna pattern can be improved through highly accurate ground testing, while errors induced from changes in the intrusion solid angle can be mitigated by adjusting θint based on the distance from the Earth to the
intrusion source.
Another significant source of error for the algorithm is pointing error. Pointing error can be caused by beam misalignment, mounting error, and launch; additionally, thermal changes on-orbit could also cause pointing errors [5]. Mattioli characterized pointing error as causing up to 0.5 K of error at K and Ka-band and up to 1 K at W and V-band [6]. However, Yang has determined that pointing error can be mitigated with coastline and lunar scan methods [5]. Suomi-NPP ATMS has a designed pointing accuracy of 0.3° for K-/Ka-band, 0.2° for V-/W-K-/Ka-band, and 0.1° for G-band [30]. The TROPICS spacecraft pointing knowledge is expected to be the same order of magnitude, as the spacecraft use two concurrently operating star trackers with knowledge certainty better than 0.1° (1 sigma) based on previous flight data from other missions that use the same star tracker as TROPICS.
Source characteristics from the surface of the moon also contribute to the algorithm's error budget. The surface temperature of the moon has a 4-10 K standard deviation from the parameterized model used in our algorithm, and this can cause up to 1 K of error for G-band [5]. Previous studies have also shown that the maximum microwave emission from the moon lags up to 45° behind the surface temperature [5]. However, due to a lack of data samples at different lunar phase angles the phase angle lag is not currently accounted for in our equations for the brightness temperature of the moon. ATMS has a fairly steady moon-sun angle at around 100-110 degrees during intrusions, so the phase angle lag can be ignored as a source of error for our error budget with ATMS intrusions [5]. In Table 6 we summarize the sources of errors for testing our algorithm with ATMS lunar intrusion data. The top four model sources of error for lunar intrusions are the instrument NEDT, antenna main beam modeling, pointing error, and the surface temperature of the moon. We assume a worst case scenario and that the sources of error are independent, and we take the root sum square of the four main error sources as shown in Equation 16.
𝐸total= √(𝐸NEDT2+ 𝐸ant_mod2+ 𝐸point2+ 𝐸moon_surf2) (16)
The results are up to 0.6 K of error at K/Ka-band, up to 2.4 K at W/V-band, and up to 3.9 K of error at G-band. This matches the results that we found with the lunar calibration
correction algorithm. Our model had mean biases of under 0.5 K for K/Ka-band and under 2.75 K for G-band.
VI. APPLICATION TO TROPICS
A. TROPICS Error Sources
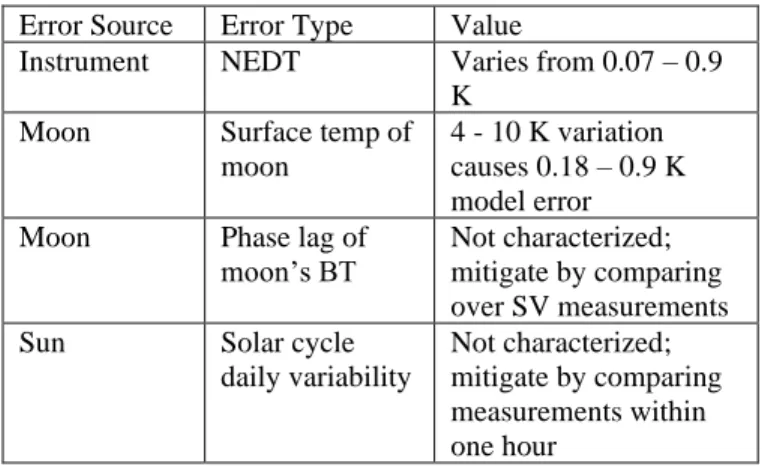
For TROPICS, we plan to use solar and lunar calibration to track noise diode drift. In this case, instead of characterizing the overall offset from the model and the actual measurement, it is necessary to track how error sources affect the solar and lunar measurements on a daily scale. The error sources from Table 6 that vary with time must be considered; these include instrument NEDT, intrusion solid angle, surface temperature of the moon, and phase lag of the moon's brightness temperature. The TROPICS instrument NEDT requirements are shown in Table 1. The intrusion solid angle varies with distance between the instrument and the sun/moon, but this effect is much smaller in magnitude and will not affect error on a daily basis and is thus ignored. Error sources from the sun also must be
Table 6: Error Sources for ATMS Lunar Intrusions
Error Source Ref Value Type Notes
Instrument Instrument noise NEDT: 0.25 -1.95 K (SNPP), 0.24 -1.73 K (NOAA-20)
Random See Table 3
Instrument Modeling Main antenna lobe solid angle 10% error; up to 3 K model bias in G-band [5,6] Systematic Ground testing [5,6] Intrusion solid angle Sun angle varies 0.02 deg and moon angle varies 0.06 deg; casues 0.01-0.2 K of error Systematic Changes slowly with orbit [13] Main beam eff. variation Uncertainty up to 0.05 causes 0.001-0.08 K error [6] Systematic Ground testing [5,6] Beam offset (pointing) error Up to 1 K model error [5,6] Systematic Mitigated through coastline and lunar scans [5]
Source Modeling: Moon
Surface temp of moon 4 - 10 K variation [5] causes 0.07 -0.9 K model error Random Phase lag of moon’s BT Up to 45 deg phase lag [5] Systematic
Table 7: Error Sources for TROPICS Lunar and Solar Intrusions
Error Source Error Type Value
Instrument NEDT Varies from 0.07 – 0.9 K
Moon Surface temp of moon
4 - 10 K variation causes 0.18 – 0.9 K model error Moon Phase lag of
moon’s BT
Not characterized; mitigate by comparing over SV measurements Sun Solar cycle
daily variability
Not characterized; mitigate by comparing measurements within one hour
considered. The solar cycle shows daily and annual variability, but the variability has not been characterized at TROPICS microwave frequencies. Table 7 shows the sources of error taken into consideration for TROPICS.
MicroMAS-2A captured solar intrusions during its tumble phase. The intrusions are shown in Fig. 9. For W-band (3.0° beamwidth), the effective brightness temperature was 150 K. For F-band channels (2.4°), the effective brightness temperature was 225 K, and for G-band channels (1.6°) the effective brightness temperature was 375 K. Solar intrusions have a much larger dynamic range than lunar intrusions.
Fig. 9: MicroMAS-2A captured solar intrusions during its tumble phase. These images can be used in future work to further test the algorithm.
B. Moon Error Sources
Yang (2018) developed the parameterization for the moon's brightness temperature using datasets from the Diviner Lunar Radiometer Experiment (DLRE) onboard the Lunar Reconaissance Orbiter (LRO) [5]. The global surface temperature was averaged at different moon phase angles, and the mean and standard deviation of the surface model temperature was characterized [5]. The standard deviation varied from 4-10 K, with the largest standard deviation occurring at full moon (180° phase angle). We determine the error impact of a standard deviation at 4 K and 10 K for each channel as shown in Table 8.
Moon phase angle effects were ignored for algorithm testing with ATMS data since the ATMS lunar intrusions only occur between a phase angle range of 110 ± 5 degrees [5]. However, because TROPICS has a scanning payload, the moon phase angle is expected to vary over the lunar intrusions. On a daily basis, we make an assumption that the phase angle change will have only a minimal impact and thus can be ignored. Over
Table 8: TROPICS Effective Brightness Temperature Error due to the Moon’s Surface Temperature Deviation at 4 K and 10 K of
Standard Deviation
TROPICS Channel
BW (deg) Eff TB Error due to 4 K StdDev (K) Eff TB Error due to 10 K StdDev (K) 1 3.0 0.07 0.18 2-8 2.4 0.11 0.28 9-11 1.5 0.30 0.74 12 1.35 0.36 0.9
longer periods of time the phase angle lag will need to be taken into account. We can mitigate the impact of lunar phase angle lag on TROPICS by characterizing the impact of phase angle lag during initial TROPICS operations. Once the lag between brightness temperature and surface temperature has been modeled, we will update our algorithm equation for the brightness temperature of the moon.
C. Sun Error Sources
The sun's brightness temperature does not have a phase lag; however, other challenges exist with solar calibration. The solar cycle has daily and annual variability, and this variability has not been determined in the microwave frequency range relevant for TROPICS [18]. The short timeframe in which we will compare solar intrusions between space vehicles (within one hour) mitigates the impact of the sun's daily and annual variability. Additionally, initial data from TROPICS can be used to characterize and correct for the sun's daily variability.
A solar brightness temperature parameterized model does not exist at TROPICS frequencies. Because a model does not yet exist, solar intrusions will be used as relative calibration between TROPICS spacecraft in the constellation. Initial data from TROPICS can also be used to determine the average surface temperature of the sun's disk and standard deviation.
D. Tracking Noise Diode Drift
In order to track noise diode drift, we need to show that the brightness temperature changes due to noise diode drift can be detected over the sources of error. Differences between modeled and actual intrusion measurements are caused by instrument noise, source variation, and noise diode drift.
For lunar intrusions, we assume the moon phase angle lag can be ignored. The two major contributions to error are then the instrument NEDT and the moon surface temperature. We find the root sum square (RSS) of error standard deviations to find the total expected error standard deviation, and then calculate the standard error (which is defined as the standard deviation of the mean) to find the number of measurements required in order to track noise diode drift.
We find that lunar intrusion analysis should be completed on a weekly basis in order for the standard error to be less than the change in error caused by 1 K of noise diode drift. Results are summarized in Table 9. Lunar intrusions will not be an effective way to track noise diode drift for Channel 1, since 1 degree of noise diode drift only causes 0.002 K change to the effective brightness temperature. This is due to Channel 1's larger FOV and higher noise diode temperature. Solar intrusions have a
Table 9: Lunar Intrusion Weekly Standard Error by Channel
TRO PICS Chan nel BW (deg) Error (NEDT + moon) (K) Intrusion s/week Weekly SE (K) Error from 1 K ND drift 1 3.0 0.72 2415 0.015 0.002 2-8 2.4 1.14 1995 0.026 0.040 9-11 1.5 1.02 1155 0.030 0.099 12 1.35 1.14 1050 0.035 0.099
higher dynamic range and can be used to track drift for Channel 1.
If the weekly mean bias between the model and actual measurements varies by more than three sigma (defined as three standard deviations from the mean) of the standard error, then the measurements will be flagged for noise diode drift. The phase lag for the moon's brightness temperature can only be ignored on a daily basis. If the SV is flagged for noise diode drift, then the other SVs in the constellation should be checked as well. If all TROPICS SVs show the same drift, then it may be due to the moon's brightness temperature phase lag. Additionally, flagged noise diode drift should be confirmed using other sources such as validation with GPSRO, radiosondes, and NWP models [25-27].
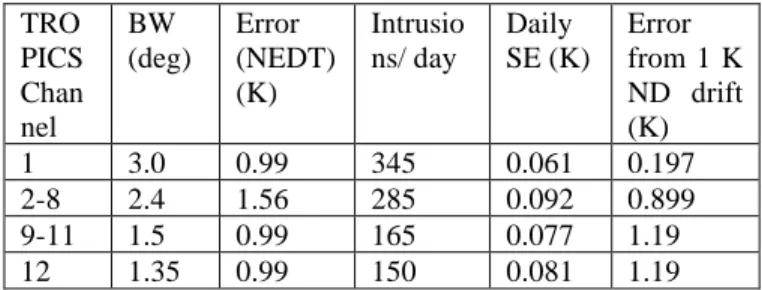
A similar analysis is performed for solar intrusions. Because we are comparing relative effective brightness temperature measurements between spacecraft, we will not be using the model to mitigate the effects of the intrusion occurring in different places in the FOV. However, by setting the same sample angles for all TROPICS space vehicles we can ensure that we are comparing solar intrusions that occur in a relatively similar place in the FOV. We assume that the solar daily variability will be mitigated due to comparing measurements within one hour of each other, so we only take the instrument noise into account. Since we are comparing two space vehicles, we find the root sum square of the NEDT from each SV to find the expected error standard deviation. The daily standard error is shown in Table 10. For solar intrusions, the change in error caused by 1 degree of noise diode drift is between 3-15 times greater than the daily standard error, which shows that we can use daily analysis for solar intrusions.
Table 10: Solar Intrusion Daily Standard Error by Channel
TRO PICS Chan nel BW (deg) Error (NEDT) (K) Intrusio ns/ day Daily SE (K) Error from 1 K ND drift (K) 1 3.0 0.99 345 0.061 0.197 2-8 2.4 1.56 285 0.092 0.899 9-11 1.5 0.99 165 0.077 1.19 12 1.35 0.99 150 0.081 1.19
Similar to the approach for lunar intrusions, we will flag the measurements for noise diode drift if the daily mean bias between the TROPICS space vehicles changes by more than three sigma of the daily standard error. The measurements should be checked for outliers that may be due to variability in the sun's brightness temperature. Additionally, the mean of all
SV measurements should be tracked in order to develop a sun model for the algorithm. Validation from multiple sources should be used to confirm flagged noise diode drift.
E. Incorporating into TROPICS Calibration Scheme
For the TROPICS calibration scheme, the microwave radiometer will be set into an additional data collection mode during intrusions and will sample every 1.5° as the microwave radiometer scans. Every two seconds, the intrusion will shift 0.126° left in the FOV. Fig. 10(a) and 10(b) show examples of the sample points during a lunar intrusion event for TROPICS Channels 2-8 (2.4° beamwidth). In the best-case scenario, the intrusions would fall near the center of the FOV (Fig. 10(a)). In the worst case, the intrusions would fall on either side of the center of the FOV (Fig. 10(b)).
Fig. 10: Samples during a lunar intrusion are modeled for TROPICS Channels 2-8 (2.4° beamwidth) with the intrusions passing directly through the center of the FOV (a) and passing on either side of the center of the FOV (b). The white circles show the lunar intrusion’s position in the FOV.
These intrusion samples will then be downlinked to the ground station for processing, where they will be compared with off-intrusion measurements in order to find ΔTA. For lunar
intrusions, we will use the developed algorithm to determine modeled ΔTA. The mean difference between actual and
modeled ΔTA will be used to track noise diode drift over time.
For solar intrusions, we will compare the mean ΔTA between
different TROPICS SV's to track noise diode drift over time. This will mitigate the lack of a solar temperature model at TROPICS frequencies.
Fig. 11 illustrates how the mean ΔTA of the moon and sun
can be used to monitor noise diode drift. Because the thermal emission of the sun and the moon is stable, it can be used as a reference to identify the drift of on-board calibration sources as shown below. A typical two-point periodic absolute calibration removes the gain variation and outputs the lunar and solar antenna temperature. The pre-launch characterization [29] is illustrated in black. The modelled lunar antenna temperature, along with the cosmic background radiation as an anchor point, will produce another regression as illustrated in red. Using the new regression, updated antenna temperatures can be extrapolated onto both the noise diode temperature and the solar antenna temperature (note that for simplicity, Fig. 11 does not show the non-linearity correction; however, it is crucial). The temporally-close solar measurements between CubeSats in the TROPICS constellation are expected to be self-consistent between calibrations, and therefore will consistently follow any noise diode drift. Furthermore, to be classified as noise diode drift, the corrected noise diode temperature will be verified with the other validation sources as mentioned in Section VI D.
Fig. 11: The modeled lunar temperature and the cold space measurement will be used to produce another regression and correct noise diode and solar antenna temperatures. Noise diode drift will be verified with other validation sources such as GPSRO, radiosondes, and NWP models.
We may be able to reduce noise from our measurements by combining multiple intrusions with techniques such as linear and non-linear regression, optical centroiding, and the Backus-Gilbert technique. The Backus-Backus-Gilbert technique was
demonstrated by Poe as a method to interpolate imaging microwave radiometer data [23], and has also been used in microwave radiometer applications such as extracting vertical temperature profiles and matching resolutions of data taken from different sensors [24]. Future work will investigate the use of these techniques to reduce noise.
Future work will also verify the following assumptions and areas that have not been modeled: (1) TROPICS antenna pattern and main beam efficiency, which will be verified through ground testing; (2) moon phase angle lag effects on the Moon’s physical temperature; (3) surface temperature variability of the sun; (4) pointing error of the TROPICS SVs; (5) antenna pattern backlobe and sidelobe effects; and (6) apply correction factors for the Rayleigh-Jeans approximation.
VII. CONCLUSIONS
We have developed a new calibration method that utilizes solar and lunar intrusions as an additional data source to track noise diode drift. These lunar intrusions occur for existing satellites hosting microwave radiometers in polar orbits, but they occur much more infrequently for the TROPICS spinning payload, which allows it to see behind the spacecraft. We developed a new algorithm, loosely based on ground sun-tracking microwave radiometry, and tested the algorithm using ATMS lunar intrusion data. Our algorithm shows a mean bias and standard deviation that is within the calculated error budget (Table 6), which validates our model for use with TROPICS. Daily sources of error were analyzed in order to track noise diode drift on TROPICS, and we show that lunar intrusions should be used on a weekly basis and solar intrusions should be used on a daily basis. Not only will solar and lunar calibration allow us to track noise diode drift for TROPICS, but the data collected with this algorithm will enable characterization of lunar brightness temperature phase lag, as well as a method to model solar brightness temperature variability at microwave frequencies.
The solar and lunar calibration process we have developed shows promise for future applications. For instance, the large dynamic range in effective brightness temperature of measurements of the solar intrusions means that they could potentially be used to characterize noise diode non-linearities on-orbit; currently, non-linearities are only characterized pre-launch in thermal vacuum testing. The sun has not been completely characterized at TROPICS-relevant microwave frequencies, so the solar intrusion data would be a new dataset for use in the microwave radiometer community. Solar intrusions could even potentially be used to cross-calibrate a variety of microwave radiometers in the future.
REFERENCES
[1] Blackwell W. J., Braun S., Bennartz R., Velden C., DeMaria M., Atlas R., Dunion J., Marks F., Rogers R., Annane B., and Leslie R. V. An overview of the TROPICS NASA earth venture mission. Quarterly Journal of the Royal Meteorological Society, 0(ja).
[2] A Seiichiro. Kigawa, Tsan. Mo, Data National Environmental Satellite, and Information Service. An algorithm for correction of lunar contamination in AMSU-A data [microform] / Seiichiro Kigawa and Tsan Mo. U.S. Dept. of Commerce, National Oceanic and
Atmospheric Administration, National Environmental Satellite, Data, and Information Service Washington, DC, 2002.
[3] Kim Edward, Lyu Cheng, Hsuan J., Anderson Kent, Vincent Leslie R., and Blackwell William J. S-NPP ATMS instrument prelaunch and on-orbit performance evaluation. Journal of Geophysical Research: Atmospheres, 119(9):5653–5670.
[4] H. Yang and F. Weng. Corrections for on-orbit atms lunar contamination. IEEE Transactions on Geoscience and Remote Sensing, 54(4):1918–1924, April 2016.
[5] H. Yang et al. Developing vicarious calibration for microwave sounding instruments using lunar radiation. IEEE Transactions on Geoscience and Remote Sensing, 56(11):6723–6733, November 2018. [6] V. Mattioli, L. Milani, K. M. Magde, G. A. Brost, and F. S. Marzano. Retrieval of sun brightness temperature and precipitating cloud extinction using ground based sun-tracking microwave radiometry. IEEE Journal of Selected Topics in Applied Earth Observations and Remote Sensing, 10(7):3134–3147, July 2017
[7] D. W. Draper, D. A. Newell, D. S. McKague, and J. R. Piepmeier. Assessing Calibration Stability using the Global Precipitation Measurement (GPM) Microwave Imager (GMI) noise diodes. IEEE
Journal of Selected Topics in Applied Earth Observations and Remote Sensing, 8(9): 4239-4247, Sept 2015.
[8] S. T. Brown, S. Desai, W. Lu, and A. Tanner. On the long term stability of microwave radiometers using noise diodes for calibration. IEEE Transactions on Geoscience and Remote Sensing, 45(7):1908– 1920, May 2007.
[9] H. H. Kieffer and R. L. Wildey, “Establishing the Moon as a spectral radiance standard,” J. Atmos. Ocean. Technol. 13, 360–375 (1996). [10] H.H. Kieffer, “Photometric stability of the lunar surface,” Icarus 130,
323–327 (1997).
[11] H. H. Kieffer, T. C. Stone, R. A..Barnes, S. Bender, R. E. Eplee, J. Mendenhall, and L. Ong, “On-orbit radiometric calibration over time and between spacecraft using the Moon,” Proc.SPIE 4881, 287–298 (2003).
[12] J.-Q. Sun, X. Xiong, W. L. Barnes, and B. Guenther, “MODIS reflective solar bands on-orbit lunar calibration,” IEEETrans. Geosci. Remote Sens. 45, 2383–2393 (2007).
[13] J. McIntire, B. Efremova, and X. Xiong, “Calibration of NPP VIIRS fire detection band using lunar observations,” Proc. SPIE 8533, 85331B (2012).
[14] Shaw JA, Nugent PW, Vollmer M. Infrared Moon imaging for remote sensing of atmospheric smoke layers. Appl Opt. 2015;54(4):B64-B75. doi:10.1364/AO.54.000B64.
[15] Wikipedia. Lunar standstill.
https://en.wikipedia.org/wiki/Lunar_standstill.
[16] Education.com. What causes the phases of the moon.
https://www.education.com/science-fair/article/determine-positions-sun-moon-earth/. [Accessed 2 Aug 2020].
[17] A. Crews, K. Cahoy, W. Blackwell, R. V. Leslie and M. Grant, "Solar and Lunar Calibration for Miniaturized Microwave Radiometers,"
2019 IEEE Aerospace Conference, Big Sky, MT, USA, 2019, pp.
1-11.doi: 10.1109/AERO.2019.8741641, URL: http://ieeexplore.ieee.org/stamp/stamp.jsp?tp=&arnumber=874 1641&isnumber=8741395
[18] C. Ho, S. Slobin, A. Kantak, S. Asmar, "Solar Brightness Temperature and Corresponding Antenna Noise Temperature at Microwave Frequencies," IPN Progress Report, pp. 42-175, 2008.
[19] Crews, A. et al. “Calibration & Validation of Small Satellite Passive Microwave Radiometers: MicroMAS-2A and TROPICS”, Proceedings of SPIE Remote Sensing, Berlin 2018.
[20] NASA JSC. Geometry. https://er.jsc.nasa.gov/seh/math30.html. [21] Northrop Grumman. Joint polar satellite system (JPSS) advanced
technology microwave sounder (ATMS) calibration data book. October 2017.
[22] H. Yang, N. Sun, and M. Liu. Evaluation of NOAA-20 ATMS geolocation error by using 2-D lunar scan observations, 2019. NOAA ATMS SDR Team.
[23] G. A. Poe. Optimum interpolation of imaging microwave radiometer data. IEEE Transactions on Geoscience and Remote Sensing, 28(5):800–810, Sep 1990.
[24] Yongqian Wang, Jiancheng Shi, Lingmei Jiang, Jinyang Du, and Bangsen Tian. The development of an algorithm to enhance and match the resolution of satellite measurements from AMSR-E. 54:410–419, 03 2010.
[25] Eyre, J. R. An introduction to GPS radio occultation and its use in numerical weather prediction. GRAS SAF Workshop on Applications of GPS radio occultation measurements, ECMWF, 16-18 Jun 2008. [26] Wikipedia. Radiosonde. https://en.wikipedia.org/wiki/Radiosonde.
[27] NOAA. “Numerical Weather Prediction.” [Online]. Available:
https://www.ncdc.noaa.gov/data-access/model-data/model-datasets/numerical-weather-prediction.
[28] F. Weng, et al., “Calibration of Suomi national polar‐orbiting partnership advanced technology microwave sounder,” J. Geophys. Res. Atmos., vol. 118, issue 19, Oct. 2013 pp. 11,187–11,200. [29] R. V. Leslie, W. J. Blackwell, et al., "Pre-launch Calibration of the
NASA TROPICS Constellation Mission," IGARSS 2020 - 2020 IEEE
International Geoscience and Remote Sensing Symposium, Wailoloa,
2020, in review.
[30] J. Zhou, H. Yang and K. Anderson, "SNPP ATMS On-Orbit Geolocation Error Evaluation and Correction Algorithm," in IEEE
Transactions on Geoscience and Remote Sensing, vol. 57, no. 6, pp.
3802-3812, June 2019, doi: 10.1109/TGRS.2018.2887407.
[31] Fuzhong Weng and Xiaolei Zou, "Errors from Rayleigh–Jeans approximation in satellite microwave radiometer calibration systems," Appl. Opt. 52, 505-508 (2013).
B
IOGRAPHYAngela Crews received a B.S. in
aerospace engineering from the United States Naval Academy, Annapolis, MD in 2004. She received dual M.S. degrees in aeronautical engineering and astronautical engineering from the Air Force Institute of Technology, Dayton, OH in 2012. In 2019, Crews received a Ph.D. in aerospace engineering from the Massachusetts Institute of Technology, Cambridge, MA. From 2004 to 2015, she served in the United States Marine Corps (USMC) as an EA-6B Electronic Countermeasures Officer (ECMO) and as a Space Operations Officer. At MIT, Crews was a member of the Space, Telecommunications,
Astronomy, and Radiation (STAR) Laboratory. Her research was focused on calibration and validation for miniaturized microwave radiometers. Crews is currently a Space Subject Matter Expert (SME) at ManTech International.
Kerri Cahoy is an Associate Professor
of Aeronautics and Astronautics at MIT and leads the Space Telecommunications, Astronomy, and Radiation (STAR) Laboratory. Cahoy received a B.S. (2000) in Electrical Engineering from Cornell University, and M.S. (2002) and Ph.D. (2008) in Electrical Engineering from Stanford University. Dr. Cahoy previously worked at Space Systems Loral, as a postdoctoral fellow at NASA Ames, and currently leads nanosatellite atmospheric sensing, optical communications, and exoplanet technology demonstration missions.
William J. Blackwell (M’02–
SM’07–F’19) received the Sc.D. degree in electrical engineering and computer science from MIT in 2002. He is now the Associate Leader of the Applied Space Systems Group at MIT Lincoln Laboratory. His research involves environmental monitoring using ground, air, and space-based sensors, and he now serves as the Principal Investigator for the NASA TROPICS Earth Venture mission.
R. Vincent Leslie received the B.S.
degree from Boston University, Boston, MA, USA, and the M.S. and Ph.D. degrees from Massachusetts Institute of Technology (MIT), Cambridge, MA, in 1998, 2000, and 2004, respectively, all in electrical engineering.
He was a Graduate Research Assistant with the Remote Sensing and Estimation Group, Research Laboratory of Electronics, MIT, specializing in passive microwave radiometry. He is a member of the Technical Staff in the Applied Space Systems Group at MIT Lincoln Laboratory and currently the TROPICS Instrument Scientist.
Michael Grantreceived the M.E. and Ph.D. degrees in Electrical and Computer Engineering from the University of Virginia. Since 1987 he has been with the NASA-Langley Research Center, in Hampton, Virginia, working in the areas of spaceflight electronics design, systems engineering, and signal processing on a number of Space Shuttle, aircraft- and satellite-based atmospheric science projects. He is currently the Chief Engineer covering the TROPICS project for the Langley Technical Authority. Dr. Grant’s research interests include earth remote sensing, image processing, and pattern classification.
Dr. Hu Yang, IEEE member,
received his Ph.D degree from the Institute of Remote Sensing Application, China Academy of Science, Beijing, in 2003. His main study field includes passive microwave radiometer calibration/validation, satellite geolocation, and satellite observation simulation. During 2003-2011, He was senior research scientist in national satellite meteorological center, china meteorological administration, leading the microwave instrument calibration and satellite ground application system development as the instrument scientist and program scientist. Since 2012, he joined the Earth System Science Interdisciplinary Center (ESSIC), University of Maryland, working on NPP/JPSS ATMS calibration/validation. He has published over 40 peer reviewed journals.


![[PDF] Tutoriel informatique d Architecture des Ordinateurs pdf | Cours informatique](data:image/gif;base64,R0lGODlhAQABAIAAAP///wAAACH5BAEAAAAALAAAAAABAAEAAAICRAEAOw==)