HAL Id: hal-01605722
https://hal.archives-ouvertes.fr/hal-01605722
Submitted on 28 May 2020
HAL is a multi-disciplinary open access
archive for the deposit and dissemination of
sci-entific research documents, whether they are
pub-lished or not. The documents may come from
teaching and research institutions in France or
abroad, or from public or private research centers.
L’archive ouverte pluridisciplinaire HAL, est
destinée au dépôt et à la diffusion de documents
scientifiques de niveau recherche, publiés ou non,
émanant des établissements d’enseignement et de
recherche français ou étrangers, des laboratoires
publics ou privés.
ecotone in Northern China based on physical
vulnerability assessment
Zhiqiang Wang, Jingyi Jiang, Qing Ma
To cite this version:
Zhiqiang Wang, Jingyi Jiang, Qing Ma. The drought risk of maize in the farming-pastoral ecotone
in Northern China based on physical vulnerability assessment. Natural Hazards and Earth System
Sciences, European Geosciences Union, 2016, 16 (12), pp.2697 - 2711. �10.5194/nhess-16-2697-2016�.
�hal-01605722�
www.nat-hazards-earth-syst-sci.net/16/2697/2016/ doi:10.5194/nhess-16-2697-2016
© Author(s) 2016. CC Attribution 3.0 License.
The drought risk of maize in the farming–pastoral ecotone in
Northern China based on physical vulnerability assessment
Zhiqiang Wang1,2, Jingyi Jiang2,3, and Qing Ma4,5
1National Disaster Reduction Center/Satellite Application Center for Disaster Reduction of the Ministry of Civil Affairs,
Beijing 100124, China
2Key Laboratory of Disaster Reduction and Emergency Response, Ministry of Civil Affairs, Beijing 100124, China 3INRA-EMMAH UMR 1114, 84914 Avignon, France
4College of Geography, Beijing Normal University, Beijing 100875, China 5Chongqing No.18 High School, Chongqing 400020, China
Correspondence to:Jingyi Jiang (jiangjingyi1989@163.com)
Received: 6 June 2016 – Published in Nat. Hazards Earth Syst. Sci. Discuss.: 30 June 2016 Revised: 10 November 2016 – Accepted: 19 November 2016 – Published: 15 December 2016
Abstract. Climate change is affecting every aspect of hu-man activities, especially the agriculture. In China, extreme drought events caused by climate change have posed a great threat to food safety. In this work we aimed to study the drought risk of maize in the farming–pastoral ecotone in Northern China based on physical vulnerability assessment. The physical vulnerability curve was constructed from the relationship between drought hazard intensity index and yield loss rate. The risk assessment of agricultural drought was conducted from the drought hazard intensity index and physical vulnerability curve. The probability distribution of drought hazard intensity index decreased from south-west to north-east and increased from south-east to north-west along the rainfall isoline. The physical vulnerability curve had a re-duction effect in three parts of the farming–pastoral ecotone in Northern China, which helped to reduce drought hazard vulnerability on spring maize. The risk of yield loss ratio calculated based on physical vulnerability curve was lower compared with the drought hazard intensity index, which suggested that the capacity of spring maize to resist and adapt to drought is increasing. In conclusion, the farming– pastoral ecotone in Northern China is greatly sensitive to cli-mate change and has a high probability of severe drought hazard. Risk assessment of physical vulnerability can help better understand the physical vulnerability to agricultural drought and can also promote measurements to adapt to cli-mate change.
1 Introduction
Climate change and its influence on human activity have gained more and more attention from different fields and communities. In the past 30 years, the global surface tem-perature kept the linear growth trend and the frequency and intensity of extreme climate events increased (IPCC, 2014). Even though many measures have been taken to tackle cli-mate change, these tendencies will remain. In arid areas, wa-ter shortage resulting from climate change during the crop growing stage will lead to loss of yield, increasing frequency of agricultural drought and threatened food security (FAO, 2013; Wheeler and von Braun, 2013). In Africa, climate change will amplify existing stress on water availability and agricultural systems, particularly in semi-arid environments. In Asia, agricultural productivity for crops like rice will de-cline because of climate change in many subregions (IPCC, 2014). For China, drought is one of the most obvious per-formances of climate change (Piao et al., 2010). In the past 60 years, China has suffered a number of severe drought haz-ards, which caused great loss of agricultural production (Zou et al., 2005). A hazard is a dangerous phenomenon, sub-stance, human activity or condition that may cause loss of life, injury or other health impacts, property damage, loss of livelihoods and services, social and economic disruption, or environmental damage (UNISDR, 2009). Better understand-ing and evaluation of agricultural drought hazard can help people improve the ability to respond to agricultural drought
hazard and put forward countermeasures to reduce risk of agricultural drought hazard in high-risk areas.
Risk is defined as the combination of the probability of an event and its negative consequences (UNISDR, 2009). As the core of disaster risk assessment, studies of vulnerabil-ity have been widely applied in many different fields, such as ecology, public health and global climate change (Füssel, 2007). Initially, vulnerability was defined as the human re-sponse to hazard events (Blaikie and Cannon, 2004; FAO, 2001). Gradually, vulnerability has acquired new meanings, including how the different systems of human society re-spond to hazard, the interaction process of factors like na-ture, society, economy and environment (UNDP, 2004), the sensitivity or susceptibility to hazards and the capacity to cope with hazards and adapt to them (IPCC, 2014). Many methods have been proposed to assess vulnerability. Statis-tical method builds the relationship between impact factors and vulnerability to reflect the characteristic of vulnerability (Simelton et al., 2009), but this method cannot consider dif-ferent kinds of factors synthetically. Other kinds of methods, like fuzzy modelling or the multi-indicator method (Antwi-Agyei et al., 2012; Kim et al., 2015), can provide a compres-sive assessment for different impact factors. However, the fuzzy modelling method is restricted by background knowl-edge and information. Therefore, it is hard to set weight for different indicators. For the multi-indicator method, some information will be dropped during the process of integrat-ing different indicators. Cluster analysis method can con-sider different impact factors separately and determine the most vulnerable places based on different combinations of the components of vulnerability (Sharma and Patwardhan, 2008). The advantage of this method is its ability to main-tain information from different factors completely. Com-pared with fuzzy modelling and the multi-indicator method, the cluster analysis method can provide richer information for decision makers. However, this method is always re-stricted to a qualitative description of vulnerability, and it cannot quantitatively describe the vulnerability of a hazard-affected body.
However, none of the studies discussed above consider physical factors and social factors separately. This restricts the ability of the model to separate the mechanism of disas-ter from it formation. Different from the system vulnerability caused by social factors, physical vulnerability is an internal characteristic of hazard-affected bodies. It is the capacity of a hazard-affected body to respond to, resist and recover from a strike caused by nature or human beings (Wang et al., 2013). Many studies have quantitatively analysed the physical vul-nerability of different disasters: Uzielli et al. (2008) utilised the relationship between landslide intensity and the suscepti-bility of vulnerable elements to quantitatively estimate phys-ical vulnerability of the built environment and population to landslides. Douglas (2007) used fragility curves to model physical vulnerability for evaluation of earthquake and land-slide risk. For physical vulnerability of agricultural drought
hazard, most studies chose geographical statistical methods or a different drought index with meteorology, hydrology or remote sensing data to calculate the distribution of drought hazard risk (Kellner and Niyogi, 2014; Karavitis et al., 2014; Jain et al., 2015; Murthy et al., 2015). However, none of these studies considered the relationship between meteoro-logical factors and crop water stress during the process of crop growth, making it hard to determine the physical vulner-ability of crops to drought hazard. Based on the crop growth model, Wang et al. (2013) proposed a hazard–loss curve to construct the relationship between drought hazard intensity and crop yield loss, and they utilised the curve to simu-late the physical vulnerability of hazard-affected crops with an environmental-policy-integrated climate (EPIC) model. Since the drought hazard intensity is calculated from the ac-cumulation of crop daily water stress, the physical vulnera-bility curve can better reflect the biophysics regulation dur-ing crop growth and avoid errors caused by the integration of multi-parameters. Physical vulnerability curve makes the drought hazard vulnerability become a parameter, which can be described quantitatively in a dynamic process and pro-vides the probability for assessing physical vulnerability of agricultural drought hazard from the aspect of disaster mech-anism.
To construct the physical vulnerability curve, the key point is to calculate the drought hazard intensity index and the cor-responded crop yield loss ratio. In a previous study (Wang et al., 2015), a new method was proposed to determine drought hazard intensity index based on the daily water stress from the EPIC model and yield loss contribution rates for differ-ent growth stages. In this study, the risk assessmdiffer-ent of agri-cultural drought was conducted from the physical vulnera-bility curve. Firstly, under the circumstances of no irrigation, the drought hazard intensity index was calculated from the daily water stress and yield loss contribution rates for differ-ent growth stages. Based on the distribution of drought haz-ard intensity index, the risk of drought hazhaz-ard intensity index in different regions was analysed. Then, the yield loss ratio was obtained from the difference of yield with two different scenarios (sufficient irrigation and no irrigation). With the spatial distribution of drought hazard intensity index, sites with a different drought hazard intensity index and yield loss ratio were selected. A logistic model was used to simulate the physical vulnerability curve of crops from the relation-ship between hazard and loss. According to the physical vul-nerability curve, both the physical vulvul-nerability assessment and risk assessment of yield loss ratio were analysed.
Ecotone is defined as a multi-dimensional environmental interaction zone between ecological systems (Hufkens et al., 2009). Because of its sensitivity to climatic variation, en-vironmental change and human activity, an ecotone tends to shift in space and time over several spatial scales (Kark, 2013). For example, the African Sahel is regarded as a typi-cal ecotone that is influenced by fluctuations in climate and human activities (Herrmann et al., 2005; Rian et al., 2009).
In East Asia, the farming–pastoral ecotone in Northern China stretching across the monsoon fringe area from the south-west to the north-east is dominated by adjacent ecological systems of steppes and crops (Lu and Jia, 2013). As a typ-ical ecotone with the largest area and longest span in the world, the farming–pastoral ecotone in Northern China is highly sensitive to climate change in East Asia. Many re-searchers utilised historical meteorological data, including temperature, precipitation and remote sensing data, to com-positely analyse the impacts of climate change and socioe-conomic factors on boundary shifts and land-use change of the farming–pastoral ecotone in Northern China (Liu et al., 2011; Ye and Fang, 2013; Geng et al., 2014; Shi et al., 2014). Results show that the extent of the farming–pastoral ecotone in Northern China greatly fluctuated in accordance with the variability of precipitation (Lu and Jia, 2013; Geng et al., 2014). Meanwhile, the dry climate conditions and long-term excessive human activity have made desertification in this re-gion a serious environmental problem that affects the econ-omy and societal development (Xu et al., 2014). Based on the simulation from a land-use scenario dynamic model, it is pre-dicted that the farming–pastoral ecotone in Northern China will become increasingly vulnerable with hotspots for land-use change becaland-use of intensified drying trends (Geng et al., 2014). Therefore, the farming–pastoral ecotone in Northern China was chosen as the study area in this study. In addi-tion, since spring maize, which is a kind of drought-resistant crops, is widely planted in this region, it was selected as a typical crop for the risk assessment of physical vulnerabil-ity in the farming–pastoral ecotone in Northern China. The assessment results showed that the farming–pastoral ecotone in Northern China is a region with a high risk of agricultural drought. To better adapt to drought, more attention should be paid in this region and more methods such as changing the growth environment of crops to reduce the strength of drought hazard intensity index, developing improved vari-eties of crops to reduce physical vulnerability of agricultural drought and reducing crop exposure to drought during the planting process should be adopted in response to climate change.
2 Data and methodology
2.1 Study area and data
2.1.1 Study area
The farming–pastoral ecotone in Northern China is sensi-tive to climate change and belongs to a rain-fed agricul-tural region that is fragile in ecology based on agriculagricul-tural drought hazard risk assessment of this region. It can re-flect the spatial-temporal variation of drought hazard result-ing from climate change. There exist many different defi-nitions of the farming–pastoral ecotone in Northern China.
In general, it is located in the northern part of China, with the rainfall isoline changing from 300 to 400 mm, annual precipitation change ranging from 15 to 30 % and dryness change ranging from 1.0 to 2.0 (Zhao et al., 2002). The pre-cipitation period is between June and August with large in-terannual variation. According to the distribution of land-form and vegetation zonality, the farming–pastoral ecotone in Northern China can be classified into three parts: the east-ern part, the middle part and the westeast-ern part. The easteast-ern part is the transition area of the Northeast China Plain and the Inner Mongolian Plateau, with vegetation types changing from warm temperate deciduous forests to temperate forest steppe. The annual average temperature ranges from 3 to 7◦. The middle part transitions from the North China Plain to Loess Plateau with the vegetation changing from warm tem-perate deciduous forests to temtem-perate grassland. Because of the relatively high altitude, the annual average temperature here ranges from 0 to 1◦. The western part is the transition
area from the Loess Plateau to the Qinghai–Tibet Plateau, with the vegetation changing from warm temperate decidu-ous forests to temperate desert steppe. The annual average temperature ranges from 6 to 9◦. Figure 1 shows the location and the land use of the farming–pastoral ecotone in North-ern China. The eastNorth-ern part, middle part and westNorth-ern part of the farming–pastoral ecotone in Northern China are lo-cated from east to west respectively. The blue triangles rep-resent 54 meteorological stations covering the whole region and the yellow regions are cultivated land. Different shades of black lines show the change of rainfall isolines, which in-crease from north-west to south-east and extend along the direction of north-east to south-west.
2.1.2 Data
The data used in this study include meteorological data of the farming–pastoral ecotone in Northern China from 1966 to 2011, soil data and agricultural data (Table 1). The daily me-teorological data came from 54 meme-teorological stations in the study area. Daily solar radiation information was recorded at 27 stations. The daily solar radiation data for the re-maining stations were estimated based on the sunshine du-ration data using the Angstrom–Prescott model (Angstrom, 1924; Prescott, 1940). The soil texture data were retrieved from “Chinese Soil Genus Records” and transformed into the USDA soil-type system (Skaggs et al., 2001).
2.2 Methodology
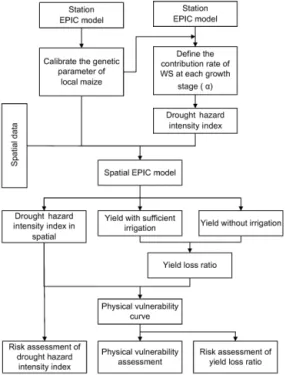
The process of assessment is shown in Fig. 2. Since the dis-aster risk (R) is the function of hazard factor (H ), physical vulnerability (V ), exposure (E) and the disaster reduction ca-pacity of the hazard-affected body to hazard (CH), physical
vulnerability (CV) and exposure (CE) (Eq. 1), under the
as-sumption that all maize was exposed to drought hazard, both hazard intensity index and the physical vulnerability curve
Figure 1. Location and the land-use map of the farming–pastoral ecotone in Northern China.
Table 1. Meteorological, soil and relative agricultural data
Database Content Source
Meteorological data Daily data from 1960 to 2011: precipitation, temperature, radiation, wind speed and relative humidity
China meteorological data sharing service system of the China Meteorological Adminis-tration
Spatial distribution of soil 1 : 1 000 000 soil map of the study area Institute of Soil Science, Chinese Academy of Sciences
Soil properties Soil layers, texture data, organic carbon and so on
Chinese Soil Genus Records
Land-use map Land-use map of the study area in 2000. The main land-use type includes paddy field, dry land, forest land, grassland and so on
Institute of Remote Sensing and Digital Earth Chinese Academy of Sciences
Statistical agricultural data Fertilisation, sowing area, yields from 1966 to 2011
China Statistical Yearbook
were simulated with the EPIC model to assess the risk of spring maize in the farming–pastoral ecotone in Northern China.
R = H × V × E CH×CV×CE
(1)
The station EPIC model was used to calibrate the genetic pa-rameter of local maize. Then a water-deficit experiment on different growth stages was conducted to calculate the yield loss contribution rate. Therefore, the maize drought hazard intensity index was defined based on daily water stress and the yield loss contribution rate. Added with the spatial data in the time series, the spatial EPIC model was used to calcu-late the spatial maize drought hazard intensity index. Mean-while, the yield loss ratio was obtained from the difference of yield under two different simulated scenarios with the EPIC model (One was sufficient irrigation and the other one was no irrigation). After this, the physical vulnerability curve was
constructed from sites under different drought hazard inten-sity using logistic regression model to describe the relation-ship between drought hazard and yield loss. According to the function of disaster risk, the risk assessment of drought haz-ard was conducted from three aspects: the first aspect was the risk assessment of drought hazard intensity index, the second was physical vulnerability assessment of spring maize based on a physical vulnerability curve and the third one was the risk assessment of yield loss ratio calculated from a physical vulnerability curve.
2.2.1 Drought hazard intensity index
The EPIC model is a field-scale crop model that is capable of simulating daily crop growth, calculating crop yield under various climate and environmental conditions and perform-ing long-term simulations for hundreds of years (Gassman et al., 2005). In recent years, the EPIC model has been ap-plied in different fields, including climate change (Izaurralde
Figure 2. Flow chart of drought risk based on physical vulnerability assessment.
Figure 3. Calibration of the genetic parameters using the recorded yields of spring maize at Baicheng, Datong and Yulin stations.
et al., 2012; Rinaldi and De Luca, 2012), simulation of crop yields (Pumijumnong and Arunrat, 2013; Xiong et al., 2014) and drought disaster risk assessment (Jia et al., 2012; Wang et al., 2013). For different kinds of crops, genetic parameters used in the EPIC model vary with different varieties and ge-ographical conditions. Therefore, before simulation with the EPIC model, it is necessary to localise the genetic parame-ters of crops based on the field measurements. In addition, parameters like soil parameters, filed management parame-ters and daily meteorological data are also input parameparame-ters for running EPIC model.
According to the three parts of the farming–pastoral eco-tone in Northern China defined in the last section, we chose three representational stations (eastern part: Baicheng,
mid-Figure 4. Validation of the genetic parameters using the recorded yields of spring maize at six stations in the study area from 2000 to 2005.
dle part: Datong, western part: Yulin) to calculate genetic parameters of spring maize for each part. At each station, the annual yields of spring maize from 2000 to 2005 from agricultural statistic yearbooks were selected as the recorded yields to adjust the genetic parameters. In addition, the daily meteorological data from 2000 to 2005, the soil data and the field management data were all put into the station EPIC models. The genetic parameters such as energy biomass con-version factor and harvest index were finally determined af-ter a number of adjustments based on the comparison be-tween the model output crop yields and the recorded data. The simulation results of spring maize for each station are demonstrated in Fig. 3. To validate the accuracy of the de-termined genetic parameters, the annual yields from agri-cultural statistic yearbooks at another six stations (Chifeng, Tongliao, Zhangjiakou, Jining, Guyuan and Dingxi) within the study area from 2000 to 2005 were selected. Figure 4 shows the validation results between the simulated results and the recorded yields. The correlation coefficient R2 is 0.86. Seen from the validation result, the determined genetic parameters of spring maize were appropriate for this study. For the difference between simulated results and recorded data, errors mainly came from the input data of the station EPIC models, including daily meteorological data and yield management data.
After running the EPIC model, parameters that describe the growth state of crops are output. Among them, water stress, which can reflect the relationship between water sup-ply and demand during the crop growth process, is an im-portant parameter in risk assessment of agricultural drought. Therefore, during the calculation of drought hazard intensity index, water stress is selected as the main factor to describe the intensity of drought. In addition, because water stress will have a different influence on crop yield in different crop growing stages, so the yield loss contribution rate of water
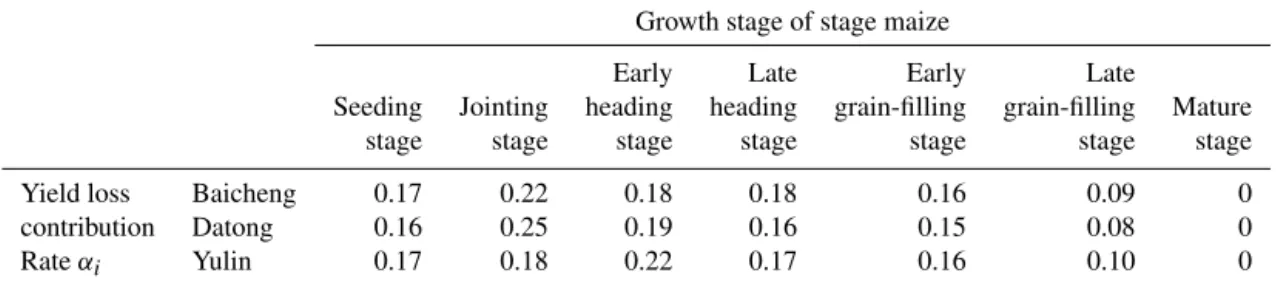
Table 2. Yield loss contribution rate α at Baicheng, Datong and Yulin.
Growth stage of stage maize
Early Late Early Late
Seeding Jointing heading heading grain-filling grain-filling Mature stage stage stage stage stage stage stage Yield loss Baicheng 0.17 0.22 0.18 0.18 0.16 0.09 0 contribution Datong 0.16 0.25 0.19 0.16 0.15 0.08 0 Rate αi Yulin 0.17 0.18 0.22 0.17 0.16 0.10 0
stress (α) (Wang et al., 2015), which is calculated from the proportion of yield reduction rate in each stage to the sum-mary of the yield reduction rate in different stages (Eq. 2), is also used to reflect water critical periods for crop yields. Based on crop growth regulation, m stages of crop growth are defined. αi= yieldi m P i=1 yieldi , (2)
where yieldi=Yi/ Ys, Ys is the yield under sufficient soil
water supply and Yi is the yield under water shortage in
growth stage i. The number of growth stages is m.
Based on the EPIC water stress and the calculated yield loss contribution rate, the equation of drought hazard inten-sity index is as follows (Wang et al., 2015):
DHIyj= n P k=1 αi(1 − WSk) maxDHI , (3)
where DHIyj is the drought hazard intensity index of y year
in unit j , WSk is the water stress on day k, αi is the yield
loss contribution rate of WSk and k belongs to the i growth
stage, n is the total days when there is water stress; max DHI denotes the maximum value of
n
P
k=1
αi(1−WSk)in all the
sim-ulated years and units. DHIyj varies from 0 (0 represents the
minimum intensity of drought hazard) to 1 (1 represents the maximum intensity of drought hazard).
2.2.2 The establishment of the physical vulnerability curve
To determine the impact of water stress on crop yields, both the crop genetic parameters and daily meteorological data af-ter spatial inaf-terpolation are put into the spatial EPIC model. With soil nutrients and ventilation guaranteed, two scenarios (Y 1: sufficient irrigation, Y 2: no irrigation) are set to sim-ulate the growth of the crop. For each unit, the difference of crop yields between two scenarios for each year is the year yield loss under water stress. The proportion between the year yield loss and the maximum yield with sufficient ir-rigation for multiple years in this unit is defined as the yield
loss ratio under water stress (Wang et al., 2013a):
YLyj=
Y1y−Y2y
maxY 1j
, (4)
where YLyj is the loss rate of yield of y year in station j ,
Y1y and Y 2y are the unit yields of y year under scenarios
Y1 and Y 2 and max Y 1yrepresents maximum unit yield of
station j .
Based on drought hazard intensity index and the corre-sponding yield loss rate, the physical vulnerability curve is defined to simulate the relationship between them using the regression analysis method. For each kind of crop, the physi-cal vulnerability curve is an internal property for the hazard-affected body itself. The key point for establishing the phys-ical vulnerability curve is setting up a wide range of scenar-ios from no drought to extreme drought hazard. The more scenarios of drought hazard intensities that are included, the more accurate the physical vulnerability curve will be. In this study, according to the drought hazard intensity index we cal-culated from different evaluation units in different years, we try to select more sites under different scenarios of drought hazard intensities. Then the logistic regression analysis is used to simulate the physical vulnerability curve of the crop from selected points.
2.2.3 Risk assessment of agricultural drought
In this study, drought hazard intensity index and physical vulnerability curve are the two cores of the drought risk as-sessment. Based on the formulation process of agricultural drought hazard, the risk assessment of the drought hazard in-tensity index, the physical vulnerability assessment of spring maize and the risk assessment of yield loss ratio calculated from the physical vulnerability curve were conducted se-quentially. For drought hazard intensity index, since it is cal-culated from crop daily water stress and yield loss contribu-tion rate, it can reflect the degree of agricultural drought on a specific crop. Therefore, the time series, standard deviation and slope of the drought hazard intensity index on each eval-uation unit were calculated to analyse the spatial-temporal distribution of agricultural drought. The probability distri-bution of the drought hazard intensity index was processed for the risk assessment. For the physical vulnerability
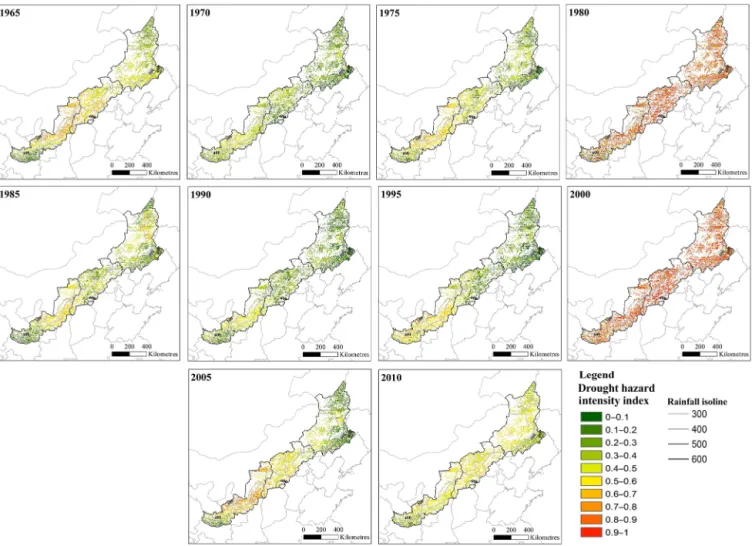
assess-Figure 5. The spatial distribution of spring maize drought hazard intensity index in time series.
ment, it was conducted relying on the physical vulnerabil-ity curve of spring maize. For the yield loss ratio calculated from the physical vulnerability curve, since it is determined by both drought hazard intensity index and the correspond-ing physical vulnerability, the calculated yield loss ratio is a good representative of drought risk. The standard deviation, slope and probability of yield loss ratio were calculated to show the spatial-temporal distribution and probability distri-bution of drought risk.
3 Results
3.1 Risk assessment of maize drought hazard intensity index
Based on the classification method of annual crop climate types (AQSIQ/SAC, 2008), 2002 was selected as the climate normal year to calculate the yield loss contribution rates of water stress at Baicheng, Datong and Yulin with the corre-sponding genetic parameters of the spring maize. According to the growth regulation of spring maize, six growth stages
were determined in Table 2. With the crop yield under suffi-cient irrigation as the comparison, the water-deficit treatment in each growth stage was conducted with each station EPIC model. The resulting yield losses were recorded. According to Eq. (2), the yield loss contribution rates in different growth stages for each station were shown in Table 2. For more de-tails about the experiment on water deficit, Wang et al. (2015) is referenced.
We used the genetic parameters and yield loss contribu-tion rates from three sites to represent genetic parameters and yield loss contribution rates in the eastern, middle and west-ern parts of the farming–pastoral ecotone in Northwest-ern China. With the evaluation unit of 5 km × 5 km area, the interpolated meteorological data from 1966 to 2011 and the genetic pa-rameters for each part were put into the spatial EPIC model. Under the condition of no irrigation, the daily water stress of each evaluation unit in the study area was output. Based on Eq. (3), the spatial distribution of drought hazard intensity index of the farming–pastoral ecotone in Northern China was finally calculated.
Figure 6. Standard deviation of spring maize drought hazard inten-sity index from 1966 to 2011.
Figure 5 shows the distribution of spring maize drought hazard intensity index in the farming–pastoral ecotone in Northern China for every fifth year. For most years, the drought hazard intensity index of spring maize increased from north-east (0.1) to south-west (0.5) and decreased back to 0.1 at the margin of south-west. Compared with the rain-fall isoline, there existed a negative correlation between the drought hazard intensity index and precipitation. For regions with rainfall isoline lower than 300 mm, drought hazard in-tensity index for most years was around 0.5 or 0.6. However, with the rise of precipitation, drought hazard intensity index declined gradually. For regions with rainfall isoline from 500 to 600 mm, most drought hazard intensity indexes centred on 0.1. In general, the middle part and most regions of the west-ern part were the driest part of the whole study area, with an average drought hazard intensity index for multiple years larger than 0.5.
Seen from the time series of drought hazard intensity index in the farming–pastoral ecotone in Northern China, there ex-isted two extreme drought hazards in 1980 and 200, with the average drought hazard intensity index larger than 0.8. For other years, areas with a drought hazard intensity index larger than 0.5 were mainly centred in the western part. A cyclic behaviour with a return period of approximately 20 years ap-pears from 1965 to 2000. Since 2005, regions with a drought hazard intensity index larger than 0.5 spread north-eastward. In 2010, except little areas, the drought hazard intensity in-dex for the whole study ranged from 0.4 to 0.6.
To reveal the fluctuation of drought hazard intensity index of spring maize in time series, the standard deviation from 1966 to 2011 of each evaluation unit in the study area was
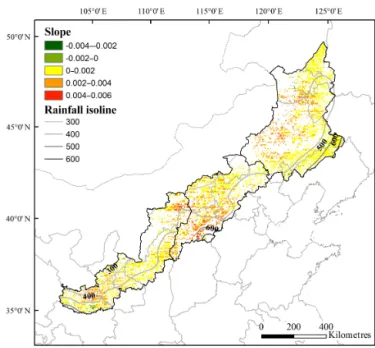
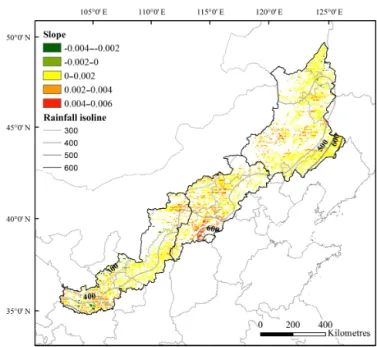
Figure 7. Slope of the linear regression of spring maize drought hazard intensity index from 1966 to 2011.
calculated. Figure 6 is the distribution of standard deviation of spring maize drought hazard intensity index from 1966 to 2011. For most parts, the standard deviation was from 0.1 to 0.3 and had the tendency of decreasing from north-east to south-west. The eastern part had the highest standard devia-tion (0.3), which showed the greatest interannual fluctuadevia-tion of spring maize drought hazard intensity index. But the stan-dard deviation in the western part ranging from 0.1 to 0.2 was relatively low.
In order to describe the variation tendency of drought haz-ard intensity index from 1966 to 2011 in the farming–pastoral ecotone in Northern China, the slope of the linear regression of drought hazard intensity index for 46 years was calcu-lated. Figure 7 is the distribution of the slope of spring maize drought hazard intensity index from 1966 to 2011. Warm-toned colours like red and yellow represent a slope larger than 0 and the increasing tendency of drought hazard inten-sity index, while cool-toned colours like green represent a slope smaller than 0 and the decreasing tendency of drought hazard intensity index. For the whole farming–pastoral eco-tone in Northern China, the change of slope was small, rang-ing from −0.006 to 0.006. But for most parts, the slope was larger than 0, which meant the intensity of drought hazard strengthened. The middle part had the most obvious increas-ing tendency (from 0.002 to 0.006). Next was the eastern part within the rainfall isoline from 300 to 400 mm and then a lit-tle region at the south-west edge of the study area with the slope changing from 0.002 to 0.004.
To access the risk of spring maize drought hazard intensity index in the farming–pastoral ecotone in Northern China, we calculated the exceeded probability of spring maize drought
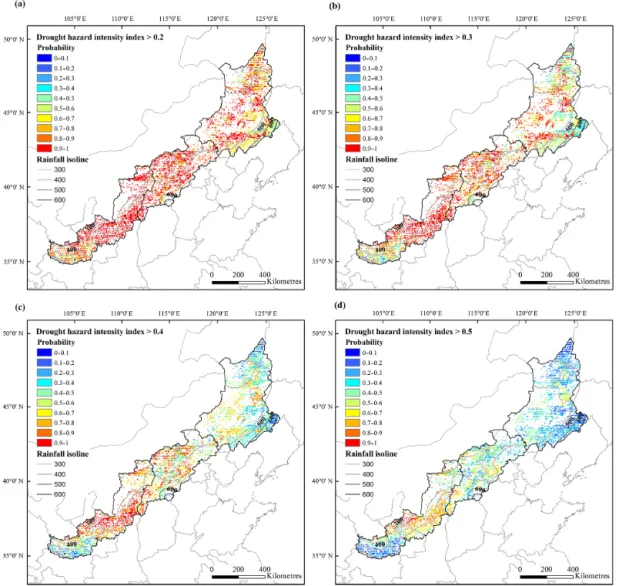
Figure 8. Probability distribution of spring maize drought hazard intensity index for different hazard levels. (a) Drought hazard intensity index ≥ 0.2 (b) drought hazard intensity index ≥ 0.3, (c) drought hazard intensity index ≥ 0.4, (d) drought hazard intensity index ≥ 0.5.
hazard intensity index for each evaluation unit. Through fix-ing the drought hazard intensity index, probability distribu-tion of spring maize drought hazard intensity index with 4 hazard levels was drawn separately: spring maize drought hazard intensity index ≥ 0.2 (Fig. 8a), spring maize drought hazard intensity index ≥ 0.3 (Fig. 8b), spring maize drought hazard intensity index ≥ 0.4 (Fig. 8c) and spring maize drought hazard intensity index ≥ 0.5 (Fig. 8d).
Seen in Fig. 8, the high-value area of the probability was located mostly in the western part and middle part, while the low value area was located in the eastern part within the rain-fall isoline from 500 to 600 mm and the south-west edge of the western part. For most regions of the western part, the upper limit of probability was 1 under four hazard levels. Therefore, the probability is very high that drought hazard and large disaster losses will occur every year. For the mid-dle part, the upper limit of probability under 4 hazard levels from 0.2 to 0.5 was 1, 1, 0.8 and 0.5. Consequently, in this
region, drought hazard with the intensity index of 0.2 and 0.3 will occur nearly every year. The risk level of drought hazard with the intensity index of 0.5 was every 2 years. For these two low-value regions, the upper limit of probability under 4 hazard levels from 0.2 to 0.5 was 1, 0.9, 0.4 and 0.2. These regions will have a drought hazard with the intensity index of 0.2 every year and the risk level of drought hazard with the intensity index of 0.5 at least every 5 years.
3.2 Physical vulnerability curve of spring maize
Based on the genetic parameters of spring maize for three parts of the farming–pastoral ecotone in Northern China, the spatial EPIC model was conducted under two scenarios (Y 1: sufficient irrigation, Y 2: no irrigation). For each evaluation unit, the loss rate of yield was obtained according to Eq. (4). Combined with the spatial distribution of the drought haz-ard intensity index, 50 sites under different drought hazhaz-ard
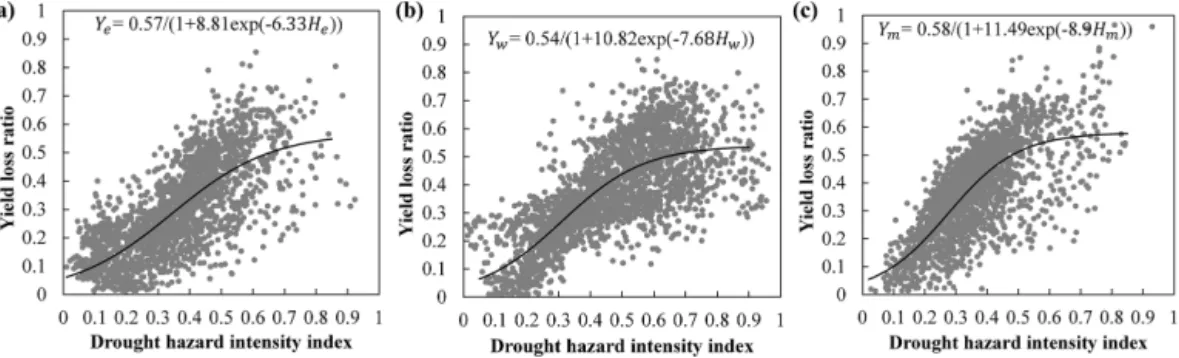
Figure 9. Physical vulnerability curve to drought hazard of spring maize in the (a) eastern part (b) middle part and (c) western part of the farming–pastoral ecotone in Northern China.
intensities were selected for each part to extract drought haz-ard intensity index and the corresponding loss rate of yield for 46 years. For each part of the farming–pastoral eco-tone in Northern China, a scatter diagram that describes the drought hazard intensity curve and yield loss rate is shown in Fig. 9. Each point represents the annual loss rate of yield and drought hazard intensity for a given site. The solid line is the physical vulnerability curve simulated using logistic curve fitting methodology. For each part, the physical vulnerability of spring maize could be evaluated using the physical vulner-ability curve as follows:
Ye= 0.57 (1 + 8.81 × 10−6.33He), (5) Ym= 0.58 (1 + 11.49 × 10−8.9Hm), (6) Yw= 0.54 (1 + 10.821 × 10−7.68Hw), (7)
where Ye, Ymand Ywrepresent the yield loss ratios of spring
maize in the eastern, middle and western parts and He, Hm
and Hware the drought hazard intensity indexes in the
east-ern, middle and western parts, respectively. R2is 0.70 for the eastern part, 0.71 for the middle part and 0.65 for the western part.
Restricted by the meteorological data, it was hard to in-clude every different meteorological scenario in theoretical-like extreme drought (H = 1) or no drought (H = 0) to sim-ulate a real physical vulnerability curve for drought hazard of spring maize. In addition, errors from meteorological data and the model itself might also have impacts on simulation results. Considering the accuracy of the input data and some uncertainties during the calculation process, the simulated drought physical vulnerability curve of spring maize for each part was satisfied in this study.
Comparing three different kinds of spring maize planted in the study area, the physical vulnerability curve of spring maize for each part is slightly different. However, as these three regions are adjacent and are all located in the farming– pastoral ecotone in Northern China, which is relatively dry, the difference is not obvious. For each curve, at the beginning
stage the yield loss ratio is mild, with low drought hazard in-tensity index (0 to 0.2). Then the increase of yield loss ratio is swift, with middle drought hazard intensity index (0.2 to 0.6). For the last stage, the yield loss ratio reaches the highest point and becomes stable, with high drought hazard intensity index (0.6 to 1). For each part of the study area, all of these curves are below or near the 1 : 1 line, which shows the re-duction effect of drought hazard intensity and the rere-duction of drought hazard vulnerability on spring maize.
3.3 Risk assessment of yield loss ratio based on the physical vulnerability curve
We assumed that the spring maize in the study area was com-pletely exposed to drought hazard, making the drought risk of spring maize mainly determined by the drought hazard intensity index and its vulnerability under this drought haz-ard intensity. Therefore, in this section we put the calculated drought hazard intensity index of each evaluation unit into the physical vulnerability curve to get the simulated yield loss ratio. The risk assessment was conducted on the basis of the distribution of yield loss ratio for each unit.
To describe the change of yield loss ratio in time series, both the standard deviation and the slope of yield loss ra-tio from 1966 to 2011 were calculated for each evaluara-tion unit. Figure 10 is the distribution of standard deviation of yield loss ratio in the farming–pastoral ecotone in Northern China. Similar to the standard deviation of the drought haz-ard intensity index, the standhaz-ard deviation of yield loss ra-tio also showed the tendency to decline from north-east to south-west. Conversely, because of the reduction effect of the physical vulnerability curve, the standard deviation of yield loss ratio was slightly lower than that of the drought hazard intensity index. Here the standard deviation of yield loss ratio for the eastern part was from 0.1 to 0.3. For the middle and western parts, it ranged from 0 to 0.2. Conse-quently, the interannual instability of yield loss was reduced. Figure 11 is the slope of linear regression of yield loss ratio. Slope larger than 0 is showed with warm-toned colours and represents the increasing tendency of yield loss ratio, while slope smaller than 0 is showed with cool-toned colours and
Figure 10. Standard deviation of spring maize yield loss ratio from 1966 to 2011.
represents the decreasing tendency of yield loss ratio. The same increasing tendency as slope of drought hazard inten-sity index was demonstrated. Conversely, impacted by the reduction effect of the physical vulnerability curve, the ris-ing trend was slightly lower compared with the slope of the drought hazard intensity index. Here the highest values of slope of yield loss ratio (exceeding 0.004) centred in the mid-dle part, while the other parts changed from 0 to 0.002.
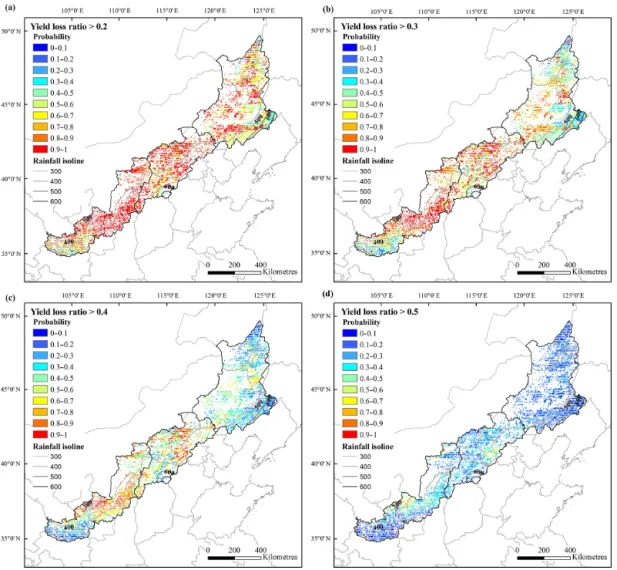
To assess the risk of yield loss ratio based on physical vul-nerability curve in the farming–pastoral ecotone in Northern China, we calculated the exceeded probability of yield loss ratio for each evaluation unit. With fixed yield loss ratio lev-els (spring maize yield loss ratio ≥ 0.2, spring maize drought yield loss ratio ≥ 0.3, spring maize yield loss ratio ≥ 0.4 and spring maize yield loss ratio ≥ 0.5), the probability distribu-tions of yield loss ratio are shown in Fig. 12. Seen from the whole study area, under different yield loss ratio levels, the middle part and most regions of the western part were high-risk areas of drought hazard, with the upper limit of proba-bility under yield loss ratio levels from 0.2 to 0.5 being 1, 1, 0.8 and 0.5. This meant that the drought hazard in these re-gions would result in a yield loss ratio of 0.2 and 0.3 almost every year. The drought hazard with a yield loss ratio of 0.5 would also occur at least every 2 years. Comparatively, the eastern part within the rainfall isoline from 500 to 600 mm and the south-west edge of the western part were areas with low probability of drought hazard. The upper limit of proba-bility under 4 hazard levels from 0.2 to 0.5 was 0.8, 0.5, 0.2 and 0.2. Therefore, this part was more likely to meet drought hazard with a yield loss ratio smaller than 0.2. The probabil-ity of drought hazard with a yield loss ratio of 0.4 was every 5 years.
Figure 11. Slope of the linear regression of spring maize yield loss ratio from 1966 to 2011.
In general, the probability distribution of the spring maize yield loss ratio was similar to the probability distribution of drought hazard intensity index. The risk of yield loss ratio dropped from arid to humid regions. Because physical vul-nerability curves of all three parts showed reduction effect of drought hazard, the probability of yield loss ratio was slightly lower than that of the drought hazard intensity index.
4 Discussion
Since the disaster risk is the function of hazard factor, phys-ical vulnerability, exposure and the disaster reduction capac-ity of the hazard-affected body, based on the assumption that all maize was exposed to drought hazard, the drought haz-ard intensity index was calculated with the EPIC model and the physical vulnerability curve was established for differ-ent parts of the farming–pastoral ecotone in Northern China. The risk assessment of drought hazard in the study area was discussed from three aspects: the first is the risk assessment of the drought hazard intensity index for spring maize. For the spatial distribution of drought hazard intensity index, it had a negative correlation with precipitation. For most years, 400 mm rainfall isoline was approximately consistent with a drought hazard intensity index of 0.5. For regions with rain-fall isoline less than 400 mm, drought hazard intensity index here was usually larger than 0.5, while for regions with a rainfall isoline higher than 400 mm, drought hazard intensity index was usually smaller than 0.5. For the time series of drought hazard intensity index, the time variation of drought hazard intensity index was consistent with the interannual variation of precipitation. For the eastern part, the interannual
Figure 12. Probability distribution of spring maize yield loss ratio for different yield loss levels. (a) Yield loss ratio ≥ 0.2, (b) yield loss ratio ≥0.3, (c) Yield loss ratio ≥ 0.4, (d) yield loss ratio ≥ 0.5.
variation of precipitation was larger and presented the ten-dency of worsening drought, making the standard deviation higher. Conversely, for most of the western part, the situa-tion of drought was relatively stable and the interannual vari-ation of precipitvari-ation was smaller, showing lower standard deviation of drought hazard intensity index. Also, for most regions in the study area, the drought hazard intensity index presented an increasing tendency throughout years. Drought hazard of a severe degree was spreading west to north-east in recent years. For the probability of drought hazard inten-sity index, it showed a tendency to decrease from south-west to north-east and the tendency to increase from south-east to north-west along the distribution of rainfall isoline. The second aspect is the physical vulnerability assessment based on the physical vulnerability curve. For three parts of the farming–pastoral ecotone in Northern China, similar physi-cal vulnerability curves were obtained. All of them showed the reduction effect of drought hazard intensity index. The third aspect is the risk assessment of yield loss ratio
calcu-lated from the physical vulnerability curve. Adjusted by the physical vulnerability curve of spring maize, the fluctuation of yield loss ratio was smaller compared with that of drought hazard intensity index. Meanwhile, the increasing tendency of yield loss ratio slowed down and the probability of yield loss ratio was reduced. This meant that because of the phys-ical vulnerability, the capacity of spring maize to resist and adapt to drought was improved.
The risk assessments showed that the farming–pastoral ecotone in Northern China is a region with a high risk of agricultural drought and a high sensitivity to climate change. Three different parts showed different spatial and tempo-ral distributions of drought hazard intensity index and yield loss ratio. Drought is one of the most significant manifesta-tions of climate variability in this region, and severe droughts have become more frequent in recent years. To better adapt to drought, measurements can be taken based on the risk assessment in this study: to reduce the drought hazard in-tensity, the planting environment can be changed, by
im-proving the ability of irrigation or changing soil property through fertilisation and other tillage methods, for exam-ple. To reduce physical vulnerability of crops to agricultural drought, improved varieties of crops can be developed to pro-mote drought-enduring and drought-resistant crops. To re-duce crop exposure to drought, planting structure can be ad-justed during the planting process.
The uncertainty of this study mainly comes from the simu-lation of the EPIC model and the construction of the physical vulnerability curve. For the EPIC model, the uncertainties are from the model itself and input data like meteorologi-cal data, soil data and field management data. For the con-struction of the physical vulnerability curve, the uncertainty is mainly due to the limitation of selected scenarios.
The calculation of the physical vulnerability curve for agricultural drought proposed in this method provides a prob-ability to assess drought risk quantitatively. Compared with the previous method, a more accurate drought hazard inten-sity index was added. According to constructive factors of disaster risk, under the condition of total exposure, the risk assessment was conducted from the drought hazard intensity index, physical vulnerability and the yield loss ratio calcu-lated from the physical vulnerability curve, which gave a synthetic assessment of risk of physical vulnerability to agri-cultural drought of the farming–pastoral ecotone in Northern China. For further study, a larger study area including south-ern and northsouth-ern parts of China will be selected to better as-sess drought risk and describe the impact of climate change on agriculture along different latitudes.
5 Conclusion
This study proposed a method to calculate the physical vul-nerability curve based on the drought hazard intensity index and the yield loss ratio from the EPIC model. The genetic parameters of spring maize were first calculated according to the statistical yearbook. Then a water-deficit experiment on different growth stages was conducted to get the yield loss contribution rate. The drought hazard intensity index was also calculated from the daily water stress and yield loss contribution rate for different growth stages. After this, the yield loss ratio was obtained from the difference of yield with two different simulated scenarios using the EPIC model (one was sufficient irrigation and the other one was no irrigation). Then sites under different drought hazard intensities were se-lected. A logistic model was used to build the relationship be-tween hazard and loss and simulate the physical vulnerability curve. Based on the function of disaster risk, under the con-dition of total exposure, the risk assessment of agricultural drought in the farming–pastoral ecotone in Northern China was conducted from the drought hazard intensity index and physical vulnerability curve. Seen from the drought hazard intensity index, the risk of agricultural drought represented negative correlation with the precipitation. The intensity of
drought hazard has kept rising for the past 46 years and drought hazard with severe extent has been spreading from south-west to north-east gradually. The probability distribu-tion of drought hazard intensity index decreased from south-west to east and increased from south-east to north-west along the rainfall isoline. For the physical vulnerabil-ity curve, its reduction effect in three parts of the farming– pastoral ecotone in Northern China helped reduce drought hazard vulnerability in spring maize. For the curve of risk of yield loss ratio based on physical vulnerability, the prob-ability was lower compared with the drought hazard inten-sity index, which shows the capacity of spring maize to resist drought and its adaptation to drought. Overall, the farming– pastoral ecotone in Northern China is highly sensitive and very fragile to climate change because of its location in sev-eral different transitional zones. Risk assessment of physi-cal vulnerability to agricultural drought in this region can help people better understand physical vulnerability to agri-cultural drought and can also promote measurements from different fields to adapt to the climate change.
6 Data availability
The meteorological data are applied from China meteorolog-ical data sharing service system of the China Meteorologmeteorolog-ical Administration (http://data.cma.cn/). The spatial distribution of soil is got from Institute of Soil Science Chinese Academy of Sciences. The soil properties is got from Chinese Soil Genus Records. The Land-use map is got from Institute of Remote Sensing and Digital Earth Chinese Academy of Sci-ences. The statistical agricultral data is got from China Sta-tistical Yearbook.
Acknowledgements. This work was supported by a grant entitled “Study on Agricultural Drought Risk Formation Mechanism of the Rain-fed Agricultural Typical Area in China” (41001059) from the National Science and Technology Foundation. We also thank the China Meteorological Administration (CMA) for sharing data.
Edited by: S. Fuchs
Reviewed by: two anonymous referees
References
Angstrom, A.: Solar and terrestrial radiation. Report to the interna-tional commission for solar research on actinometric investiga-tions of solar and atmospheric radiation, Q. J. Roy. Meteor. Soc., 50, 121–126, 1924.
Antwi-Agyei, P., Fraser, E. D., Dougill, A. J., Stringer, L. C., and Simelton, E.: Mapping the vulnerability of crop production to drought in Ghana using rainfall, yield and socioeconomic data, Appl. Geogr., 32, 324–334, 2012.
AQSIQ/SAC: GB/T 21986-2008 Assessment of agroclimate im-pact: Classification method of annual crop climate types, Beijing,
General Administration of Quality Supervision, Inspection and Quarantine of the People’s Republic of China/Standardization Administration of the Peoples Republic of China, 2008. Blaikie, P. C. and Cannon, T.: At Risk, natural hazards, people’s
vulnerability and disasters, Disaster and society from hazard as-sessment to risk reduction, Berlin, 75–82, Routledge, 2014. Douglas, J.: Physical vulnerability modelling in natural hazard
risk assessment, Nat. Hazards Earth Syst. Sci., 7, 283–288, doi:10.5194/nhess-7-283-2007, 2007.
FAO: The State of Food Insecurity in the World 2001, in: The mul-tiple dimensions of food security, Rome, 2001.
FAO: The State of Food Insecurity in the World 2013. The multiple dimensions of food security, Rome, 2013.
Füssel, H.-M.: Vulnerability: a generally applicable conceptual framework for climate change research, Global Environ. Chang., 17, 155–167, 2007.
Gassman, P., Williams, W., Benson, J. R., Izaurralde, V. W., Hauck, R. C., Jones, L. C., Atwood, C. A., Kiniry, J. D., Flowers, J. R., and Flowers, J. D.: Historical development and applications of the EPIC and APEX models, Center for Agricultural and Rural Development, Iowa State University, 2005.
Geng, Q., Wu, P., Zhang, Q., Zhao, X., and Wang, Y.: Dry/wet cli-mate zoning and delimitation of arid areas of Northwest China based on a data-driven fashion, J. Arid Land, 6, 287–299, 2014. Herrmann, S. M., Anyamba, A., and Tucker, C. J.: Recent trends in
vegetation dynamics in the African Sahel and their relationship to climate, Global Environ. Chang., 15, 394–404, 2005. Hufkens, K., Scheunders, P., and Ceulemans, R.: Ecotones in
veg-etation ecology: methodologies and definitions revisited, Ecol. Res., 24, 977–986, 2009.
IPCC: Climate Change 2014: Synthesis Report, Contribution of Working Groups I, II and III to the Fifth Assessment Report of the Intergovernmental Panel on Climate Change, 2014. Izaurralde, R. C., Mcgill, W. B., and Williams, J.: Development and
application of the EPIC model for carbon cycle, greenhouse-gas mitigation, and biofuel studies, Pacific Northwest National Lab-oratory (PNNL), Richland, WA, 2012.
Jain, V., Pandey, R. P., and Jain, M.: Spatio-temporal assess-ment of vulnerability to drought, Nat. Hazards, 76, 443–469, doi:10.1007/s11069-014-1502-z, 2015.
Jia, H., Wang, J., Cao, C., Pan, D., and Shi, P.: Maize drought dis-aster risk assessment of China based on EPIC model, Int. J. Dig. Earth, 5, 488–515, 2012.
Karavitis, C. A., Tsesmelis, D. E., Skondras, N. A., Stamatakos, D., Alexandris, S., Fassouli, V., Vasilakou, C. G., Oikonomou, P. D., Gregoriˇc, G., and Grigg, N. S.: Linking drought characteristics to impacts on a spatial and temporal scale, Water Policy, 16, 1172– 1197, 2014.
Kark, S.: Ecotones and ecological gradients, in: Ecological Sys-tems, Springer, 147–160, 2013.
Kellner, O. and Niyogi, D.: FORAGES AND PASTURES SYM-POSIUM: Assessing drought vulnerability of agricultural pro-duction systems in context of the 2012 drought, J. Anim. Sci., 92, 2811–2822, 2014.
Kim, H., Park, J., Yoo, J., and Kim, T.-W.: Assessment of drought hazard, vulnerability, and risk: a case study for administrative districts in South Korea, J. Hydroenviron. Res., 9, 28–35, 2015.
Liu, J.-H., Gao, J.-X., Lv, S.-H., Han, Y.-W., and Nie, Y.-H.: Shift-ing farmShift-ing – pastoral ecotone in China under climate and land use changes, J. Arid Environ., 75, 298–308, 2011.
Lu, W. and Jia, G.: Fluctuation of farming-pastoral ecotone in as-sociation with changing East Asia monsoon climate, Climatic Change, 119, 747–760, 2013.
Murthy, C., Yadav, M., Ahamed, J. M., Laxman, B., Prawasi, R., Sai, M. S., and Hooda, R.: A study on agricultural drought vul-nerability at disaggregated level in a highly irrigated and in-tensely cropped state of India, Environ. Monit. Assess., 187, 1– 14, 2015.
Piao, S., Ciais, P., Huang, Y., Shen, Z., Peng, S., Li, J., Zhou, L., Liu, H., Ma, Y., and Ding, Y.: The impacts of climate change on water resources and agriculture in China, Nature, 467, 43–51, 2010.
Prescott, J.: Evaporation from a water surface in relation to solar radiation, T. Roy. Soc. South Aust., 64, 114–118, 1940. Pumijumnong, N. and Arunrat, N.: Simulating the rice yield change
in Thailand under SRES A2 and B2 scenarios with the EPIC model, J. Agri-Food Appl. Sci., 1, 119–125, 2013.
Rian, S., Xue, Y., MacDonald, G. M., Touré, M. B., Yu, Y., De Sales, F., Levine, P. A., Doumbia, S., and Taylor, C. E.: Analysis of climate and vegetation characteristics along the Savanna-Desert ecotone in Mali using MODIS data, GISci. Remote Sens., 46, 424–450, 2009.
Rinaldi, M. and De Luca, D.: Application of EPIC model to as-sess climate change impact on sorghum in southern Italy, Ital. J. Agron., 7, 74–85, 2012.
Sharma, U. and Patwardhan, A.: Methodology for identifying vul-nerability hotspots to tropical cyclone hazard in India, Mitig. Adapt. Strat. Gl., 13, 703–717, 2008.
Shi, W., Tao, F., Liu, J., Xu, X., Kuang, W., Dong, J., and Shi, X.: Has climate change driven spatio-temporal changes of cropland in northern China since the 1970s?, Climatic Change, 124, 163– 177, 2014.
Simelton, E., Fraser, E. D., Termansen, M., Forster, P. M., and Dougill, A. J.: Typologies of crop-drought vulnerability: an em-pirical analysis of the socio-economic factors that influence the sensitivity and resilience to drought of three major food crops in China (1961–2001), Environ. Sci. Policy, 12, 438–452, 2009. Skaggs, T., Arya, L., Shouse, P., and Mohanty, B.: Estimating
particle-size distribution from limited soil texture data, Soil Sci. Soc. Am. J., 65, 1038–1044, 2001.
UNDP: Reducing Disaster Risk: A Challenge for Development – a Global Report, United Nations Development Programme, 2004. UNISDR Terminology on Disaster Risk Reduction, available at:
https://www.unisdr.org/we/inform/terminology, 2009.
Uzielli, M., Nadim, F., Lacasse, S., and Kaynia, A. M.: A concep-tual framework for quantitative estimation of physical vulnera-bility to landslides, Eng. Geol., 102, 251–256, 2008.
Wang, Z., He, F., Fang, W., and Liao, Y.: Assessment of physical vulnerability to agricultural drought in China, Nat. Hazards, 67, 645–657, 2013.
Wang, Z., Jiang, J., Liao, Y., and Deng, L.: Risk assessment of maize drought hazard in the middle region of farming-pastoral ecotone in Northern China, Nat. Hazards, 76, 1515–1534, 2015. Wheeler, T. and von Braun, J.: Climate change impacts on global
Xiong, W., Balkoviˇc, J., van der Velde, M., Zhang, X., Izaurralde, R. C., Skalský, R., Lin, E., Mueller, N., and Obersteiner, M.: A calibration procedure to improve global rice yield simulations with EPIC, Ecol. Model., 273, 128–139, 2014.
Xu, D., Li, C., Song, X., and Ren, H.: The dynamics of deserti-fication in the farming-pastoral region of North China over the past 10 years and their relationship to climate change and human activity, CATENA, 123, 11–22, 2014.
Ye, Y. and Fang, X.: Boundary shift of potential suitable agricul-tural area in farming-grazing transitional zone in Northeastern China under background of climate change during 20th century, Chinese Geogr. Sci., 23, 655–665, 2013.
Zhao, H., Zhao, X., Zhang, T., and Zhou, R.: Boundary line on agro-pasture zigzag zone in north china and its problems on eco-environment, Adv. Earth Sci., 17, 739–747, 2002.
Zou, X., Zhai, P., and Zhang, Q.: Variations in droughts over China: 1951–2003, Geophys. Res. Lett., 32, L04707, doi:10.1029/2004GL021853, 2005.