HAL Id: hal-01518785
https://hal.inria.fr/hal-01518785
Submitted on 9 May 2017HAL is a multi-disciplinary open access archive for the deposit and dissemination of sci-entific research documents, whether they are pub-lished or not. The documents may come from teaching and research institutions in France or abroad, or from public or private research centers.
L’archive ouverte pluridisciplinaire HAL, est destinée au dépôt et à la diffusion de documents scientifiques de niveau recherche, publiés ou non, émanant des établissements d’enseignement et de recherche français ou étrangers, des laboratoires publics ou privés.
Distributed under a Creative Commons Attribution - ShareAlike| 4.0 International License
structural connectivity patterns in mild cognitive
impairment
Thomas Jacquemont, Fabrizio de Vico Fallani, Anne Bertrand, Stéphane
Epelbaum, Alexandre Routier, Bruno Dubois, Harald Hampel, Stanley
Durrleman, Olivier Colliot
To cite this version:
Thomas Jacquemont, Fabrizio de Vico Fallani, Anne Bertrand, Stéphane Epelbaum, Alexan-dre Routier, et al.. Amyloidosis and neurodegeneration result in distinct structural con-nectivity patterns in mild cognitive impairment. Neurobiology of Aging, Elsevier, 2017, �10.1016/j.neurobiolaging.2017.03.023�. �hal-01518785�
Amyloidosis and neurodegeneration result in distinct structural
connectivity patterns in mild cognitive impairment
Thomas Jacquemont, MSca,b,c,d,e,f,*; Fabrizio De Vico Fallani, PhDa,b,c,d,e; Anne Bertrand, MD, PhDa,b,c,d,e,g; Stéphane Epelbaum MD, PhDa,b,c,d,h; Alexandre Routier, MSca,b,c,d,e; Bruno Dubois, MDa,b,c,d,h; Harald Hampel, MD, PhDa,b,c,d,h,i, Stanley Durrleman, PhDa,b,c,d,e; Olivier Colliot, PhDa,b,c,d,e,g,h,*; and the Alzheimer’s Disease Neuroimaging Initiative
a
Inserm, U1127, F-75013, Paris, France
b
CNRS, UMR 7225 ICM, 75013, Paris, France
c
Sorbonne Universités, UPMC Univ Paris 06, UMR S 1127, F-75013, Paris, France
d
Institut du Cerveau et de la Moelle épinière, ICM, F-75013, Paris, France
e
Inria, Aramis project-team, Centre de Recherche de Paris, France
fDépartement de Biologie, Ecole normale supérieure, PSL Research University, F-‐ 75005, Paris,
France
g
AP-HP, Hôpital de la Pitié-Salpêtrière, Department of Neuroradiology, F-75013, Paris, France
h
AP-HP, Hôpital de la Pitié-Salpêtrière, Department of Neurology, Institut de la Mémoire et de la Maladie d’Alzheimer (IM2A), F-75013, Paris, France
i
AXA Research Fund & UPMC Chair, Paris, France
*Corresponding authors:
Thomas Jacquemont, MSc and Olivier Colliot, PhD ICM – Brain and Spinal Cord Institute
Pitié-Salpêtrière, Hospital
47-83, boulevard de l’Hôpital, 75651 Paris Cedex 13, France Tel./fax: +33157274365
Abstract
Alzheimer’s disease (AD) is increasingly considered as a disconnection syndrome. Previous
studies of the structural connectome in early AD stages have focused on mild cognitive
impaired subjects (MCI), considering them as a homogeneous group. We studied 168 subjects
from the Alzheimer’s Disease Neuroimaging Initiative database (116 MCI and 52 cognitively
normal subjects). Biomarker-based stratification using amyloid biomarkers (AV45 PET) and
neurodegeneration biomarkers (MRI and FDG PET) led to four subgroups based on amyloid
positivity (A+/-) and neurodegeneration positivity (N+/-): A-N-, A+N-, A-N+, and A+N+.
Using diffusion MRI, we showed that both MCI A-N+ and MCI A+N+ subjects displayed an
alteration of the white matter in the fornix and a significant bi-hemispheric network of
decreased connections. These network alterations in MCI A+N+ are stronger and more focal
than those of MCI A-N+. Only MCI A+N+ subjects exhibited specific changes in
hippocampal connectivity and an AD-like alteration pattern. Our results indicate that the
connectome disintegration pattern of MCI subgroups differ with respect to brain amyloid and
neurodegeneration. Each of these two AD biomarkers induces a connectome alteration that is
maximal when they co-exist.
Keywords:
Alzheimer’s Disease, MCI, Biomarkers, Structural Connectome, Network Analysis
1
Abbreviations: A: Amyloid; AD: Alzheimer’s’ Disease; AxD: Axial Diffusivity; FA: Fractional
Anisotropy; MCI: Mild Cognitive Impairment; MD: Mean Diffusivity; N: Neurodegeneration; RD: Radial Diffusivity; SNAP: Suspected non Amyloid Pathology
1. Introduction
Alzheimer’s disease (AD) is the most frequent age-related neurodegenerative disease and an
exponentially growing health care problem (Ferri et al., 2005). As AD progresses,
beta-amyloid and tau proteins accumulate in the brain, leading to inflammation, neuronal
dysfunction, and cell death (Oddo et al., 2006). Neuronal loss results in macroscopic atrophy
of the gray matter in neo and allocortical regions (Dubois et al., 2014; Ma et al., 2016). In
addition to gray matter atrophy, subcortical white matter is also progressively altered which
results in the breakdown of anatomical connections between distant brain areas (Bartzokis,
2011; Braak and Braak, 1997; Braskie et al., 2011). In particular, previous neuroanatomical
and neuropathological studies showed that, among the whole brain connections,
cortico-cortical connections and hippocampal circuits are specifically vulnerable to
neurodegeneration early in the course of AD (Hof et al., 1990; Hof and Morrison, 1991;
Morrison and Hof, 2002). The progress of neuroimaging techniques, in particular diffusion
magnetic resonance imaging (dMRI) and functional MRI, as well as post-processing
(tractography) and network analysis methods, has enabled the in vivo study of the structural
and functional connectivity that form the brain connectome. Connectomics has so far
confirmed the impairment of network connectivity in AD observed by neuroanatomical and
neuropathological studies, supporting the role of white matter degeneration in the disease, and
the fact that part of the symptoms are due to disconnection of distant cortical regions (Daianu
et al., 2013b, 2013a; Fischer et al., 2015; Mallio et al., 2015; Nir et al., 2012, 2015; Prescott et
al., 2014).
In AD, the pathological process begins decades before the onset of clinical dementia.
Therefore, characterization of the preclinical and prodromal stages of AD is important for a
better understanding of the disease and the design of new therapies. Numerous studies have
focused on subjects with mild cognitive impairment (MCI) who present objective cognitive
studies have studied the structural connectome based on diffusion MRI in subjects with MCI
and have demonstrated impaired connectivity, similar to that observed in AD with a lower
degree of severity (Daianu et al., 2013b, 2013a; Mallio et al., 2015; Prescott et al., 2014).
In these studies, MCI has been considered as a homogeneous group representing one
stage between cognitively normal (CN) and AD subjects. However, in the past years, the
advent of different biomarkers has allowed researchers and clinicians to characterize AD at its
earliest stages from a pathophysiological point of view. These indicators include biomarkers of β-amyloidosis (reductions in CSF Aβ42 and increased amyloid PET tracer retention) and biomarkers of neuronal injury and neurodegeneration (increased CSF tau, decrease of
fluorodeoxyglucose uptake on PET, structural MRI measures of hippocampal atrophy) (Jack
et al., 2013, 2010). Biomarkers have improved the characterization of the heterogeneity of the
MCI phenotype by distinguishing patients with and without abnormal biomarkers of
amyloidosis and neurodegeneration (Caroli et al., 2015; Petersen et al., 2013; Vos et al., 2015;
Wisse et al., 2015). In particular, two subgroups of patients are of high interest. The first one
is composed of patients with abnormal biomarkers of both amyloidosis and
neurodegeneration (MCI A+N+, also called high likelihood MCI due to AD or prodromal
AD). This population has been shown to display a high rate of APOE ε4 carriers, a greater
cognitive decline over time and a higher rate of progression and conversion to AD (Caroli et
al., 2015; Edmonds et al., 2015; Knopman et al., 2012; Prestia et al., 2013; Vos et al., 2013).
The second group is that of patients who are amyloid negative but neurodegeneration positive,
a group often referred to as MCI with suspected non-amyloid pathology (MCI SNAP) or MCI
A-N+ (Jack et al., 2012, 2016b). Various studies have analyzed the differences between
SNAP and amyloid positive patients, in terms of clinical and cognitive trajectories, APOE
genotype and underlying pathology (Caroli et al., 2015; Jack, 2014; Jack et al., 2015, 2014,
2010; Knopman et al., 2012; Mormino et al., 2014; Petersen et al., 2013; Prestia et al., 2013;
the moment, it is not known why this group differs from typical prodromal stages of AD with
amyloidosis (MCI A+N+). Thus, because MCI is not a biologically homogeneous group and
especially because MCI SNAPs may not be part of prodromal AD, MCI SNAPs may be a
confounding factor in the results of connectomic studies in MCI.
The present work aims at studying the connectome of subjects with MCI, stratified
according to their biomarker status, using diffusion-weighted magnetic resonance imaging
(DWI), tractography and network analysis and CN A-N- as control group. For this purpose,
we analyzed DWI of 168 subjects from the ADNI database (116 MCI and 52 CN subjects).
We first assessed the integrity of specific white matter tracks combining diffusion tensor
imaging scalar maps (including fractional anisotropy and mean diffusivity) and a white matter
atlas. Then, we reconstructed the whole-brain connectome of each patient using fiber
tractography. Network analysis techniques were then applied to characterize the connectomes
2. Materials and methods
2.1. Participants and image acquisition
Data used in the present study were extracted from the Alzheimer’s Disease Neuroimaging
Initiative (ADNI) database. The ADNI was launched in 2003 by the National Institute on
Aging, the National Institute of Biomedical Imaging and Bioengineering, the US Food and
Drug Administration, private pharmaceutical companies, and nonprofit organizations, as a
$60-million, 5-year public-private partnership. The primary goal of ADNI has been to test
whether serial magnetic resonance imaging, PET, other biological markers, and clinical and
neuropsychological assessment can be combined to measure the progression of MCI and early
AD. Determination of sensitive and specific markers of very early AD progression is intended
to aid researchers and clinicians to develop new treatments and monitor their effectiveness, as
well as lessen the time and cost of clinical trials. The principal investigator of this initiative is
Michael W. Weiner, MD, VA Medical Center and University of California, San Francisco.
ADNI is the result of efforts of many coinvestigators from a broad range of academic
institutions and private corporations, and research participants have been recruited from >50
sites across the United States and Canada. The initial goal of ADNI was to recruit 800 adults
but ADNI has been followed by ADNI-GO and ADNI-2. To date these 3 protocols have
recruited >1800 adults, ages 55-90 years, to participate in the research, consisting of
cognitively normal older individuals, people with early or late MCI, and people with early
AD. The follow-up duration of each group is specified in the protocols for ADNI-1, ADNI-2,
and ADNI-GO. Research participants originally recruited for ADNI-1 and ADNI-GO had the
option to be followed in ADNI-2. For up-to-date information, see www.adni-info.org.
Since the present work requires diffusion-weighted imaging (DWI) data, only data
from ADNI-GO and ADNI-2 were used since no DWI data was recorded in ADNI-1.
Detailed inclusion and exclusion criteria of participants can be found in the ADNI-2 and
CN participants for which a T1-weighted scan (necessary for assessment of
neurodegeneration and for connectome analysis), a DWI scan (necessary for connectome
analysis), a FDG-PET scan (necessary for assessment of neurodegeneration) and an
AV45-PET scan (necessary for assessment of amyloid status) at baseline were available. As a result,
168 participants were selected and entered into our study, 52 of them were CN and 116 of
them were MCI. Moreover, in order to compute adjusted hippocampal volumes, we also
selected all CN participants for whom a T1-weighted scan and for which both hippocampal
volume and intracranial volume (ICV) were available. This resulted in 373 CN participants.
Finally, in order to define biomarker cutoff values (AV45 SUVr, normalized adjusted
hippocampal volume and FDG SUVr), we selected, for each biomarker, AD participants who
underwent the associated scan (respectively AV45-PET scan, T1-weighted scan and
FDG-PET scan). We obtained respectively for each biomarker 144, 275, and 243 AD participants.
MRI data was acquired as part of ADNI’s procedures. All subjects underwent
whole-brain MRI scanning on 3-Tesla GE Medical Systems scanners at 14 acquisition sites across
North America. T1-weighted IR-FSPGR (spoiled gradient echo) anatomical scans were
collected (256×256 matrix; voxel size = 1.2×1.0×1.0 mm3; TI = 400 ms; TR = 6.98 ms; TE = 2.85 ms; flip angle = 11°), as well as diffusion-weighted images (DWI; 35 cm field of view,
128×128 acquired matrix, reconstructed to a 256×256 matrix; voxel size: 2.7×2.7×2.7mm3; scan time = 9 min). 46 separate images were acquired for each DWI scan: 5 T2-weighted
images with no dedicated diffusion sensitization (b0 images) and 41 diffusion-weighted
images (b=1000 s/mm2). This ADNI protocol was chosen after conducting a detailed comparison of several different DWI protocols, to optimize the signal-to-noise ratio in a fixed
scan time (Jahanshad et al., 2010; Zhan et al., 2013). We visually checked all T1-weighted
MR and DW images to exclude scans with excessive motion and/or artifacts; all scans were
2.2. Assessment of amyloid and neurodegeneration biomarkers
Assessment of amyloid and neurodegeneration biomarkers was made using readily available,
processed data on the ADNI web site. Florbetapir F 18 (AV45) PET measures were obtained
using standard methods, described in Landau et al., 2012. A composite standardized uptake
value ratio (SUVr) for the florbetapir images was calculated by taking the mean SUVr of a set
of regions typically associated with increased uptake in AD (frontal, anterior cingulate,
precuneus, and parietal cortex), using gray matter of the cerebellum as reference region.
Neurodegeneration was assessed by both FDG-PET and MRI. FDG-PET measures
were obtained using standard methods, also described in Landau et al., 2012. For FDG-PET
analysis, SUVr was considered in a “meta region-of-interest” associated with
hypometabolism in AD and was calculated as the mean of 5 regions (post cingulate gyrus, left
and right angular gyrus and left and right temporal gyrus) using pons and vermis combined as
a reference. Hippocampal volume and intracranial volume (ICV) were computed using the
FreeSurfer suite. For each subject, we adjusted the raw hippocampal volume by his total ICV.
In order to obtain a relative hippocampal volume change, we normalized the adjusted
hippocampal volume by the expected volume of the hippocampus looking at the ICV.
Normalized adjusted hippocampal volumes were obtained from the raw hippocampal volume
using the following equation:
(1)
with aHVnorm the normalized adjusted hippocampal volume, HV the hippocampal volume, ICV the intracranial volume, a and b respectively the slope and intercept of the affine function
representing the hippocampus volume in terms of the intracranial volume. We fitted a and b
2.3. Participants classification
In order to classify the participants based on amyloid and neurodegeneration markers, we
chose the cut points for each imaging biomarker that corresponded to 90% sensitivity in
clinically diagnosed patients with AD dementia from the ADNI database (Jack et al., 2015,
2012, Knopman et al., 2013, 2012; Petersen et al., 2013; Wirth et al., 2013). For abnormal
amyloid, we obtained a cut point for the AV45 PET composite normalized SUVr of 1.1 based
on 144 clinically diagnosed patients with AD dementia. This threshold is consistent with
already used threshold for this biomarker (Landau et al., 2012). Subjects with a higher or
equal SUVr value were classified as amyloid positive (group A+), the other subjects as
amyloid negative (group A-). For markers of neurodegeneration, subjects were classified as
positive if they had a below threshold normalized adjusted hippocampal volume or abnormal
FDG PET hypometabolism. The 90% sensitivity cut point for the normalized hippocampal
volume adjusted for total intracranial volume (aHVnorm) was −0.06 using volume data from 275 clinically diagnosed patients with AD dementia. This is interpreted as a hippocampal
volume 6% below the expected hippocampal volume accounting for intracranial volume. For
FDG PET SUVr, the cutpoint value obtained was 1.27 using data from 243 clinically
diagnosed patients with AD dementia. Subjects who displayed aHVnorm lower than or equal to -0.06 and/or a FDG PET hypometabolism SUVr lower than or equal to 1.27 were defined as
neurodegeneration positive (group N+), the other subjects were defined as neurodegeneration
negative (group N-). Depending on those biomarkers, MCI patients were divided into 4
groups: A-N-, A+N-, A-N+, and A+N+ (see descriptive statistics of demographical data,
Table 1). As a reference group for assessment of patients’ connectome abnormalities, we
defined a CN A-N- group composed of clinically normal participants with no abnormal
Table 1. Demographics of the studied participants. Means and standard deviations are
displayed for continuous variables. Number is displayed for all categorical variables, with
percentages within parentheses. Differences between groups were assessed using two-tails
Mann Whitney U test for continuous data and χ2 test for categorical variables. Significance level was set at p<0.05.
Key: MCI, mild cognitive impairment.
a: significant difference between MCI A-N- and MCI A-N+.
b: significant difference between MCI A-N- and MCI A+N+.
c: significant difference between MCI A-N- and CN A-N-.
d: significant difference between MCI A+N- and MCI N A-N+.
e: significant difference between MCI A+N- and MCI N A+N+.
f: significant difference between MCI A+N+ and CN A-N-.
g: significant difference between MCI A-N- and MCI A+N-.
h: significant difference between MCI A+N- and CN A-N-.
i: significant difference between MCI A-N+ and MCI A+N+.
2.4. T1-weighted image processing and brain parcellation
We processed T1-weighted images with the FreeSurfer suite (v5.3; Fischl et al., 2004), which
provided non-uniformity and intensity correction, skull stripping, grey/white matter
segmentation, reconstruction of the cortical surface and segmentation of cortical structures.
The cortical ribbon was parcellated into 74 distinct regions per hemisphere based on the
Destrieux atlas (Fischl et al., 2004). In total, with subcortical structures, 164 regions of
interest (ROI) were studied. We visually assessed FreeSurfer segmentations. No images were
2.5. Diffusion weighted imaging (DWI) processing
For each subject, we aligned all raw DWI volumes to the average b0 image (DWI volume
with no diffusion sensitization) using the FSL flirt tool with first 6 degrees of freedom (dof)
allowing translations and rotations in 3D to correct for head motion and then 12 dof to correct
for eddy current distortions. For each registration step, a normalized mutual information cost
function was used. As recommended by Leemans and Jones, 2009, the diffusion weighting
directions were appropriately updated. To correct for echo-planar imaging (EPI) induced
susceptibility artifacts, which can cause distortions at tissue-fluid interfaces, the skull-stripped
b0 (non-diffusion-weighted) images were registered to the T1-weighted scans, first linearly
using respectively FSL flirt tool with 6 dof and then non-linearly using ANTs SyN algorithm
(Avants et al., 2008). SyN is an inverse-consistent registration algorithm used with a mutual
information cost function allowing EPI induced susceptibility artifacts correction (Leow et al.,
2007). Then, we applied to the 41 DWI volumes the resulting linear transformation matrices
and 3D deformation fields so that the DWIs and respective T1 images were in the same space.
Finally, we corrected the DWIs for non-uniform intensity using the improved nonparametric
nonuniform intensity normalization, ANTs N4 bias correction algorithm (Tustison and
Avants, 2013). A single multiplicative bias field was estimated from the averaged b0 image,
as suggested in Jeurissen et al., 2014, then the estimated bias field was applied to correct the
intensity of all DW volumes. The implementation of the preprocessing was based on the
Nipype toolbox. We visually assessed processed images for patient motion and distortion
artifacts correction. No images were excluded from analysis because of excessive patient
motion or distortion artifacts.
2.6. Fiber tractography
We performed whole-brain fiber tracking with the MRtrix software package (Brain Research
Institute, Melbourne, Australia, Tournier et al., 2012). First, we fitted the diffusion tensors at
(AxD) and Radial Diffusivity (RD) maps. Then, we computed the fiber orientation
distribution (FOD) at highly anisotropic voxels (FA>0.7) to determine the response function,
which we used for constrained spherical deconvolution to accurately estimate the FOD
(Tournier et al., 2007). We then generated fibers with a probabilistic tracking algorithm that
samples FOD at each step. The algorithm generated 150,000 fibers of minimum length 20
mm. Default tracking parameters included a step size of 0.2 mm, minimum radius of
curvature of 1 mm and FOD cutoff of 0.1. All voxels in the 1-mm dilated white matter mask
were used as seeds and the tracking procedure was stopped if a fiber reached a voxel outside
the mask or if a stopping criterion was met (high fiber curvature or low FOD). Finally, in
order to reduce the biases in quantitative measures of connectivity introduced by the
streamlines reconstruction method and to improve biological accuracy of our structural
connectome we applied the spherical-deconvolution informed filtering of tractograms (SIFT)
approach (Smith et al., 2013). We visually assessed streamlines for each patient for correct
tractography, two patients from the MCI A+N- category were excluded because of incorrect
B0 brain segmentation.
2.7. Computation of structural networks
Topological changes in the brain’s networks may be analyzed using graph theory. In such
analyses, the brain network is represented as a graph i.e. a set of units (called “nodes”) and a
set of lines linking the nodes together (called “links”). The network’s nodes are typically
defined as cortical and subcortical gray matter regions, while the edges correspond to the
white matter connections between those regions. In our study, the graph is composed of 164
nodes that correspond to the cortical and subcortical regions. For any pair of nodes i and j,
representing distinct anatomical regions i and j, an edge was added to G if at least one fiber
tract connected these two anatomical regions (Hagmann et al., 2008). In DWI studies, a given
edge is weighted by a measure of the “strength” of the connectivity between the two
regions, defined as the number of fibers connecting the two regions normalized by the surface
of the regions (Hagmann et al., 2008):
(2)
where i and j are the indices of two different regions (i and j ranging from 1 to 164),
|Fi,j| is the number of fibers connecting region i to region j and Si (respectively Sj) is the surface of region i (respectively region j). For subcortical structures, S corresponds to the
volume of the region. We refer to the weight associated with the edge as the connectivity
strength.
2.8. Structural connectome analysis
In order to analyze subjects’ structural connectomes, we performed 3 different types of
analyses.
Integrity of anatomical white matter tracks. We assessed the integrity of a set of anatomical white matter tracks defined in the DTI-81 white-matter atlas (Hua et al., 2008; Wakana et al.,
2007). The DTI-81 Atlas is a stereotaxic probabilistic white matter atlas that fuses DTI-based
white matter information with an anatomical template (ICBM-152). The warping of this atlas
to each individual patient provides a parcellation of the white matter of the patient into
anatomical tracks. The integrity of the tracks was assessed by analyzing the average FA, MD,
AxD and RD in each track. To that purpose, each scalar map of each patient was put into
correspondence with the DTI-81 Atlas space by coregistering it to the FA map template with
ANTs SyN algorithm (Avants et al., 2008). Then for each subject, the mean scalar value in
each tract was computed.
Network-based statistics. We assessed global differences in interconnected network components between groups with network-based statistics (NBS, Zalesky et al., 2010). This
analysis looks at the topological organization of the statistically more impaired connections
gathers them in a module in order to study the significance of these alterations at the scale of
the module. Thus, the highlighted impairment should not be interpreted at the scale of
individual connections, but at the scale of the whole module itself. Specifically, the procedure
assesses if the size of the module is significantly larger than the ones observed randomly. The
size of a module can be defined as the number of connections in this module (referred to as “extent”). The extent only takes into account the width of the module without looking at the
strength of the alterations within the module. In addition to the extent of the module, we also
examined the strength of alterations in each module by computing the sum of the opposed
logarithm of the t-test of each connection in this cluster (referred to as “log”). The log size, as
the extent size, takes into account the width of the module (because logarithms are summed
over each connection of the module) but also the strength of the alteration (because each
connection in the module is weighted by the opposed logarithm of the associated t-test).
Graph analysis. Properties of brain networks can then be examined by analysis of the topology of the corresponding graph (Hagmann et al., 2008; Rubinov and Sporns, 2010). The
graph structure (i.e. the organization of its links) can be analyzed by computing several
indices (or metrics) corresponding to different topological properties. We used the Brain
Connectivity Toolbox to calculate the indices (Rubinov and Sporns, 2010). The indices we
computed can be roughly grouped into: i) local metrics that characterize the nodes of graph;
ii) global metrics that characterize the graph as a whole (De Vico Fallani et al., 2014). The
local metrics were: node degree (number of links connected to a node), strength (sum of the
weight of all links connected to a node), local efficiency (average inverse shortest path length
in a node neighborhood) and clustering coefficient (the fraction of a node’s neighbors that are
neighbors of each other). The global metrics were: mean degree (mean node degree over the
network), mean strength (mean node strength over the network), global efficiency (inverse of
the harmonic mean of the shortest path length between each pair of nodes within the
path length (mean across the network of the minimum number of links necessary to travel
from one node to another in the network) and small-worldness reflecting the tendency of the
network to exhibit both shortcuts (integration) and clustering connections (segregation).
2.9. Statistical analysis
We used a general linear model (GLM) to regress out the age, the sex and the number of years
of education effect from our variables of interest. Specifically, our variables of interest were
the mean FA, MD, AxD and RD for each tract in the tract integrity analysis, each edge weight
of the graphs in network based statistics and the different computed graph indices in our
topological analysis.
Integrity of anatomical white matter tracks. For each DTI scalar in each tract of the atlas, significant mean scalar changes between groups were assessed using a two tails Mann
Whitney U test. Correction for multiple comparisons was performed using the false discovery
rate (FDR) procedure.
Network-based statistics. We performed NBS following the sequence: 1) mean connectivity strength changes were calculated with one tail Student’s T test at each
connection; 2) network edges that survived a p-value lower than 0.01 uncorrected were
retained; 3) the size of the largest cluster was calculated. The statistical significance of the
initial largest cluster size was estimated with a permutation test procedure: groups were
randomly shuffled, and then the largest cluster size null-distribution was obtained by
repeating steps 1, 2 and 3. The null-distribution was created using 50,000 permutations. Note
that while the choice of the NBS threshold for the p-value is arbitrary, it can affect only
sensitivity and not specificity (Zalesky et al., 2012).
Graph analysis. Node clustering coefficient, node efficiency, network characteristic path length, network clustering coefficient and network efficiency metrics were normalized
by dividing the metric by the mean metric value of 100 matched random networks (mean
calculated using a two tails Mann Whitney U test. Correction for multiple comparisons was
3. Results
3.1. Integrity of anatomical white matter tracks
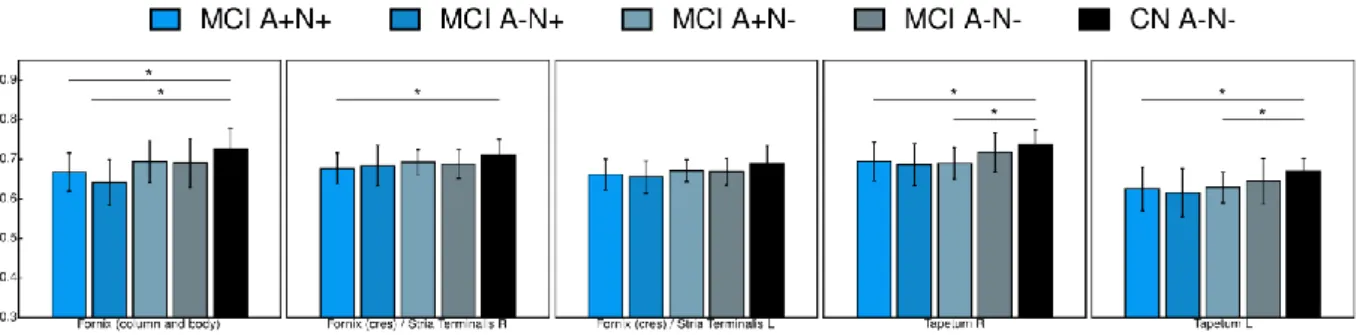
We found a significant decrease of FA in the column and the body of fornix of MCI A+N+
and MCI A-N+ compared to CN A-N- (Figure 1). MCI A+N+ group also displayed a
significant decrease of FA in the right fornix cres (posterior pillars, Figure 1). MCI A+N- and
MCI A+N+ displayed a significant decrease of FA in the tapetum bilaterally compared to CN
A-N- (Figure 1). No significant differences were found between MCI A+N+, MCI A-N+ and
MCI A+N-. Moreover, no differences were found in any of the other tracts. Results for all
tracts are shown in the supplementary Figure S1. Consistent with the FA analysis, compared
to CN A-N-, MCI A+N+ group displayed a significant increase of MD in the column and the
body of the fornix, the right fornix cres and the tapetum bilaterally. Moreover, MCI A+N+
also displayed a significant increase of MD compared to CN A-N- in the body and the
splenium of the corpus callosum, the right superior fronto-occipital fasciculus, the
hippocampal part of the cingulum bilaterally and the superior corona radiata bilaterally
(Figure 2). Similarly, consistent with the FA analysis, MCI A-N+ group displayed a
significant increase of MD compared to CN A-N- in the column and the body of the fornix.
Still compared to CN A-N-, MCI A+N+ also displayed a significant increase of MD in the
right fornix cres, the body of the corpus callosum, the left superior corona radiata, the superior
fronto-occipital fasciculus bilaterally, the hippocampal part of the cingulum bilaterally and the
right tapetum (Figure 2). Finally, the MCI A+N- group displayed a significant increase of
MD compared to CN A-N- in the left superior corona radiata and the posterior corona radiata
bilaterally (Figure 2). No differences were found in any of the other tracts (results for MD for
all tracts are shown in supplementary Figure S2). Results for both AxD and RD for all tracts
are shown in the supplementary Figure S3 and S4 respectively and were consistent with the
Figure 1. Mean FA in anatomical white matter tracks. Mean FA values for the fornix and
the tapetum for which significant differences were found. The bar graph shows mean values
(and standard deviation) for each group. * p<0.05 for Mann Whitney U test. L, Left; R, Right.
Figure 2. Mean MD in anatomical white matter tracks. Mean MD values for the corpus
callosum, the fornix, the superior and posterior corona radiata, the hippocampus part of the
cingulum, the superior fronto-occipital fasciculus and the tapetum for which significant
differences were found. The bar graph shows mean values (and standard deviation) for each
group. * p<0.05 for Mann Whitney U test.
3.2. Network-based statistics
Using network-based statistics (Zalesky et al., 2010), we found a significantly impaired
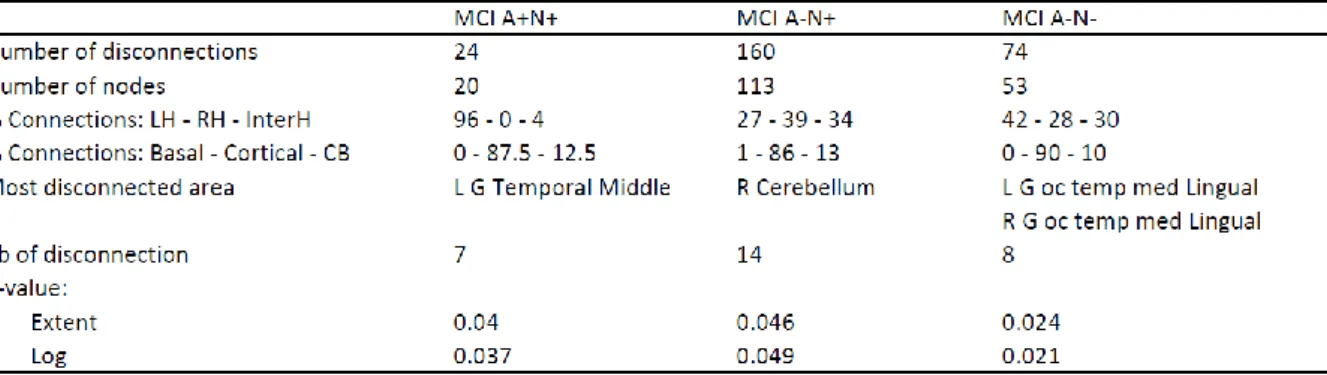
module for MCI A+N+, MCI A-N+ and MCI A-N- compared to CN A-N- (Table 2).
Network-based statistics also unveiled significantly impaired modules between MCI
subgroups (Figure 3). We found an impaired module of 63 disconnections between 56 nodes
in MCI A+N+ compared to MCI A-N- (p=0.008, Figure 3.A). The most impaired region was
the left caudate nucleus with 11 disconnections followed by the right caudate nucleus with 8
disconnections. This module is a bi-hemispheric network with 36 disconnections in the left
hemisphere (57%), 19 disconnections in the right hemisphere (30%) and 8 interhemispheric
disconnections (13%). We also found an impaired module in MCI A-N+ of 216
disconnections between 131 nodes compared to MCI A-N- (p=0.008, Figure 3.B). This
module is also a bi-hemispheric network with 61 disconnections in the left hemisphere (28%),
102 disconnections in the right hemisphere (47%) and 53 interhemispheric disconnections
(26%). The most impaired region was the right cerebellum with 20 disconnections. No
significant module was found comparing MCI N+ to MCI A+N+ (MCI A+N+ > MCI
A-N+, p>0.05). We then looked at the strength of these modules by using the log size (sum of
the opposed logarithm of the t-test of each connection in the module). Interestingly, when
taking into account the strength of the alterations using the log size, the impaired module in
MCI A-N+ compared to MCI A-N- failed to reach the significance (p>0.05) while the
impaired module in MCI A+N+ compared to MCI A-N- stayed significant (p=0.009). By
comparing MCI A+N- to other MCI subgroups and CN A-N-, no significantly altered module
Table 2. Characteristics of impaired modules in MCI A+N+, MCI A-N+ and MCI A-N- compared to CN A-N-. We indicate the number of nodes in the module in order to assess the
extent of the module compared to that of the whole network (formed by 164 nodes). We also
indicate the lateralization of the module (percentage of disconnections in the left hemisphere
only (LH), the right hemisphere only (RH) and interhemispheric connections (interH)) and the
percentage of baso-basal disconnections (Basal), cortico-cortical disconnections (Cortical),
and cortico-basal disconnections (CB). Finally, we indicate the most disconnected area for
each comparison along with the associated number of disconnections. P-values were
computed using network-based statistics.
Key: CB, cortico-basal; G; gyrus; H, hemisphere; L, left; MCI, mild cognitive impairment; R,
Figure 3. Network-based analysis of MCI A+N+ and MCI A-N+ compared to MCI A-N-.
Significant modules of impaired connection were found both in MCI A+N+ and MCI A-N+
compared to MCI A-N-. A larger module was found in MCI A-N+ and a smaller one in MCI
A+N+. A) Module impaired in MCI A+N+ compared to MCI A-N-. This cluster is formed by
63 disconnections and 56 nodes, p=0.008. B) Module impaired in MCI A-N+ compared to
MCI A-N-. This cluster is formed by 216 disconnections and 131 nodes, p=0.04.
Abbreviation: MCI, mild cognitive impairment.
3.3. Structural connectome topology analysis
Consistent with previous studies on topological properties of the brain connectome, our networks displayed a small world topology (small-worldness values CN_A-N-=1.74, MCI_A-N-=1.78, MCI_A-N+=1.82, MCI_A+N+=1.76 >1; Sporns et al., 2000). We did not find significant change of any of the global network metrics in MCI A+N+, MCI A-N+, MCI A+N- and MCI
node metrics, we found a significant increase of node normalized clustering coefficient in
MCI A+N+ compared to MCI A-N- in four structures (Figure 4): left hippocampus, right
hippocampus, right amygdala and right nucleus accumbens. Mean values and standard
deviations are summarized in the supplementary Table S3. This difference in the left
hippocampus was also associated with an increase of normalized local efficiency
(supplementary Figure S6). No significant changes were observed for MCI A-N+ and MCI
A+N- compared to MCI A-N-.
Figure 4. Nodes normalized clustering coefficient. Significant differences were found in
patients with MCI A+N+ compared to MCI A-N- in four structures: left hippocampus, right
hippocampus, right amygdala, right nucleus accumbens. Bar height represents the mean
metric value, and error bar represents one standard deviation from the mean. * p<0.05 for
Mann Whitney U test.
Abbreviations: L, left; MCI, mild cognitive impairment; R, right.
4. Discussion
In this study, we used DTI scalars, tractography and graph theory to study the structural
connectome in subgroups of MCI subjects stratified by amyloid and neurodegeneration
biomarkers. We demonstrated differences and similarities in network alterations depending on
biomarker profile. In particular, MCI A+N+ and MCI A-N+ displayed alterations of the
fornix and of the hippocampal part of the cingulum. Moreover, MCI A+N+ exhibited stronger
and more focal connectivity alterations with a hippocampal clustering coefficient increase,
while MCI A-N+ were associated with less severe but more diffuse network abnormalities.
4.1 Biomarker-based stratification of MCI patients
By performing a biomarker-based stratification of MCI patients in the ADNI-GO and ADNI-2
cohorts, we found that 25.4% of MCI patients were negative for both amyloid and
neurodegeneration biomarkers, 16.7% were positive for only the amyloid biomarker, 44.7%
were positive for both and 13.2% were positive for only the neurodegeneration biomarkers.
This distribution is consistent with previous studies (Caroli et al., 2015; Petersen et al., 2013;
Prestia et al., 2013; Wisse et al., 2015). In order to further understand the nature of the
neurodegeneration, we investigated the distribution of biomarkers subgroups based on
whether neurodegeneration was achieved by hippocampal volume (HV) alone, FDG-PET
alone, or both modalities (supplementary Table S4). Of all MCI A+N+, 21.5% were positive
for HV alone, 31.5% were positive for FDG PET alone and 47% were positive for both
biomarkers. Of all MCI A-N+, 46.7% were positive for HV alone, 33.3% were positive for
4.2. MCI patients positive for both biomarkers of amyloid and neurodegeneration
MCI A+N+ subgroup, which fits with the current model of prodromal AD, displayed the most
impaired connectome (Jack et al., 2013, 2010). Using FA, MD, AxD and RD to analyze the
integrity of anatomical white matter tracks, we showed for each DTI scalar that MCI A+N+
displayed an early alteration of the white matter in the fornix (columns and body and right
crus of the fornix; these structures are shown in the supplementary Figure S7). The fornix
belongs to the Papez circuit, is known to play an important role in memory and has been
shown to be impaired in AD (Caso et al., 2015; Delano-Wood et al., 2012; Laxton et al.,
2010; Mayo et al., 2017; Molinuevo et al., 2014; Nowrangi and Rosenberg, 2015; Wisse et
al., 2015). Thus, in agreement with previous studies, we showed that the breakdown of the
fornix and the hippocampal part of the cingulum happens at an early phase of AD, at the MCI
A+N+ stage (Metzler-Baddeley et al., 2012). This alteration of the Papez circuit is consistent
with the observed increase of MD, AxD and RD in the hippocampal part of the cingulum
(bilaterally for MD and only on the left for AxD and RD). Moreover, this breakdown of the
Papez circuit was linked to a specific increase of nodal clustering coefficient affecting the left
and right hippocampi in MCI A+N+ compared to MCI A-N-. To our knowledge, these are the
first results showing that the connectomes of MCI subgroups are not equivalent, and that
biomarker positive groups display specific connectome changes as compared to MCI subjects
with normal biomarkers. This is consistent with reported hippocampus connectivity data,
specifically the fact that the main efferent fibers of the hippocampus are collected in the
fornix and connect the hippocampus to subcortical brain regions (Daitz and Powell, 1954;
Knowles and Schwartzkroin, 1981; Tamamaki et al., 1988). It should be noted that previous
studies have shown a global increase in clustering coefficient in AD dementia patients, as
compared to CN individuals (Daianu et al., 2013b; He et al., 2008; Yao et al., 2010). Here, we
stage. This early and specific alteration of hippocampus local topology is consistent with
previous neuroanatomical and neuropathological studies showing that hippocampus circuits
are particularly vulnerable to the AD neurodegeneration process (Morrison and Hof, 2002,
1997). The clustering coefficient represents the fraction of a node’s neighbors that are
connected together. Thereby, the increase of the clustering coefficient of a node reflects the
increment of interconnectivity among the nodes’ neighborhood. This can occur either because
of an increase in connectivity within the neighborhood, or because of a decrease in
connectivity with remote nodes that are weakly connected to the neighborhood (Bollobás,
1998). Thus, the observed rise of the clustering coefficient of the hippocampi for the MCI
A+N+ group can be interpreted as the result of long-range disconnections which tend to
isolate the hippocampi and their high-connected neighborhoods. This is consistent with the
non-alteration of left and right hippocampi nodal strength and degree we observed in our
study. Indeed, it demonstrates that this is more the specific alteration of long range
connections than the number of disconnections itself which results in an alteration of both
hippocampi clustering coefficient. Both the observed fornix alterations and increase in
hippocampal clustering coefficient may be interpreted as a network analysis signature of the
typical neurofibrillary degeneration progression during AD, which extend in a stereotypical
sequence from the hippocampal region towards remotely connected areas (Braak and Braak,
1997).
Consistent with previous studies, MD, AxD and RD appeared to be more sensitive
than FA for the detection of white matter microstructural changes (Acosta-Cabronero et al.,
2010; Metzler-Baddeley et al., 2012). By looking at MD and AxD DTI scalars, we
highlighted changes in white matter integrity in superior and posterior corona radiata in MCI
A+N+. Moreover, looking at MD, AxD and RD, we also highlighted an alteration of the
superior fronto-occipital fasciculus bilaterally. While they are not well explained by the
fasciculus have already been reported in previous studies (Gold et al., 2014; Mayo et al.,
2017; Meng et al., 2012; Molinuevo et al., 2014). Because these alterations were also
displayed by MCI A-N+ and MCI A+N- subgroups (but not by MCI A-N-), we hypothesized
that these mild white matter alterations without associated FA decrease were more linked to a
small non-specific neurodegeneration process, rather than a specific AD-linked
neurodegeneration process.
Using network-based statistics, we found significantly impaired clusters in MCI A+N+
compared to MCI A-N- and CN A-N-. In MCI A+N+ compared to CN A-N- the most
disconnected area within the cluster was the left middle temporal gyrus with 7 disconnections
over the 24 disconnections of the module. These disconnections are very interesting because
previous study has shown that middle temporal grey matter atrophy predicts decline to AD in
MCI patients (Korolev et al., 2016). Here, we show that, during the progression of the
disease, middle temporal connectivity is also early and specifically affected in MCI A+N+. In
MCI A+N+ compared to MCI A-N-, the most disconnected area within the cluster was the left
caudate nucleus. Because the caudate nucleus is a subcortical structure and so does not form
large white matter tracks, we hypothesized that this connectivity alteration could reflect a
local disconnected state, and not the alteration of specific tracks link to the progression of the
AD in these patients. The same mechanism could explain the observed increase of the
normalized clustering coefficient in the right accumbens area.
We also observed an increase of the clustering coefficient for the right amygdala in
MCI A+N+. This alteration of amygdala is consistent with previous studies showing that the
amygdala is also affected at the very early stage of AD (Eustache et al., 2016; Poulin et al.,
2011). Here, we showed that the MCI A+N+ group already displays an alteration of local
amygdala connection topology.
At the global scale, MCI A+N+ did not significantly differ from CN A-N-. These
topological alterations, the topology of subjects with MCI is closer to that of CN individuals
(Daianu et al., 2013b). This nodal clustering coefficient alteration without significant global
changes is consistent with the idea that, at the prodromal phase, AD-related lesions slowly
progress from the hippocampus to the whole cortex (Braak and Braak, 1997).
In addition, using each DTI scalar (FA, MD, AxD and RD) the MCI A+N+ subgroup
displayed an early and very specific bilateral alteration of the tapetum (these structures are
shown in the supplementary Figure S8.A). Interestingly, the tapetum is formed by the
splenium fibers of the corpus callosum where we found a significant alteration of MD and RD
(in both splenium and body of the corpus callosum). Moreover, the tapetum is also a small
area of tracks crossing as shown in the supplementary Figure S8.B. Near to the tapetum cross
the posterior thalamic radiations and the superior longitudinal fasciculus which are 2 altered
tracks in AD (Madhavan et al., 2015; Zhu et al., 2015). Thus, because tapetum is not
specifically altered in amyloid negative MCI subgroups and because Aβ oligomers are known
to impair long-range connections we hypothesized that these alterations could be due to Aβ
progression in these patients and that the tapetum integrity could be seen as a marker of AD Aβ injury within the brain (Warren et al., 2013).
Finally, with the alteration of the Papez circuit and tapetum neighboring tracks’ white
matter, the increase of hippocampal and amygdala clustering coefficient and the
disconnection of the middle temporal gyrus, MCI A+N+ was the only MCI subgroup to
display a typical AD-like disconnection pattern. Our results suggest that connectome studies
in MCI would strongly benefit from a stratification of patients according to amyloid and
neurodegeneration biomarkers.
4.3. MCI patients positive for amyloid only
Previous study showed that MCI A+N- subgroup displays cognitive impairments
indices and node scale indices we did not highlight significant cluster impairment or
connectome topological changes in MCI A+N- compared to CN A-N- or others MCI
subgroups. In particular, MCI A+N- did not display alteration of the fornix, showing that even
though fornix alterations have been described at the MCI stage, they are not present in all
MCI patients (Madhavan et al., 2015; Metzler-Baddeley et al., 2012). Longitudinal studies of
MCI A+N- connectome are needed to follow the progression of MCI A+N- connectome
alterations and see whether subjects with MCI A+N- will develop an alteration of the fornix
and the hippocampus connectivity (as MCI A+N+) or will have a different alteration pattern.
But interestingly, as for MCI A+N+, MCI A+N- displayed a significant alteration in the
tapetum FA bilaterally. Opposed to MD, RD and AD, FA is directly related to white matter
integrity and sensitive to microstructural alterations (Alexander et al., 2011). This result
confirms the specificity of tapetum white matter integrity alteration in amyloid positive MCI
subgroups. MCI A+N- is a conflicting and a not well characterized category. Previous studies
have shown that MCI A+N- group seems intermediate between MCI A+N+ and MCI A-N- in
term of conversion rate and cognitive deterioration, but discrepancies appear between studies
(Caroli et al., 2015; Petersen et al., 2013; Vos et al., 2015; Wisse et al., 2015). Our study is
consistent with this prior knowledge, showing that MCI A+N- white matter is less altered
than MCI A+N+ but more altered than MCI A-N.
4.4. MCI patients positive for neurodegeneration only (MCI SNAP)
Looking at FA, MD, AxD and RD, MCI A-N+, as MCI A+N+, displayed a fornix
alteration (column and body of the fornix only for FA and both column and body of the fornix
and right fornix cres for MD, AxD and RD; shown in the supplementary Figure S7).
Moreover, as MCI A+N+, MCI A-N+ displayed an increase of MD in the hippocampal part of
the cingulum. These fornix and cingulum alterations appeared to be specific to
we defined the neurodegeneration in our study. Because the neurodegeneration positivity is
partly defined by the hippocampus degeneration, it is not surprising to observe both fornix
and cingulum degeneration in the neurodegeneration positive MCI population. Indeed, among
MCI A-N+ patients, 66.7% of them were positive for aHVnorm (supplementary Table S4). Nevertheless, opposed to MCI A+N+, these fornix and cingulum alterations were not strong
enough to alter hippocampal connectivity topology. This result is consistent with the wide
cluster of disconnections we observed using NBS (e.g. 216 disconnections gathering 131
nodes when comparing MCI A-N+ to MCI A-N-). Using the extent size this wide module was
significantly impaired (p=0.04), suggesting extended white matter alterations, while, when
taking into account the strength of the alterations using the log size, this wide module failed to
reach significance (p>0.05), showing that this module is formed by barely impaired
connections, insufficient to impair hippocampal connectivity topology. These weak
alterations on MCI A-N+ network could explain the observed increase of MD in the body of
the corpus callosum and the right tapetum without any significant FA changes, suggesting
minor white matter integrity alterations. These wide but weak changes in connectivity suggest
diffuse and diverse underlying neurodegeneration processes, rather than specific white matter
microstructural changes. Knopman et al. highlighted that MCI A-N+ lacked of specific
longitudinal volumetric and metabolic decline profile, which is consistent with our results
suggesting more diffuse and nonspecific network abnormalities resulting in a lack of
connectome topological alteration profile in MCI A-N+ (Knopman et al., 2015). Interestingly
using NBS and comparing MCI A-N+ to both MCI A-N- and CN A-N-, the most impaired
area was the right cerebellum with respectively 20 and 14 disconnections. The presence,
among MCI A-N+ of subjects with altered cerebellum connectivity could be explained by
cerebrovascular disease able to affect cerebellum connections, but this is probably not the
represents only 9% of the whole disconnections of the clusters. Thus the cerebellum does not
seem to be a characteristic impaired area in MCI A-N+.
Finally, this more diffuse but weaker pattern of degeneration is likely to reflect the
heterogeneity of MCI A-N+ etiology. The presence of different pathological processes (such
as isolated tauopathy, early lewy body disease, hippocampal sclerosis, vascular changes), with
different topologies over the brain within the same group, may explain the observed wider but
weaker degeneration pattern of MCI A-N+ (Jack et al., 2016b). In accordance with this
hypothesis of heterogeneity of MCI A-N+ etiologies, we found that among all MCI A-N+,
only 20% were positive by both biomarkers, whereas they were 47% in the MCI A+N+
(supplementary Table S4). However, it has been also proposed that MCI A-N+ may reflect a
proportion of AD individuals with subthreshold Aß SUVr (Vos et al., 2016, 2015). We
investigated if MCI A-N+ subgroup displayed significant higher AV45 SUVr compared to
others amyloid negative subgroups (MCI A-N- and CN A-N-; supplementary Figure S9). We
did not find a specific increase of AV45 SUVr in MCI A-N+ compared to MCI A-N- or CN
A-N-. This is consistent with previous study showing no significant increase of florbetapir
SUVr in MCI A-N+ classified using CSF Aβ42 as amyloid biomarker (Wisse et al., 2015). Our results support the hypothesis that the degeneration processes at play in MCI A-N+ and MCI
A+N+ are of different nature, which is one of the hypotheses proposed to explain the origin of
MCI A-N+ (Jack et al., 2013; Jack, 2014; Jack et al., 2016b; Knopman et al., 2015; Wisse et
al., 2015).
4.5. MCI patients negative for both biomarkers of amyloid and
neurodegeneration
MCI A-N- (also called low AD likelihood group) is an interesting group of patients
with MCI but without any proof amyloid pathology or neurodegeneration (Albert et al.,
connectomes topology changes compared to CN A-N-. However, using NBS, we observed a
significantly impaired cluster comparing to CN A-N-, and the most impaired areas were the
medial occipito-temporal gyrus and lingual gyrus bilaterally, with 6 disconnections.
Interestingly, this area is implied in memorizing (particularly visual inputs), working memory
and is working jointly with hippocampus during problem-solving tasks at least in children
(Cho et al., 2012; Kozlovskiy et al., 2014). The specific and bilateral disconnection of this
area could explain the observed cognitive impairment without amyloid or neurodegeneration
processes. In the MCI A+N+ subgroup, we observed a significant increase in normalized
clustering coefficient when compared to MCI A-N-, but this increase was not significant
when compared to CN A-N-. To explain this unexpected result, we hypothesized that two
mechanisms coexist: an increase of clustering coefficient in MCI A+N+, due to specific
AD-linked long-range disconnections; and a decrease of clustering coefficient in MCI A-N-, due
to nonspecific short-range disconnections. This hypothesis is coherent with the observed
changes in the 5 groups (Figure 4). It suggests that connectomic analysis can help
distinguishing neurodegenerative diseases based on their targets, i.e. long-range or
short-range networks, as they would cause opposite changes in clustering coefficients.
4.6. Limitations
The main limitation of this work is the relatively small size of the cohort, particularly of the
MCI A-N+ and MCI A+N- subgroups (respectively 15 and 19 patients). This may have led to
reduced statistical power to detect differences between groups, and it is possible that
additional alterations would be discovered within a larger cohort. Another limitation is that
our biomarker-based stratification model did not use the very recently published unbiased
A/T/N classification scheme incorporating tau biomarkers (T) (Jack et al., 2016a). We did not
incorporate tau biomarkers in our classification because tau PET imaging was not available in
A/N classification scheme is consistent with that of previous studies distinguishing between
MCI patients. Nevertheless, future studies using the A/T/N scheme would be particularly
useful to disentangle the specific contribution of tau to structural network alterations. It can be
noted that our diagnostic groups display significant differences in ages, with MCI A+N+ and
MCI A-N+ groups being significantly older than MCI A-N- and MCI A+N-. This is
consistent with previous work on subjects with MCI showing that MCI A+N+ and MCI A-N+
are characteristic of an older population (Petersen et al., 2013; Wisse et al., 2015). Age and
years of education have been shown to have a significant impact on white matter
microstructure (Teipel et al., 2009). Because our diagnostic groups displayed significant
differences in age and education, we regressed out their effect on our variables of interest.
Consistent with previous studies, the MCI A-N+ subjects of our report presented a less important proportion of APOEε4 carriers than MCI A+N+ individuals (Jack et al., 2016b; Vos
et al., 2013).
5. Conclusions
Using advanced image processing and network analysis techniques, we demonstrated that
MCI subgroups display distinct patterns of alteration and can be differentiate using DTI and
connectome analysis. Among MCI subgroups, only MCI A+N+ displayed an AD-like
disconnection pattern suggesting that connectomic studies interested in prodromal AD may
gain in specificity by enriching their sample with individuals who are positive for both
amyloid and neurodegeneration. MCI A-N+ displayed a wider but weaker pattern of alteration
supporting the hypothesis of a multiplicity of etiologies and a non-AD origin of these patients.
6. Acknowledgements
This work was supported by the program “Investissements d’avenir” ANR-10-IAIHU-06
supported by a “Contrat d’Interface Local” from Assistance Publique-Hôpitaux de Paris
(AP-HP). H.H. is supported by the AXA Research Fund, the Fondation Université Pierre et Marie
Curie and the “Fondation pour la Recherche sur Alzheimer”, Paris, France.
The sponsors of the study had no role in study design, data analysis or interpretation, writing
or decision to submit the report for publication.
7. Disclosure statement
The authors declare that they have no conflicts of interest.
8. References
Acosta-Cabronero, J., Williams, G.B., Pengas, G., Nestor, P.J., 2010. Absolute diffusivities
define the landscape of white matter degeneration in Alzheimer’s disease. Brain 133,
529–539. doi:10.1093/brain/awp257
Albert, M.S., DeKosky, S.T., Dickson, D., Dubois, B., Feldman, H.H., Fox, N.C., Gamst, A.,
Holtzman, D.M., Jagust, W.J., Petersen, R.C., Snyder, P.J., Carrillo, M.C., Thies, B., Phelps, C.H., 2011. The diagnosis of mild cognitive impairment due to Alzheimer’s
disease: Recommendations from the National Institute on Aging-Alzheimer’s
Association workgroups on diagnostic guidelines for Alzheimer’s disease. Alzheimers
Dement. 7, 270–279. doi:10.1016/j.jalz.2011.03.008
Alexander, A.L., Hurley, S.A., Samsonov, A.A., Adluru, N., Hosseinbor, A.P., Mossahebi, P.,
Tromp, D.P.M., Zakszewski, E., Field, A.S., 2011. Characterization of Cerebral White
Matter Properties Using Quantitative Magnetic Resonance Imaging Stains. Brain
Connect. 1, 423–446. doi:10.1089/brain.2011.0071
Avants, B.B., Epstein, C.L., Grossman, M., Gee, J.C., 2008. Symmetric diffeomorphic image
neurodegenerative brain. Med. Image Anal. 12, 26–41.
doi:10.1016/j.media.2007.06.004
Bartzokis, G., 2011. Alzheimer’s disease as homeostatic responses to age-related myelin
breakdown. Neurobiol. Aging 32, 1341–1371.
doi:10.1016/j.neurobiolaging.2009.08.007
Bollobás, B., 1998. Modern graph theory, Graduate texts in mathematics. Springer, New
York.
Braak, H., Braak, E., 1997. Frequency of stages of Alzheimer-related lesions in different age
categories. Neurobiol. Aging 18, 351–357.
Braskie, M.N., Jahanshad, N., Stein, J.L., Barysheva, M., McMahon, K.L., de Zubicaray, G.I.,
Martin, N.G., Wright, M.J., Ringman, J.M., Toga, A.W., Thompson, P.M., 2011. Common Alzheimer’s disease risk variant within the CLU gene affects white matter
microstructure in young adults. J. Neurosci. Off. J. Soc. Neurosci. 31, 6764–6770.
doi:10.1523/JNEUROSCI.5794-10.2011
Caroli, A., Prestia, A., Galluzzi, S., Ferrari, C., van der Flier, W.M., Ossenkoppele, R., Van
Berckel, B., Barkhof, F., Teunissen, C., Wall, A.E., Carter, S.F., Scholl, M., Choo,
I.H., Grimmer, T., Redolfi, A., Nordberg, A., Scheltens, P., Drzezga, A., Frisoni, G.B., For the Alzheimer’s Disease Neuroimaging Initiative, 2015. Mild cognitive
impairment with suspected nonamyloid pathology (SNAP): Prediction of progression.
Neurology 84, 508–515. doi:10.1212/WNL.0000000000001209
Caso, F., Agosta, F., Mattavelli, D., Migliaccio, R., Canu, E., Magnani, G., Marcone, A.,
Copetti, M., Falautano, M., Comi, G., Falini, A., Filippi, M., 2015. White Matter
Degeneration in Atypical Alzheimer Disease. Radiology 277, 162–172.
doi:10.1148/radiol.2015142766
Cho, S., Metcalfe, A.W.S., Young, C.B., Ryali, S., Geary, D.C., Menon, V., 2012.
Maturation of Children’s Fact Retrieval. J. Cogn. Neurosci. 24, 1849–1866.
doi:10.1162/jocn_a_00246
Daianu, M., Dennis, E.L., Jahanshad, N., Nir, T.M., Toga, A.W., Jack, C.R., Weiner, M.W., Thompson, P.M., 2013a. Alzheimer’s disease disrupts rich club organization in brain
connectivity networks. IEEE, pp. 266–269. doi:10.1109/ISBI.2013.6556463
Daianu, M., Jahanshad, N., Nir, T.M., Toga, A.W., Jack, C.R., Weiner, M.W., Thompson, for the Alzheimer’s Disea, P.M., 2013b. Breakdown of Brain Connectivity Between
Normal Aging and Alzheimer’s Disease: A Structural k -Core Network Analysis.
Brain Connect. 3, 407–422. doi:10.1089/brain.2012.0137
Daitz, H.M., Powell, T.P., 1954. Studies of the connexions of the fornix system. J. Neurol.
Neurosurg. Psychiatry 17, 75–82.
De Vico Fallani, F., Richiardi, J., Chavez, M., Achard, S., 2014. Graph analysis of functional
brain networks: practical issues in translational neuroscience. Philos. Trans. R. Soc. B
Biol. Sci. 369, 20130521–20130521. doi:10.1098/rstb.2013.0521
Delano-Wood, L., Stricker Nikki, H., Sorg Scott, F., Nation Daniel, A., Jak Amy, J., Woods
Steven, P., Libon David, J., Delis Dean, C., Frank Lawrence, R., Bondi Mark, W.,
2012. Posterior Cingulum White Matter Disruption and Its Associations with Verbal
Memory and Stroke Risk in Mild Cognitive Impairment. J. Alzheimeraposs Dis. 589–
603. doi:10.3233/JAD-2012-102103
Dubois, B., Feldman, H.H., Jacova, C., Hampel, H., Molinuevo, J.L., Blennow, K., DeKosky,
S.T., Gauthier, S., Selkoe, D., Bateman, R., Cappa, S., Crutch, S., Engelborghs, S.,
Frisoni, G.B., Fox, N.C., Galasko, D., Habert, M.-O., Jicha, G.A., Nordberg, A.,
Pasquier, F., Rabinovici, G., Robert, P., Rowe, C., Salloway, S., Sarazin, M.,
Epelbaum, S., de Souza, L.C., Vellas, B., Visser, P.J., Schneider, L., Stern, Y.,
Alzheimer’s disease: the IWG-2 criteria. Lancet Neurol. 13, 614–629.
doi:10.1016/S1474-4422(14)70090-0
Edmonds, E.C., Delano-Wood, L., Galasko, D.R., Salmon, D.P., Bondi, M.W., 2015. Subtle Cognitive Decline and Biomarker Staging in Preclinical Alzheimer’s Disease. J.
Alzheimers Dis. 47, 231–242. doi:10.3233/JAD-150128
Eustache, P., Nemmi, F., Saint-Aubert, L., Pariente, J., Péran, P., 2016. Multimodal Magnetic
Resonance Imaging in Alzheimer’s Disease Patients at Prodromal Stage. J.
Alzheimers Dis. JAD 50, 1035–1050. doi:10.3233/JAD-150353
Ferri, C.P., Prince, M., Brayne, C., Brodaty, H., Fratiglioni, L., Ganguli, M., Hall, K.,
Hasegawa, K., Hendrie, H., Huang, Y., Jorm, A., Mathers, C., Menezes, P.R., Rimmer, E., Scazufca, M., Alzheimer’s Disease International, 2005. Global
prevalence of dementia: a Delphi consensus study. Lancet Lond. Engl. 366, 2112–
2117. doi:10.1016/S0140-6736(05)67889-0
Fischer, F.U., Wolf, D., Scheurich, A., Fellgiebel, A., 2015. Altered whole-brain white matter networks in preclinical Alzheimer’s disease. NeuroImage Clin. 8, 660–666.
doi:10.1016/j.nicl.2015.06.007
Fischl, B., van der Kouwe, A., Destrieux, C., Halgren, E., Ségonne, F., Salat, D.H., Busa, E.,
Seidman, L.J., Goldstein, J., Kennedy, D., Caviness, V., Makris, N., Rosen, B., Dale,
A.M., 2004. Automatically parcellating the human cerebral cortex. Cereb. Cortex N.
Y. N 1991 14, 11–22.
Gold, B.T., Zhu, Z., Brown, C.A., Andersen, A.H., LaDu, M.J., Tai, L., Jicha, G.A., Kryscio,
R.J., Estus, S., Nelson, P.T., Scheff, S.W., Abner, E., Schmitt, F.A., Van Eldik, L.J.,
Smith, C.D., 2014. White matter integrity is associated with cerebrospinal fluid markers of Alzheimer’s disease in normal adults. Neurobiol. Aging 35, 2263–2271.